PROTECTED SOURCE SCRIPT
Cập nhật BULB 20
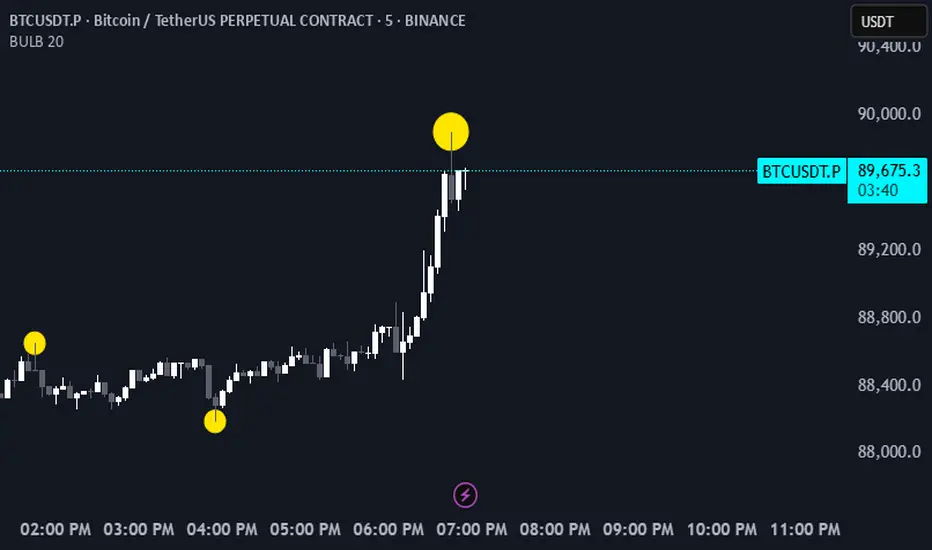
Fractal Wave Marker Indicator
The Fractal Wave Marker is a technical analysis tool designed to visually highlight significant turning points in price action, offering clear signals of potential market reversals. By detecting fractal-like patterns, the indicator identifies high and low points within a specified period, helping traders pinpoint key market swings.
Key Features:
Fixed Period: The period is set to .., ensuring consistency in detecting turning points based on historical price data.
Swing Detection: The indicator detects both base (lower-degree) and fractal (higher-degree) swings, helping to visualize both short-term and long-term trend changes.
Color-coded Markers: High points are marked with a custom color to indicate bullish conditions, while low points are marked in another color for bearish conditions.
Wave Processing: The indicator processes swing highs and lows, dynamically updating to reflect the most relevant turning points on the chart.
Overlay on Chart: Markers are overlaid directly on the chart for quick, intuitive insights into price action, helping traders make better entry and exit decisions.
How It Works:
The indicator calculates the highest highs and lowest lows over a -bar period (fixed period).
When a new swing point is detected, the indicator marks it with a circle, color-coded based on whether it’s a high or low point.
The base swing and fractal wave directions are updated with each new turning point, allowing traders to follow price action and identify market trends.
Phát hành các Ghi chú
Fractal Wave Marker IndicatorThe Fractal Wave Marker is a technical analysis tool designed to visually highlight significant turning points in price action, offering clear signals of potential market reversals. By detecting fractal-like patterns, the indicator identifies high and low points within a specified period, helping traders pinpoint key market swings.
Key Features:
Fixed Period: The period is set to .., ensuring consistency in detecting turning points based on historical price data.
Swing Detection: The indicator detects both base (lower-degree) and fractal (higher-degree) swings, helping to visualize both short-term and long-term trend changes.
Color-coded Markers: High points are marked with a custom color to indicate bullish conditions, while low points are marked in another color for bearish conditions.
Wave Processing: The indicator processes swing highs and lows, dynamically updating to reflect the most relevant turning points on the chart.
Overlay on Chart: Markers are overlaid directly on the chart for quick, intuitive insights into price action, helping traders make better entry and exit decisions.
How It Works:
The indicator calculates the highest highs and lowest lows over a -bar period (fixed period).
When a new swing point is detected, the indicator marks it with a circle, color-coded based on whether it’s a high or low point.
The base swing and fractal wave directions are updated with each new turning point, allowing traders to follow price action and identify market trends.
Mã được bảo vệ
Tập lệnh này được đăng dưới dạng mã nguồn đóng. Tuy nhiên, bạn có thể tự do sử dụng tập lệnh mà không có bất kỳ hạn chế nào – tìm hiểu thêm tại đây.
Thông báo miễn trừ trách nhiệm
Thông tin và ấn phẩm không có nghĩa là và không cấu thành, tài chính, đầu tư, kinh doanh, hoặc các loại lời khuyên hoặc khuyến nghị khác được cung cấp hoặc xác nhận bởi TradingView. Đọc thêm trong Điều khoản sử dụng.