PROTECTED SOURCE SCRIPT
Cập nhật Session Highs and Lows - TW

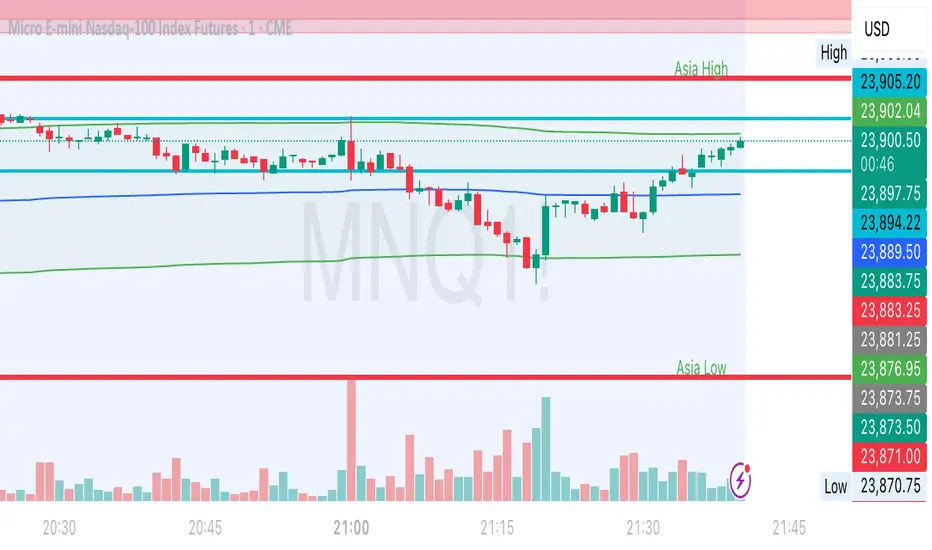
This indicator plots the following:
- Previous day's high and low (based on previous daily candle) - purple
- Asia high and low (1800-0200) - red
- London high and low (0300-0930) - blue
Once a high or low is hit or passed during the NY session, the line reduces in thickness to show that this point of interest has been taken. The thinner lines remain on the chart as a reference so it's easy to discern POIs that are still in play vs. those that have been taken.
Phát hành các Ghi chú
This indicator plots the following:- Previous day's high and low (based on previous daily candle) - purple
- Asia high and low (1800-0200) - red
- London high and low (0300-0930) - blue
Once a high or low is hit or passed during the NY session, the line reduces in thickness to show that this point of interest has been taken. The thinner lines remain on the chart as a reference so it's easy to discern POIs that are still in play vs. those that have been taken.
Phát hành các Ghi chú
Updated to fix some bugs and change the label color to be visible on dark or light backgrounds.Mã được bảo vệ
Tập lệnh này được đăng dưới dạng mã nguồn đóng. Tuy nhiên, bạn có thể sử dụng tự do và không giới hạn – tìm hiểu thêm tại đây.
Thông báo miễn trừ trách nhiệm
Thông tin và các ấn phẩm này không nhằm mục đích, và không cấu thành, lời khuyên hoặc khuyến nghị về tài chính, đầu tư, giao dịch hay các loại khác do TradingView cung cấp hoặc xác nhận. Đọc thêm tại Điều khoản Sử dụng.
Mã được bảo vệ
Tập lệnh này được đăng dưới dạng mã nguồn đóng. Tuy nhiên, bạn có thể sử dụng tự do và không giới hạn – tìm hiểu thêm tại đây.
Thông báo miễn trừ trách nhiệm
Thông tin và các ấn phẩm này không nhằm mục đích, và không cấu thành, lời khuyên hoặc khuyến nghị về tài chính, đầu tư, giao dịch hay các loại khác do TradingView cung cấp hoặc xác nhận. Đọc thêm tại Điều khoản Sử dụng.