PROTECTED SOURCE SCRIPT
Cập nhật xGhozt Wickless Candle Streak Probability
The xGhozt Wickless Candle Streak Probability is a custom Pine Script indicator designed to identify and quantify the occurrence of consecutive "wickless" candles of the same trend (either bullish or bearish).
Key Features:
Wickless Candle Detection: It first identifies candles that lack an upper or lower wick (meaning their open/close is equal to their high/low, respectively).
Consecutive Streak Tracking: The indicator tracks how many wickless bullish candles occur in a row, and similarly for wickless bearish candles.
User-Defined Streak Length: You can specify a Streak Length in the indicator's settings. This defines how many consecutive wickless candles are needed to register a "streak."
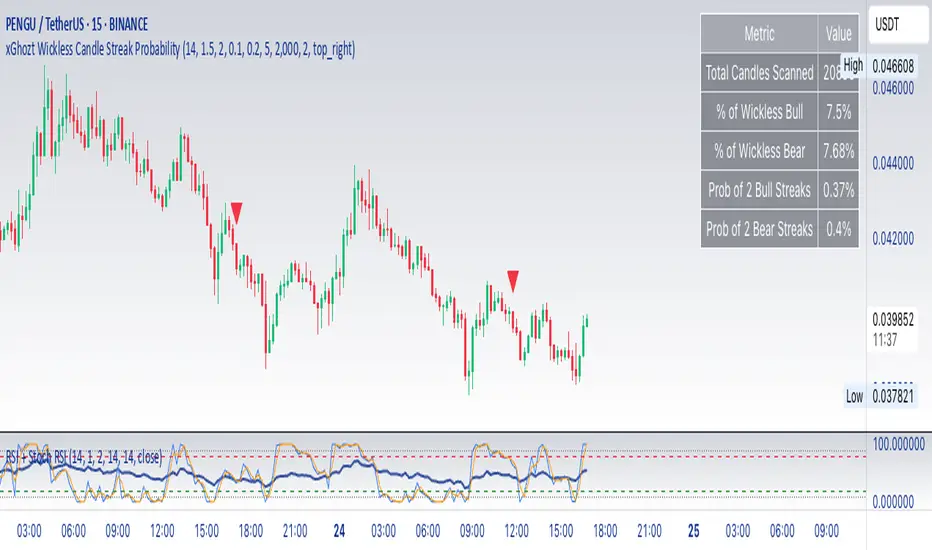
Probability Calculation: For the chosen Streak Length, the indicator calculates the historical probability (as a percentage) of encountering such a streak for both bullish and bearish wickless candles. This is done by dividing the number of times a streak of that length has occurred by the total number of candles scanned.
On-Chart Display: The results, including the total wickless candles, total scanned candles, and the calculated streak probabilities, are displayed in a convenient table directly on your chart.
Purpose:
This indicator helps traders and analysts understand the historical likelihood of sustained, strong directional moves as indicated by consecutive wickless candles. By quantifying these probabilities, it can provide insights into potential continuation patterns or extreme market conditions, which might be useful for developing trading strategies or confirming market biases.
Key Features:
Wickless Candle Detection: It first identifies candles that lack an upper or lower wick (meaning their open/close is equal to their high/low, respectively).
Consecutive Streak Tracking: The indicator tracks how many wickless bullish candles occur in a row, and similarly for wickless bearish candles.
User-Defined Streak Length: You can specify a Streak Length in the indicator's settings. This defines how many consecutive wickless candles are needed to register a "streak."
Probability Calculation: For the chosen Streak Length, the indicator calculates the historical probability (as a percentage) of encountering such a streak for both bullish and bearish wickless candles. This is done by dividing the number of times a streak of that length has occurred by the total number of candles scanned.
On-Chart Display: The results, including the total wickless candles, total scanned candles, and the calculated streak probabilities, are displayed in a convenient table directly on your chart.
Purpose:
This indicator helps traders and analysts understand the historical likelihood of sustained, strong directional moves as indicated by consecutive wickless candles. By quantifying these probabilities, it can provide insights into potential continuation patterns or extreme market conditions, which might be useful for developing trading strategies or confirming market biases.
Phát hành các Ghi chú
changed the label iconsPhát hành các Ghi chú
updated numbers tablePhát hành các Ghi chú
updated odds calculationsPhát hành các Ghi chú
Cleaner chart, smaller labelsPhát hành các Ghi chú
Aesthetics changesMã được bảo vệ
Tập lệnh này được đăng dưới dạng mã nguồn đóng. Tuy nhiên, bạn có thể sử dụng tự do và không giới hạn – tìm hiểu thêm tại đây.
Thông báo miễn trừ trách nhiệm
Thông tin và các ấn phẩm này không nhằm mục đích, và không cấu thành, lời khuyên hoặc khuyến nghị về tài chính, đầu tư, giao dịch hay các loại khác do TradingView cung cấp hoặc xác nhận. Đọc thêm tại Điều khoản Sử dụng.
Mã được bảo vệ
Tập lệnh này được đăng dưới dạng mã nguồn đóng. Tuy nhiên, bạn có thể sử dụng tự do và không giới hạn – tìm hiểu thêm tại đây.
Thông báo miễn trừ trách nhiệm
Thông tin và các ấn phẩm này không nhằm mục đích, và không cấu thành, lời khuyên hoặc khuyến nghị về tài chính, đầu tư, giao dịch hay các loại khác do TradingView cung cấp hoặc xác nhận. Đọc thêm tại Điều khoản Sử dụng.