OPEN-SOURCE SCRIPT
Wyckoff Volume Color
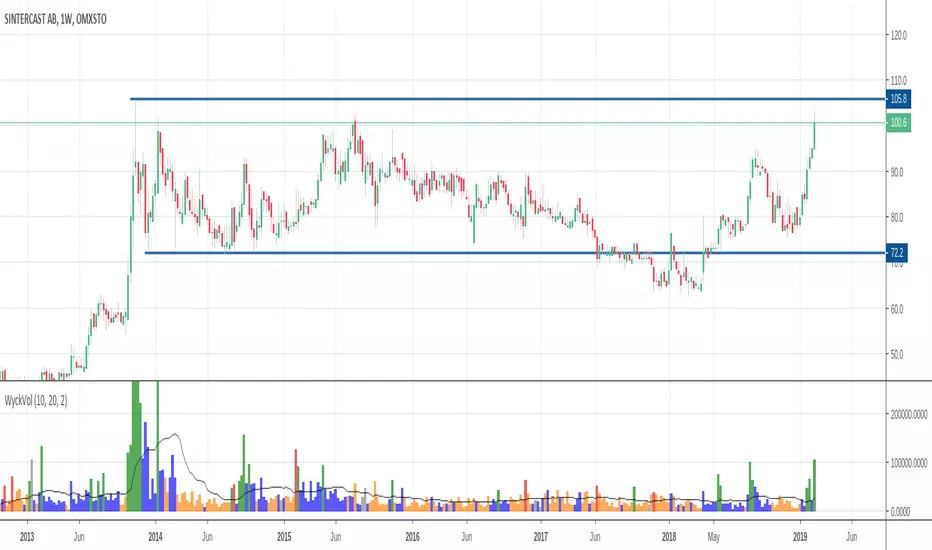
This volume indicator is intended to be used for the Wyckoff strategy.
Green volume bar indicates last price close above close 10 days ago together with volume larger than 2 * SMA(volume, 20)
Blue volume bar indicates last price close above close 10 days ago together with volume less than 2 * SMA(volume, 20)
Orange volume bar indicates last price close lower than close 10 days ago together with volume less than 2 * SMA(volume, 20)
Red volume bar indicates last price close lower than close 10 days ago together with volume larger than 2 * SMA(volume, 20)
The main purpose is to have green bars with a buying climax and red bars with a selling climax.
Three variables can be changed by simply pressing the settings button.
How many days back the closing price is compared to. Now 10 days.
How many times the SMA(volume) is multiplied by. Now times 2.
How many days the SMA(volume) consists by. Now 20 days.
Mã nguồn mở
Theo đúng tinh thần TradingView, tác giả của tập lệnh này đã công bố nó dưới dạng mã nguồn mở, để các nhà giao dịch có thể xem xét và xác minh chức năng. Chúc mừng tác giả! Mặc dù bạn có thể sử dụng miễn phí, hãy nhớ rằng việc công bố lại mã phải tuân theo Nội quy.
Thông báo miễn trừ trách nhiệm
Thông tin và các ấn phẩm này không nhằm mục đích, và không cấu thành, lời khuyên hoặc khuyến nghị về tài chính, đầu tư, giao dịch hay các loại khác do TradingView cung cấp hoặc xác nhận. Đọc thêm tại Điều khoản Sử dụng.