PROTECTED SOURCE SCRIPT
Cập nhật Market Balance
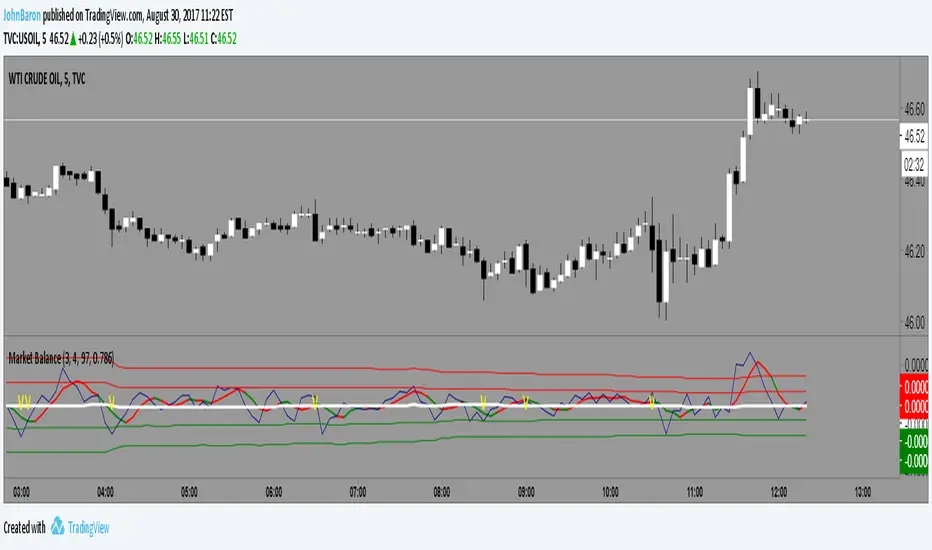
This indicator simply tracks the balance of the supply/demand and will always revert to the mean.
If the market is over bought it will move above the mean, hit a limit and come back toward the mean. Opposite for oversold.
The difference between this and MFI or RSI is that a market can move up or down in an organized fashion and stay close to the mean. It is impulsive moves up or down that will correct.
So a trader might be able to gauge whether an given stock has the likelihood to pullback or bounce based on this indicator.
The color indicator attempts to predict the color of the next bar.
Works well with Heiken Ashi style candles as well.
Phát hành các Ghi chú
Added .. balance zonePhát hành các Ghi chú
Some small aesthetics.Note, the color indicator on the moving average is a prediction of the next bar color.
Mã được bảo vệ
Tập lệnh này được đăng dưới dạng mã nguồn đóng. Tuy nhiên, bạn có thể sử dụng tự do và không giới hạn – tìm hiểu thêm tại đây.
Thông báo miễn trừ trách nhiệm
Thông tin và các ấn phẩm này không nhằm mục đích, và không cấu thành, lời khuyên hoặc khuyến nghị về tài chính, đầu tư, giao dịch hay các loại khác do TradingView cung cấp hoặc xác nhận. Đọc thêm tại Điều khoản Sử dụng.