OPEN-SOURCE SCRIPT
Volume +OBV + ADX
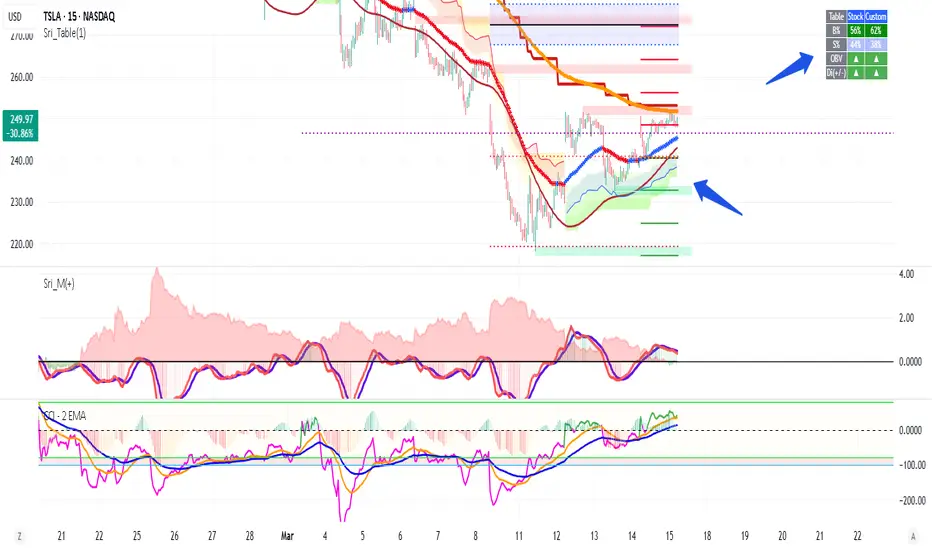
Volume + OBV + ADX Table
Optimized Buyer & Seller Volume with Trend Indications
Overview:
This indicator provides a comprehensive view of market participation and trend strength by integrating Volume, On Balance Volume (OBV) trends, and ADX (Average Directional Index) signals into a visually structured table. Designed for quick decision-making, it highlights buyer and seller dominance while comparing the selected stock with another custom symbol.
Features:
✅ Buyer & Seller Volume Analysis:
Computes buyer and seller volume percentages based on market movements.
Displays daily cumulative volume statistics to assess ongoing market participation.
✅ On Balance Volume (OBV) Trends:
Identifies positive, negative, or neutral OBV trends using an advanced smoothing mechanism.
Highlights accumulation or distribution phases with colored visual cues.
✅ ADX-Based Trend Confirmation:
Evaluates Directional Indicators (DI+ and DI-) to determine the trend direction.
Uses customizable ADX settings to filter out weak trends.
Provides uptrend, downtrend, or neutral signals based on strength conditions.
✅ Custom Symbol Comparison:
Allows users to compare two different assets (e.g., a stock vs. an index or ETF).
Displays a side-by-side comparison of volume dynamics and trend strength.
✅ User-Friendly Table Display:
Presents real-time calculations in a compact and structured table format.
Uses color-coded trend signals for easier interpretation.
Recommended Usage for Best Results:
📌 Pairing this indicator with Sri_Momentum and Sri(+) Pivot will enhance accuracy and provide better trade confirmations.
📌 Adding other major indicators like RSI, CCI, etc., will further increase the probability of winning trades.
How to Use:
Select a custom symbol for comparison.
Adjust ADX settings based on market conditions.
Analyze the table to identify buyer/seller dominance, OBV trends, and ADX trend strength.
Use the combined signals to confirm trade decisions and market direction.
Best Use Cases:
🔹 Trend Confirmation – Validate breakout or reversal signals.
🔹 Volume Strength Analysis – Assess buyer/seller participation before entering trades.
🔹 Multi-Asset Comparison – Compare the behavior of two related instruments.
This indicator is ideal for traders looking to combine volume dynamics with trend-following strategies. 🚀📈
Mã nguồn mở
Theo đúng tinh thần TradingView, tác giả của tập lệnh này đã công bố nó dưới dạng mã nguồn mở, để các nhà giao dịch có thể xem xét và xác minh chức năng. Chúc mừng tác giả! Mặc dù bạn có thể sử dụng miễn phí, hãy nhớ rằng việc công bố lại mã phải tuân theo Nội quy.
Thông báo miễn trừ trách nhiệm
Thông tin và các ấn phẩm này không nhằm mục đích, và không cấu thành, lời khuyên hoặc khuyến nghị về tài chính, đầu tư, giao dịch hay các loại khác do TradingView cung cấp hoặc xác nhận. Đọc thêm tại Điều khoản Sử dụng.