PROTECTED SOURCE SCRIPT
Cập nhật TRADE ORBIT:INVESTMENT INDICATOR
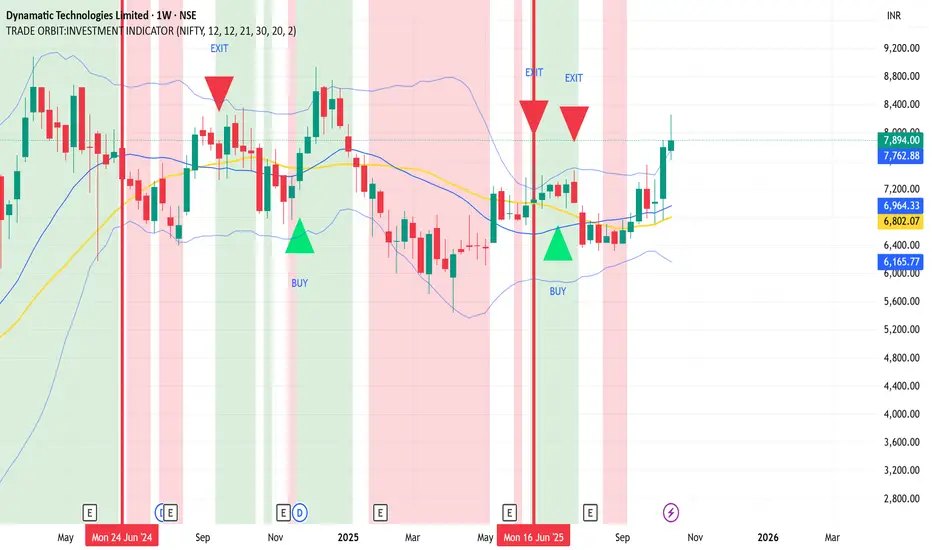
Key Features:
Relative Strength vs NIFTY
Monthly RS(12): Measures how the symbol is performing relative to NIFTY over the past 12 months.
Positive RS indicates the symbol is outperforming the benchmark.
Momentum Filter (Weekly RSI)
Weekly RSI(12) identifies bullish or bearish momentum.
Background turns green when RSI > 50 and monthly RS > 0, signaling a strong bullish environment.
Background turns red when RSI < 50, monthly RS < 0, and weekly RS(21) < 0, signaling weakness.
Weekly RS(21) Buy/Exit Signals
Buy Signal: Triggered when weekly RS(21) crosses above 0 while background is green, confirming momentum breakout.
Exit Signal: Triggered when weekly RS(21) crosses below 0 while background is green, signaling a reversal in momentum.
Trend & Volatility Tools
SMA 30: Displays the short-term trend for price alignment.
Bollinger Bands (20,2): Measures volatility and potential support/resistance zones.
Visuals:
Green/Red semi-transparent backgrounds for bullish/bearish zones.
Buy signals marked with green upward triangles; Exit signals marked with red downward triangles.
SMA30 plotted in yellow; Bollinger Bands plotted in blue.
How to Use:
Entry: Look for green background + weekly RS(21) crossing above zero.
Exit: Close positions when weekly RS(21) crosses below zero.
Use SMA30 and Bollinger Bands to confirm trend and volatility alignment.
This indicator is perfect for traders who want a multi-timeframe strategy combining momentum, relative strength, and trend/volatility confirmation in a single chart overlay
Phát hành các Ghi chú
Key Features:Relative Strength vs NIFTY
Monthly RS(12): Measures how the symbol is performing relative to NIFTY over the past 12 months.
Positive RS indicates the symbol is outperforming the benchmark.
Momentum Filter (Weekly RSI)
Weekly RSI(12) identifies bullish or bearish momentum.
Background turns green when RSI > 50 and monthly RS > 0, signaling a strong bullish environment.
Background turns red when RSI < 50, monthly RS < 0, and weekly RS(21) < 0, signaling weakness.
Weekly RS(21) Buy/Exit Signals
Buy Signal: Triggered when weekly RS(21) crosses above 0 while background is green, confirming momentum breakout.
Exit Signal: Triggered when weekly RS(21) crosses below 0 while background is green, signaling a reversal in momentum.
Trend & Volatility Tools
SMA 30: Displays the short-term trend for price alignment.
Bollinger Bands (20,2): Measures volatility and potential support/resistance zones.
Visuals:
Green/Red semi-transparent backgrounds for bullish/bearish zones.
Buy signals marked with green upward triangles; Exit signals marked with red downward triangles.
SMA30 plotted in yellow; Bollinger Bands plotted in blue.
How to Use:
Entry: Look for green background + weekly RS(21) crossing above zero.
Exit: Close positions when weekly RS(21) crosses below zero.
Use SMA30 and Bollinger Bands to confirm trend and volatility alignment.
This indicator is perfect for traders who want a multi-timeframe strategy combining momentum, relative strength, and trend/volatility confirmation in a single chart overlay
Mã được bảo vệ
Tập lệnh này được đăng dưới dạng mã nguồn đóng. Tuy nhiên, bạn có thể tự do sử dụng tập lệnh mà không có bất kỳ hạn chế nào – tìm hiểu thêm tại đây.
Thông báo miễn trừ trách nhiệm
Thông tin và ấn phẩm không có nghĩa là và không cấu thành, tài chính, đầu tư, kinh doanh, hoặc các loại lời khuyên hoặc khuyến nghị khác được cung cấp hoặc xác nhận bởi TradingView. Đọc thêm trong Điều khoản sử dụng.