Custom Fibonacci Support & Resistance Lines
The script detects the latest confirmed swing high and swing low on the chart and calculates two adaptive lines:
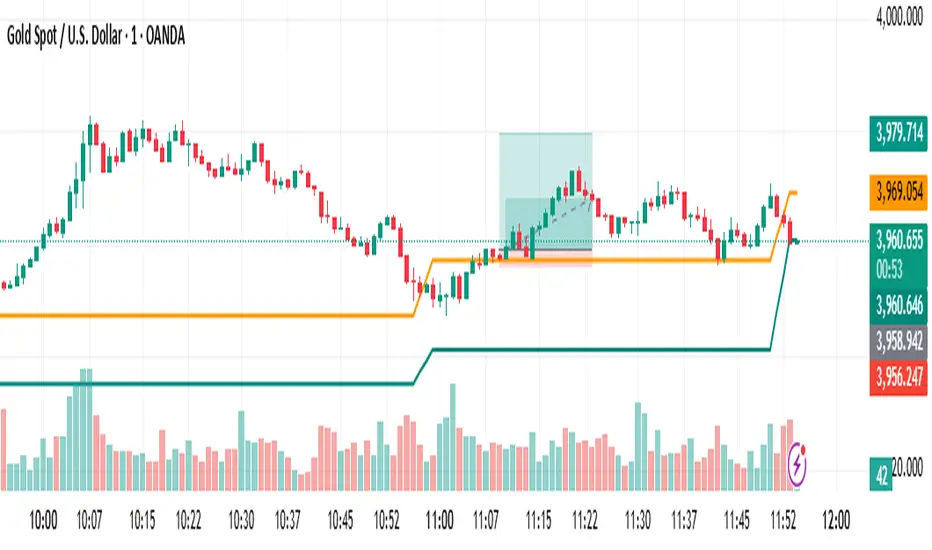
A Fibonacci Support Line below price (retracement from swing high to swing low).
A Fibonacci Resistance Line above price (retracement from swing low to swing high).
Both levels are smoothed using a simple moving average for a cleaner visual appearance — similar to an adaptive support/resistance band that follows recent market structure.
⚙️ Features
🔹 Auto-detects swing highs & lows using left/right bar pivots.
🔹 Adjustable Fibonacci levels for both Support and Resistance.
🔹 Adjustable smoothing length for smoother or more reactive lines.
🔹 Works across any timeframe and instrument.
🔹 Ideal for spotting potential reversal zones, trend continuation areas, and dynamic price support/resistance.
🧮 Default Settings
Fibonacci Level (Support) = 0.618
Fibonacci Level (Resistance) = 0.618
Left/Right Swing Bars = 5 / 5
Smoothing Length = 3
💡 Usage Tips
Combine these dynamic Fibonacci lines with trend indicators (EMA, RSI, or structure breaks) to confirm entries.
Increase Left/Right Swing Bars for stronger structural pivots on higher timeframes.
Change Fibonacci Levels (e.g., 0.382, 0.5, 0.786) to visualize multiple retracement zones.
Tập lệnh chỉ hiển thị cho người được mời
Chỉ những người dùng được tác giả đồng ý mới có thể truy cập tập lệnh này. Bạn cần yêu cầu và xin phép sử dụng tập lệnh này. Quyền truy cập thường được cấp sau khi thanh toán. Để biết thêm chi tiết, hãy làm theo hướng dẫn của tác giả bên dưới hoặc liên hệ trực tiếp với ChartTechnical.
TradingView KHÔNG khuyến khích trả tiền hoặc sử dụng tập lệnh trừ khi bạn hoàn toàn tin tưởng tác giả và hiểu cách hoạt động của tập lệnh. Bạn cũng có thể tìm thấy các giải pháp thay thế miễn phí, mã nguồn mở trong mục tập lệnh cộng đồng của chúng tôi.
Hướng dẫn của tác giả
Thông báo miễn trừ trách nhiệm
Tập lệnh chỉ hiển thị cho người được mời
Chỉ những người dùng được tác giả đồng ý mới có thể truy cập tập lệnh này. Bạn cần yêu cầu và xin phép sử dụng tập lệnh này. Quyền truy cập thường được cấp sau khi thanh toán. Để biết thêm chi tiết, hãy làm theo hướng dẫn của tác giả bên dưới hoặc liên hệ trực tiếp với ChartTechnical.
TradingView KHÔNG khuyến khích trả tiền hoặc sử dụng tập lệnh trừ khi bạn hoàn toàn tin tưởng tác giả và hiểu cách hoạt động của tập lệnh. Bạn cũng có thể tìm thấy các giải pháp thay thế miễn phí, mã nguồn mở trong mục tập lệnh cộng đồng của chúng tôi.