OPEN-SOURCE SCRIPT
ETH Top, Mid and Bottom Cap Bands [jcray]
Modified from Average Cap [aamonkey] and Top Cap [aamonkey].
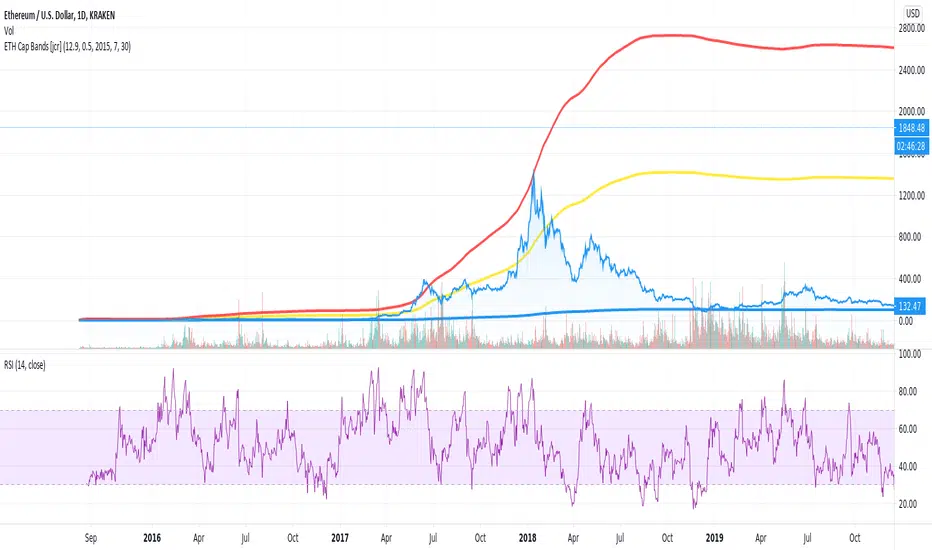
The top cap (red line) can be seen as an absolute market top that may never be significantly exceeded and so is a good indicator to sell a position, or enter a long-term short-sell.
The mid cap (yellow line) can be used as an indicator for market sentiment. Above the mid cap, the market is in a bullish environment, and below it, the market is in a bearish environment.
The bottom cap (blue line) can be seen as an absolute market bottom that may never be fallen short of, and so is a good indicator to enter a long-term buying opportunity, or exit a long-term short-sell.
Mã nguồn mở
Theo đúng tinh thần TradingView, tác giả của tập lệnh này đã công bố nó dưới dạng mã nguồn mở, để các nhà giao dịch có thể xem xét và xác minh chức năng. Chúc mừng tác giả! Mặc dù bạn có thể sử dụng miễn phí, hãy nhớ rằng việc công bố lại mã phải tuân theo Nội quy.
Thông báo miễn trừ trách nhiệm
Thông tin và các ấn phẩm này không nhằm mục đích, và không cấu thành, lời khuyên hoặc khuyến nghị về tài chính, đầu tư, giao dịch hay các loại khác do TradingView cung cấp hoặc xác nhận. Đọc thêm tại Điều khoản Sử dụng.