PROTECTED SOURCE SCRIPT
Cập nhật JamesCart's Feigenbaum Constant/Rate Of Change indicator
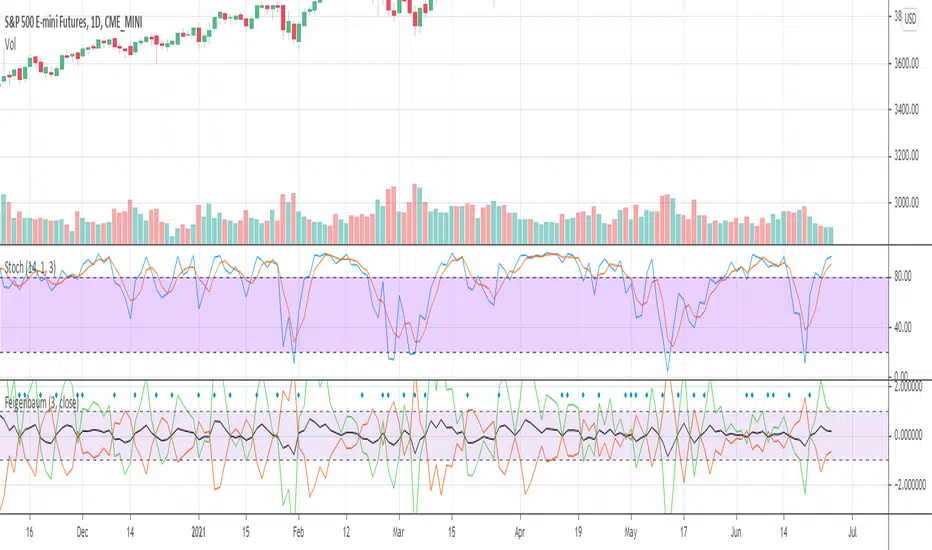
This is an indicator that compares the rate of change as a proportion to the Feigenbaum Constant (The black line). The green line is a positive divergence from the rate of change, the red is a negative divergence from the rate of change. When the Red line is on top and the green line is on the bottom, then that is a bearish trend. When the Green is on top and the red is on bottom, that is a bullish trend. The black line also helps indicate a general bullish or bearish trend based on how it moves.
When the lines "open up" that means a trend is beginning, when the lines close that means the trend is ending. This indicator is a powerful leading indicator and needs sensitive eyes. Every small movement needs to be given consideration.
When the lines "open up" that means a trend is beginning, when the lines close that means the trend is ending. This indicator is a powerful leading indicator and needs sensitive eyes. Every small movement needs to be given consideration.
Phát hành các Ghi chú
added resolution gaps to fix issues with custom timeframes. Phát hành các Ghi chú
added an area between 1 and -1 to make it easier to visually find large deviations from market noise.Mã được bảo vệ
Tập lệnh này được đăng dưới dạng mã nguồn đóng. Tuy nhiên, bạn có thể sử dụng tự do và không giới hạn – tìm hiểu thêm tại đây.
Thông báo miễn trừ trách nhiệm
Thông tin và các ấn phẩm này không nhằm mục đích, và không cấu thành, lời khuyên hoặc khuyến nghị về tài chính, đầu tư, giao dịch hay các loại khác do TradingView cung cấp hoặc xác nhận. Đọc thêm tại Điều khoản Sử dụng.
Mã được bảo vệ
Tập lệnh này được đăng dưới dạng mã nguồn đóng. Tuy nhiên, bạn có thể sử dụng tự do và không giới hạn – tìm hiểu thêm tại đây.
Thông báo miễn trừ trách nhiệm
Thông tin và các ấn phẩm này không nhằm mục đích, và không cấu thành, lời khuyên hoặc khuyến nghị về tài chính, đầu tư, giao dịch hay các loại khác do TradingView cung cấp hoặc xác nhận. Đọc thêm tại Điều khoản Sử dụng.