Trend Identifier
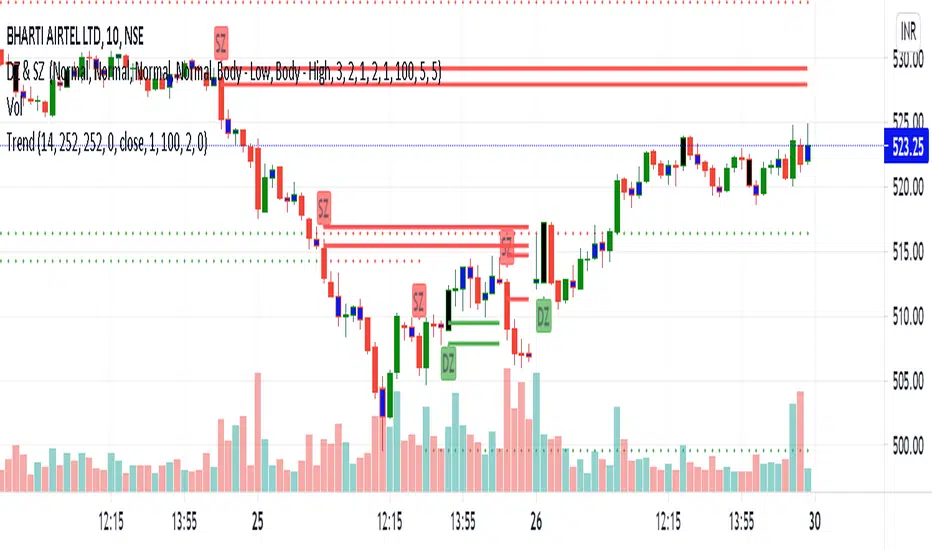
It shows the trend and RSI position for Intraday, Daily and Swing time-frame in one go.
IF RSI is > 70 = RSI High
RSI is < 65 > 35 = RSI Side
RSI is < 30 = RSI Low
For Trend High, Low and Side, it makes it's own calculation and identifies the trend for intermediate time frame.
It also shows the standard deviation information.
1sd = 1 standard deviation achieved.
2sd = 2 standard deviation achieved.
Weekly and Monthly std = Weekly and Monthly standard deviation achieved.
Based on your trading style one can hide the other trend std and RSI option.
PM us to obtain the access.
- Added Pivot support and Resistance which will compliment the Demand and Supply zones.
Tập lệnh chỉ hiển thị cho người được mời
Chỉ những người dùng được tác giả chấp thuận mới có thể truy cập tập lệnh này. Bạn sẽ cần yêu cầu và được cấp quyền sử dụng. Thông thường quyền này được cấp sau khi thanh toán. Để biết thêm chi tiết, làm theo hướng dẫn của tác giả bên dưới hoặc liên hệ trực tiếp với SupplyIsInDemand.
TradingView KHÔNG khuyến nghị bạn trả phí hoặc sử dụng một tập lệnh trừ khi bạn hoàn toàn tin tưởng vào tác giả và hiểu cách hoạt động của tập lệnh. Bạn cũng có thể tìm các lựa chọn miễn phí, mã nguồn mở trong các script cộng đồng của chúng tôi.
Hướng dẫn của tác giả
Thông báo miễn trừ trách nhiệm
Tập lệnh chỉ hiển thị cho người được mời
Chỉ những người dùng được tác giả chấp thuận mới có thể truy cập tập lệnh này. Bạn sẽ cần yêu cầu và được cấp quyền sử dụng. Thông thường quyền này được cấp sau khi thanh toán. Để biết thêm chi tiết, làm theo hướng dẫn của tác giả bên dưới hoặc liên hệ trực tiếp với SupplyIsInDemand.
TradingView KHÔNG khuyến nghị bạn trả phí hoặc sử dụng một tập lệnh trừ khi bạn hoàn toàn tin tưởng vào tác giả và hiểu cách hoạt động của tập lệnh. Bạn cũng có thể tìm các lựa chọn miễn phí, mã nguồn mở trong các script cộng đồng của chúng tôi.