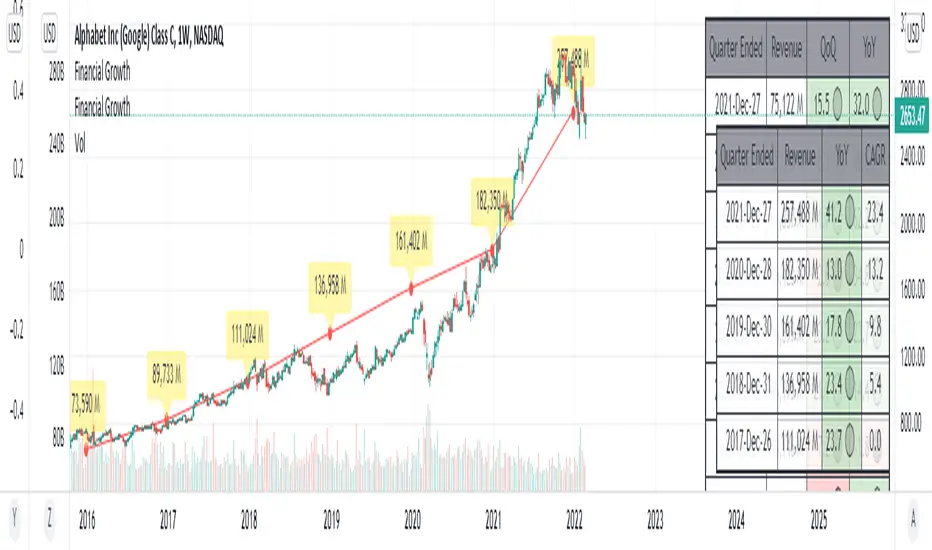
This indicator will acquire the financial data provided by Tradview.
the data is compare between Quarter, Annual and TTM in term of percent of growth.
YoY, QoQ and CAGR is also available by this script (The minimum is 4).
in addition, ploting of data, label and table also available (you can check the mark to toggle on / off).
Data : Revenue, Net Income, EBITDA, EPS, DVPS, Free Cash Flow and Forward PE .
How to use it.
just select the financial data, period and size of data to compare.
you can check the box to toggle the plotting line, label and table.
Enjoy.
Phát hành các Ghi chú
Fix comparison calculations Phát hành các Ghi chú
- More items added. - fixed CAGR.
New Items Added
- Key Financial Number : Revenue, Net Income, EBITDA, EPS, DVPS, Free Cash Flow, Total Debt
- Key Financial Ratio : Gross Margin, EBITDA Margin, Net Margin, ROE, ROA, Price to Book Value (P/BV), Price to Earnings (P/E)
Phát hành các Ghi chú
Update Detail : 2022-Dec-17- Add 2 financial items.
- Add eps, diluted.
- Re-arrange code.
Phát hành các Ghi chú
Re-arranged code. Add more items related to debt.
Phát hành các Ghi chú
there's some problem about version.so i updated again.
Mã nguồn mở
Theo đúng tinh thần TradingView, tác giả của tập lệnh này đã công bố nó dưới dạng mã nguồn mở, để các nhà giao dịch có thể xem xét và xác minh chức năng. Chúc mừng tác giả! Mặc dù bạn có thể sử dụng miễn phí, hãy nhớ rằng việc công bố lại mã phải tuân theo Nội quy.
Thông báo miễn trừ trách nhiệm
Thông tin và các ấn phẩm này không nhằm mục đích, và không cấu thành, lời khuyên hoặc khuyến nghị về tài chính, đầu tư, giao dịch hay các loại khác do TradingView cung cấp hoặc xác nhận. Đọc thêm tại Điều khoản Sử dụng.