OPEN-SOURCE SCRIPT
Enhanced Parabolic SAR + EMA 200 + MACD Signals
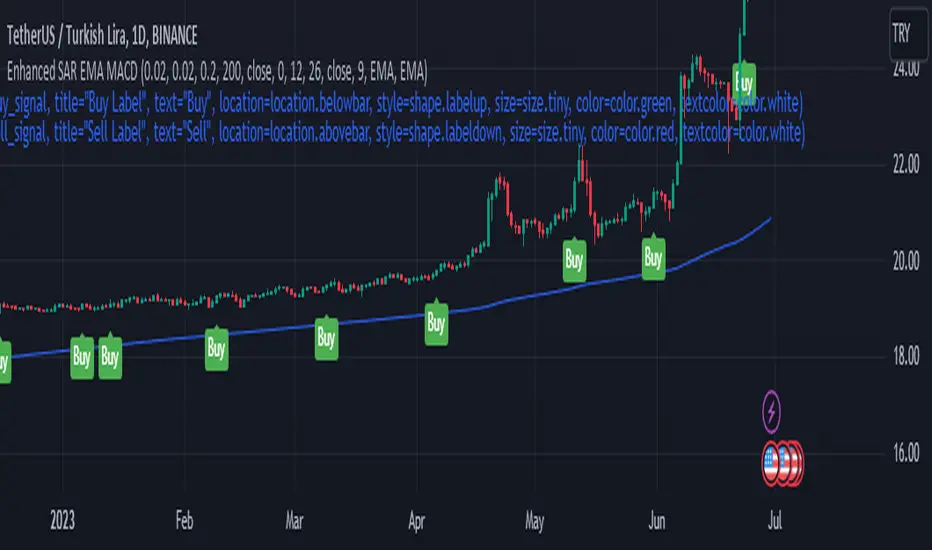
Parabolic SAR + EMA 200 + MACD Signals Indicator is a popular technical analysis tool used by traders to identify potential entry and exit points in the market. It combines three widely used indicators: Parabolic SAR, EMA 200, and MACD.
The Parabolic SAR indicator helps determine potential price reversals. It places dots above or below the price chart to indicate the direction of the trend. When the dots are below the price, it suggests an upward trend, and when they are above the price, it indicates a downward trend.
The EMA 200 (Exponential Moving Average 200) is a moving average that gives more weight to recent price data. It is often used as a significant support or resistance level. Traders consider the price to be in an uptrend if it is above the EMA 200 and in a downtrend if it is below the EMA 200.
The MACD (Moving Average Convergence Divergence) is a trend-following momentum indicator that calculates the difference between two exponential moving averages. It consists of a MACD line and a signal line. When the MACD line crosses above the signal line, it generates a bullish signal, indicating a potential buying opportunity. Conversely, when the MACD line crosses below the signal line, it generates a bearish signal, suggesting a potential selling opportunity.
To use the MACD-Parabolic SAR-EMA200 Indicator for trading, you can follow these guidelines:
Buy conditions:
1. The price should be above the EMA 200.
2. The Parabolic SAR should indicate an upward trend (dots below the price).
3. The MACD delta (the difference between the MACD line and the signal line) should be positive.
Sell conditions:
1. The price should be below the EMA 200.
2. The Parabolic SAR should indicate a downward trend (dots above the price).
3. The MACD delta should be negative.
By combining these three indicators, traders can gain additional confirmation of the overall trend direction and make more informed trading decisions. However, it's important to note that no indicator guarantees successful trades, and it's always advisable to use additional analysis and risk management techniques in conjunction with technical indicators.
Mã nguồn mở
Theo đúng tinh thần TradingView, tác giả của tập lệnh này đã công bố nó dưới dạng mã nguồn mở, để các nhà giao dịch có thể xem xét và xác minh chức năng. Chúc mừng tác giả! Mặc dù bạn có thể sử dụng miễn phí, hãy nhớ rằng việc công bố lại mã phải tuân theo Nội quy.
Thông báo miễn trừ trách nhiệm
Thông tin và các ấn phẩm này không nhằm mục đích, và không cấu thành, lời khuyên hoặc khuyến nghị về tài chính, đầu tư, giao dịch hay các loại khác do TradingView cung cấp hoặc xác nhận. Đọc thêm tại Điều khoản Sử dụng.