PROTECTED SOURCE SCRIPT
Cập nhật chuba indicator MM21 dispersion ccl
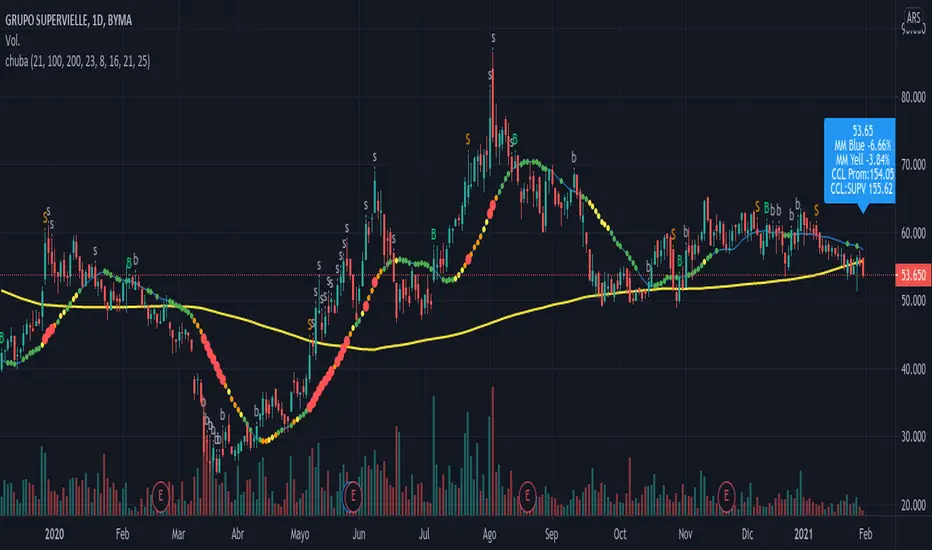
It draws a Simple Media Mobile of 21 days (MM21days) in blue and draws a MM200days in yellow , despite the time frame is Days, Hours or Seconds.
Indicator based in Prof ALEXIS TSCHUBAROV 's strategy . It calculates the max dispersion in percent between the MM21days and the ticker price inside the time frame.
Over the last candle write a coloured globe depending on the dispersion with the latest stock price:
blue : dispersion < 8%
green : dispersion < 16%
orange: dispersion < 23%
yellow : dispersion < 25%
red : dispersion >= 25%
The globe show inside:
last stock price
Azul NN.NN% : dispersion between MM21days and the last stock price
Ama NN.NN% : dispersion between MM200days and the last stock price
CCL average ( contado con liqui dolar price in ARS )
tiker's CCL ( contado con liqui dolar price in ARS )
Colored dots over MM21days depends the value between MM21days and the max dispersion of the candle :
none dot : dispersion < 8%
green dot: dispersion < 16%
orange dot: dispersion < 23%
yellow dot: dispersion < 25%
red dot: dispersion >= 25%
Show over the candle when Buy or Sell
The criteria when buy or sell are:
When the closed stock price crosses the MM21days
When the dispersion with the MM21days exceed the 25%
Alarms:
Alarm when sell , when buy
Alarm dispersion reaches 23%
Note:
ask for more CCL tickers price.
Alexandermonday ( a brusa )
Phát hành các Ghi chú
Se agregaron ADRsMã được bảo vệ
Tập lệnh này được đăng dưới dạng mã nguồn đóng. Tuy nhiên, bạn có thể sử dụng tự do và không giới hạn – tìm hiểu thêm tại đây.
Thông báo miễn trừ trách nhiệm
Thông tin và các ấn phẩm này không nhằm mục đích, và không cấu thành, lời khuyên hoặc khuyến nghị về tài chính, đầu tư, giao dịch hay các loại khác do TradingView cung cấp hoặc xác nhận. Đọc thêm tại Điều khoản Sử dụng.
Mã được bảo vệ
Tập lệnh này được đăng dưới dạng mã nguồn đóng. Tuy nhiên, bạn có thể sử dụng tự do và không giới hạn – tìm hiểu thêm tại đây.
Thông báo miễn trừ trách nhiệm
Thông tin và các ấn phẩm này không nhằm mục đích, và không cấu thành, lời khuyên hoặc khuyến nghị về tài chính, đầu tư, giao dịch hay các loại khác do TradingView cung cấp hoặc xác nhận. Đọc thêm tại Điều khoản Sử dụng.