OPEN-SOURCE SCRIPT
Normalized Volume Z-Score
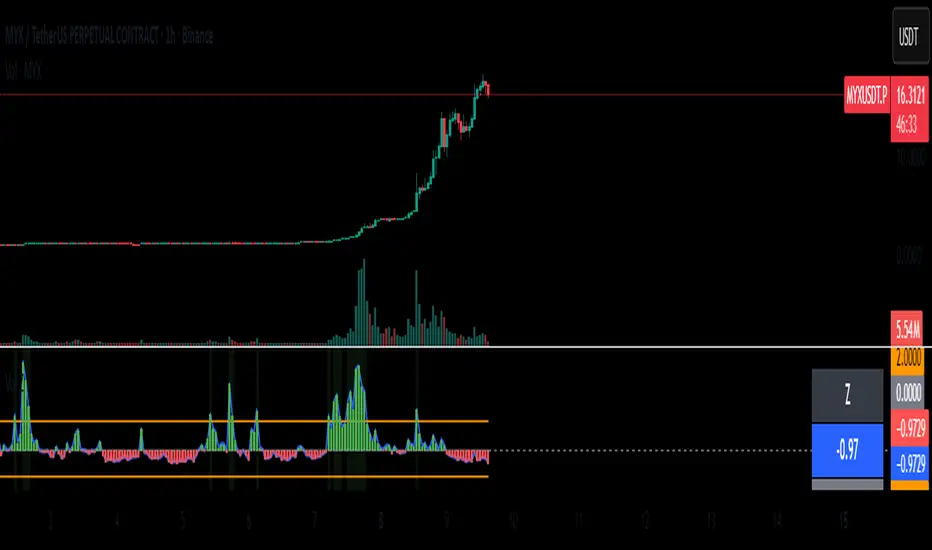
The Normalized Volume Z-Score indicator measures how unusual the current trading volume is compared to its recent history.
It calculates the z-score of volume over a user-defined lookback period (default: 50 bars), optionally using log-volume normalization.
A z-score tells you how many standard deviations today’s volume is away from its mean:
Z = 0 → volume is at its average.
Z > 0 → volume is higher than average.
Z < 0 → volume is lower than average.
Threshold lines (±2 by default) highlight extreme deviations, which often signal unusual market activity.
How to Trade with It
High positive Z-score (> +2):
Indicates abnormally high volume. This often happens during breakouts, strong trend continuations, or capitulation events.
→ Traders may look for confirmation from price action (e.g., breakout candle, strong trend bar) before entering a trade.
High negative Z-score (< –2):
Indicates unusually low volume. This may signal lack of interest, consolidation, or exhaustion.
→ Traders may avoid entering new positions during these periods or expect potential reversals once volume returns.
Cross back inside thresholds:
When z-score returns inside ±2 after an extreme spike, it may suggest that the abnormal activity has cooled down.
Tips
Works best when combined with price structure (support/resistance, demand/supply zones).
Can be applied to crypto, stocks, forex, futures – anywhere volume is meaningful.
Log normalization helps reduce distortion when some days have extremely large volumes.
Mã nguồn mở
Theo đúng tinh thần TradingView, tác giả của tập lệnh này đã công bố nó dưới dạng mã nguồn mở, để các nhà giao dịch có thể xem xét và xác minh chức năng. Chúc mừng tác giả! Mặc dù bạn có thể sử dụng miễn phí, hãy nhớ rằng việc công bố lại mã phải tuân theo Nội quy.
Thông báo miễn trừ trách nhiệm
Thông tin và các ấn phẩm này không nhằm mục đích, và không cấu thành, lời khuyên hoặc khuyến nghị về tài chính, đầu tư, giao dịch hay các loại khác do TradingView cung cấp hoặc xác nhận. Đọc thêm tại Điều khoản Sử dụng.