OPEN-SOURCE SCRIPT
Cập nhật Horizontal Volume
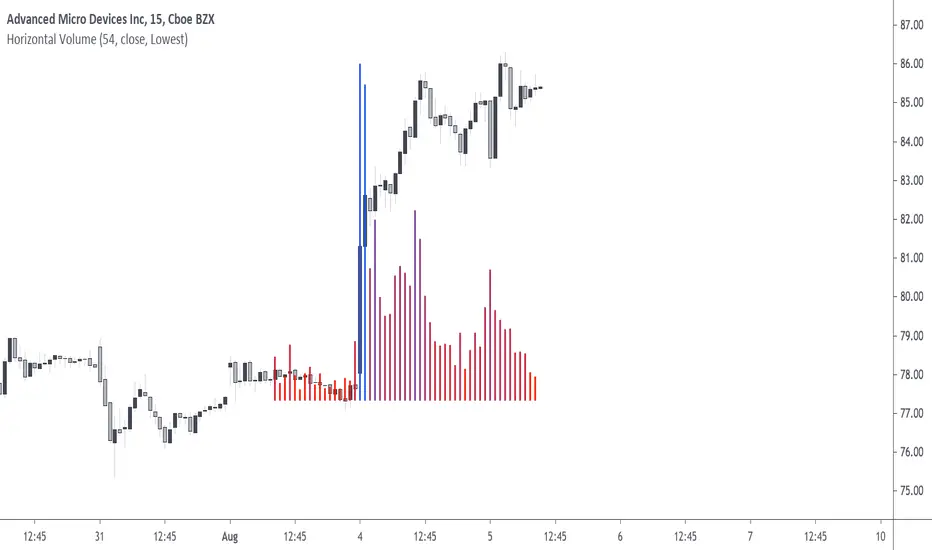
Plot the last length volume observations horizontally on the price graph by using rescaling, with a position relative to the price highest, lowest, or moving average. Note that the indicator is subject to repainting.
Settings
Details
The relative position setting determines how the histogram bars are plotted, by default "Lowest", this set the base of the plot at the lowest src value over length periods.

If "Highest" is selected, the base become the highest src value over length periods.

Finally "Moving Average" set the base value equal to the price moving average with period length, however this mod work differently, as it allows the bars to have a "negative" value.

Negative bars indicates that the volume at that precise point is lower than the mean of the last length volume observations.
The gradient tells you how close the volume is to the maximum value of the last length volume observations, with bluer colors indicating a volume closer to its maximum value.
Usage
The indicator gives you information on the volume, but you can use it more creatively since it can be really close to the price. For example, you can make support and resistances from the indicator:

Here we make a resistance from the highest bars displayed by the indicator. If you have other ideas feel free to share.
Summary
Rescaling is nice, and line.new allows you to plot pretty much everything you want, in the order you want, this is how this script was achieved.
Neko emojis are cutes, if you see one, try including it to your scripts, don't overdo it tho, as they can be quite intrusive. They won't mess up with your code as long as you give them a //
Settings
- Length: Determine the number of histogram bars to be plotted
- Src: Determine the scale of the indicator
- Relative Position: Determine how the bars are plotted
- Unicolor: If TRUE, the histogram bars will have the same color, else the color is a gradient.
Details
The relative position setting determines how the histogram bars are plotted, by default "Lowest", this set the base of the plot at the lowest src value over length periods.
If "Highest" is selected, the base become the highest src value over length periods.
Finally "Moving Average" set the base value equal to the price moving average with period length, however this mod work differently, as it allows the bars to have a "negative" value.
Negative bars indicates that the volume at that precise point is lower than the mean of the last length volume observations.
The gradient tells you how close the volume is to the maximum value of the last length volume observations, with bluer colors indicating a volume closer to its maximum value.
Usage
The indicator gives you information on the volume, but you can use it more creatively since it can be really close to the price. For example, you can make support and resistances from the indicator:
Here we make a resistance from the highest bars displayed by the indicator. If you have other ideas feel free to share.
Summary
Rescaling is nice, and line.new allows you to plot pretty much everything you want, in the order you want, this is how this script was achieved.
Neko emojis are cutes, if you see one, try including it to your scripts, don't overdo it tho, as they can be quite intrusive. They won't mess up with your code as long as you give them a //
Phát hành các Ghi chú
fixed indicator behavior when volume is naMã nguồn mở
Theo đúng tinh thần TradingView, tác giả của tập lệnh này đã công bố nó dưới dạng mã nguồn mở, để các nhà giao dịch có thể xem xét và xác minh chức năng. Chúc mừng tác giả! Mặc dù bạn có thể sử dụng miễn phí, hãy nhớ rằng việc công bố lại mã phải tuân theo Nội quy.
Check out the indicators we are making at luxalgo: tradingview.com/u/LuxAlgo/
"My heart is so loud that I can't hear the fireworks"
"My heart is so loud that I can't hear the fireworks"
Thông báo miễn trừ trách nhiệm
Thông tin và các ấn phẩm này không nhằm mục đích, và không cấu thành, lời khuyên hoặc khuyến nghị về tài chính, đầu tư, giao dịch hay các loại khác do TradingView cung cấp hoặc xác nhận. Đọc thêm tại Điều khoản Sử dụng.
Mã nguồn mở
Theo đúng tinh thần TradingView, tác giả của tập lệnh này đã công bố nó dưới dạng mã nguồn mở, để các nhà giao dịch có thể xem xét và xác minh chức năng. Chúc mừng tác giả! Mặc dù bạn có thể sử dụng miễn phí, hãy nhớ rằng việc công bố lại mã phải tuân theo Nội quy.
Check out the indicators we are making at luxalgo: tradingview.com/u/LuxAlgo/
"My heart is so loud that I can't hear the fireworks"
"My heart is so loud that I can't hear the fireworks"
Thông báo miễn trừ trách nhiệm
Thông tin và các ấn phẩm này không nhằm mục đích, và không cấu thành, lời khuyên hoặc khuyến nghị về tài chính, đầu tư, giao dịch hay các loại khác do TradingView cung cấp hoặc xác nhận. Đọc thêm tại Điều khoản Sử dụng.