OPEN-SOURCE SCRIPT
Relative Volume Standard Deviation
The Relative Volume Standard Deviation indicator is a powerful tool designed for traders seeking insights into volume dynamics. This indicator assesses the deviation of a security's trading volume from its moving average, shedding light on potential shifts in market sentiment.
Key Features:
-Length: Tailor the indicator's sensitivity by adjusting the length of the moving average.
-Number of Deviations: Customize the analysis by specifying the number of standard deviations to consider.
-Show Negative Values: Toggle the visibility of negative values in the plot for a comprehensive view.
How it Works:
-Moving Average Calculation: The script computes the simple moving average (SMA) of the trading volume over the specified length, providing a baseline for comparison.
-Standard Deviation Analysis: It calculates the standard deviation of the volume, identifying deviations from the average volume.
-Relative Volume Standard Deviation: The indicator then normalizes the difference between the volume and its moving average by the calculated standard deviation, producing a relative measure of volume deviation.
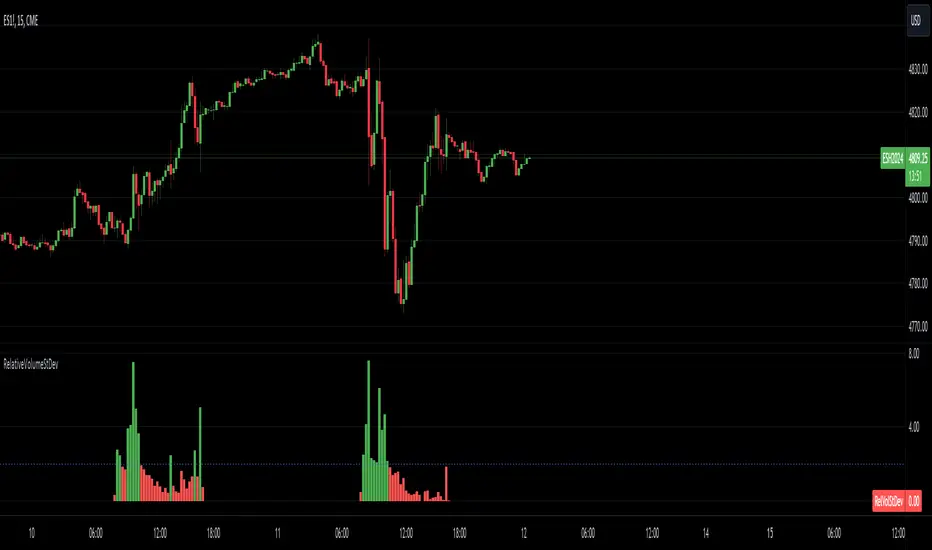
-Visual Representation: The result is visually represented on the chart using columns. Green columns signify relative volume standard deviation values greater than or equal to the specified number of deviations, while red columns represent values below this threshold.
-Enhancements:
Show Deviation Level: Optionally, a dashed horizontal line at the specified deviation level adds an extra layer of analysis, aiding in the identification of significant deviations.
Key Features:
-Length: Tailor the indicator's sensitivity by adjusting the length of the moving average.
-Number of Deviations: Customize the analysis by specifying the number of standard deviations to consider.
-Show Negative Values: Toggle the visibility of negative values in the plot for a comprehensive view.
How it Works:
-Moving Average Calculation: The script computes the simple moving average (SMA) of the trading volume over the specified length, providing a baseline for comparison.
-Standard Deviation Analysis: It calculates the standard deviation of the volume, identifying deviations from the average volume.
-Relative Volume Standard Deviation: The indicator then normalizes the difference between the volume and its moving average by the calculated standard deviation, producing a relative measure of volume deviation.
-Visual Representation: The result is visually represented on the chart using columns. Green columns signify relative volume standard deviation values greater than or equal to the specified number of deviations, while red columns represent values below this threshold.
-Enhancements:
Show Deviation Level: Optionally, a dashed horizontal line at the specified deviation level adds an extra layer of analysis, aiding in the identification of significant deviations.
Mã nguồn mở
Theo đúng tinh thần TradingView, tác giả của tập lệnh này đã công bố nó dưới dạng mã nguồn mở, để các nhà giao dịch có thể xem xét và xác minh chức năng. Chúc mừng tác giả! Mặc dù bạn có thể sử dụng miễn phí, hãy nhớ rằng việc công bố lại mã phải tuân theo Nội quy.
Thông báo miễn trừ trách nhiệm
Thông tin và các ấn phẩm này không nhằm mục đích, và không cấu thành, lời khuyên hoặc khuyến nghị về tài chính, đầu tư, giao dịch hay các loại khác do TradingView cung cấp hoặc xác nhận. Đọc thêm tại Điều khoản Sử dụng.