OPEN-SOURCE SCRIPT
Cập nhật Bollinger Band Volatility Spread Visualizer
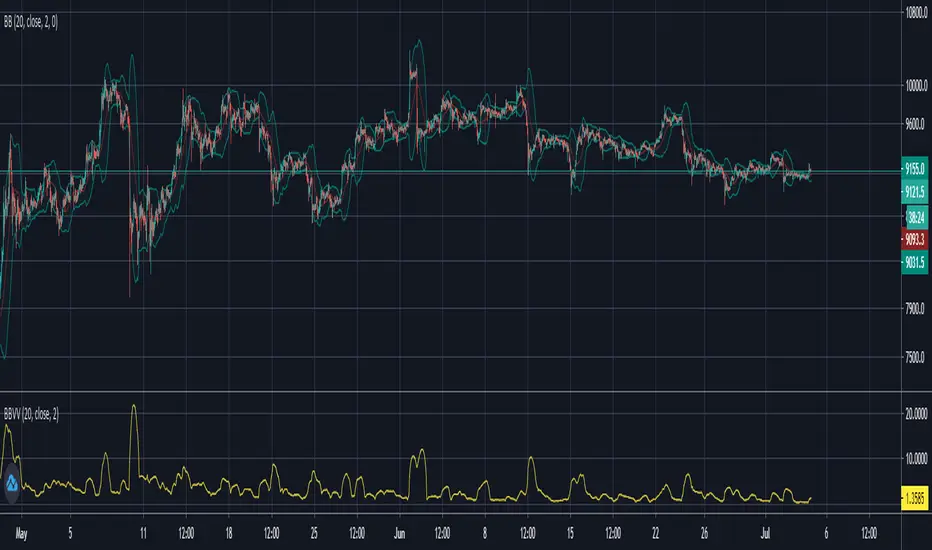
This indicator was created to see the total dollar (or whatever currency pair) amount spread between the upper and lower Bollinger Bands. This knowledge of knowing this spread can be used to indicate upcoming periods of high volatility in a market. The fundamental idea behind predicting periods of high volatility is backed up by the idea that periods of low volatility are followed by periods of high volatility and vice versa.
Based on this knowledge, the numerical spread of the Bollinger Bands, as shown in the indicator, we can deduce that when the value is super low, we can expect a period of high volatility AKA: big move incoming.
This indicator is not fully finished because this was my first time coding in Pinescript and I wanted to post the basic indicator first.
My future plans for improving this indicator include:
- Adding customization as an option to choose your personal BBands settings that this indicator is based off of
- Potentially converting this indicator as a TradingView Strategy where a signal would go off when the spread reaches a certain threshold
Phát hành các Ghi chú
Added code for custom Bollinger Bands input for flexibility for everyone's different uses of Bollinger BandsPhát hành các Ghi chú
Changed the way the data is presented by indexing the spread of the Bollinger Bands relative to the price of the asset. Basically just used the Bollinger Bands Width function that already exists and multiplied by 100 to get more precision. My eventual goal is to figure out a threshold that when reached, creates a general signal of upcoming high volatility. That signal can then be used in conjunction with other indicators (to detect the direction of a trend) to create a buy or sell signal.
Mã nguồn mở
Theo đúng tinh thần TradingView, tác giả của tập lệnh này đã công bố nó dưới dạng mã nguồn mở, để các nhà giao dịch có thể xem xét và xác minh chức năng. Chúc mừng tác giả! Mặc dù bạn có thể sử dụng miễn phí, hãy nhớ rằng việc công bố lại mã phải tuân theo Nội quy.
Thông báo miễn trừ trách nhiệm
Thông tin và các ấn phẩm này không nhằm mục đích, và không cấu thành, lời khuyên hoặc khuyến nghị về tài chính, đầu tư, giao dịch hay các loại khác do TradingView cung cấp hoặc xác nhận. Đọc thêm tại Điều khoản Sử dụng.