PROTECTED SOURCE SCRIPT
Cập nhật Liquidity Strength Heatmap
Overview:
The Liquidity Strength Heatmap provides a real-time visual representation of global liquidity conditions, highlighting potential shifts in asset strength and market liquidity. This indicator integrates macroeconomic and forex data to assess the liquidity impact from major regions, creating a heatmap that visually conveys the liquidity landscape over time. By monitoring these liquidity changes, users can potentially identify asset trends, market turning points, and optimal timing for asset allocation adjustments.
Functionality:
Global Liquidity Calculation: The indicator aggregates liquidity metrics from key components:
Federal Reserve Liquidity: Tracks central bank balance sheets and operations affecting USD liquidity.
Global M2 Money Supply: Compiles M2 metrics from major global economies (China, U.S., Europe, Japan, UK) and adjusts for currency rates.
Asian Liquidity: Monitors Asian liquidity flows using bond yields, the U.S. dollar index (DXY), and high-yield bond spreads, representing financial stability in Asia.
National Balance Sheets in USD: Converts major balance sheets (China, Japan, Europe) into USD to assess liquidity in comparable terms.
Liquidity Rate of Change (ROC):
The indicator calculates the rate of change across different liquidity sources to measure liquidity trends. It averages ROC over multiple global sources to obtain a composite liquidity ROC, which is then compared to the asset ROC over a user-defined period.
Lagged Period Analysis:
The heatmap introduces lagged comparisons (1-16 periods back) between the asset ROC and the composite liquidity ROC, visualizing how liquidity changes over different time frames affect asset performance. Lagged EMAs of the differential between asset and liquidity ROC offer a rolling insight into liquidity-driven market trends, which can reveal underlying trends even amid short-term fluctuations.
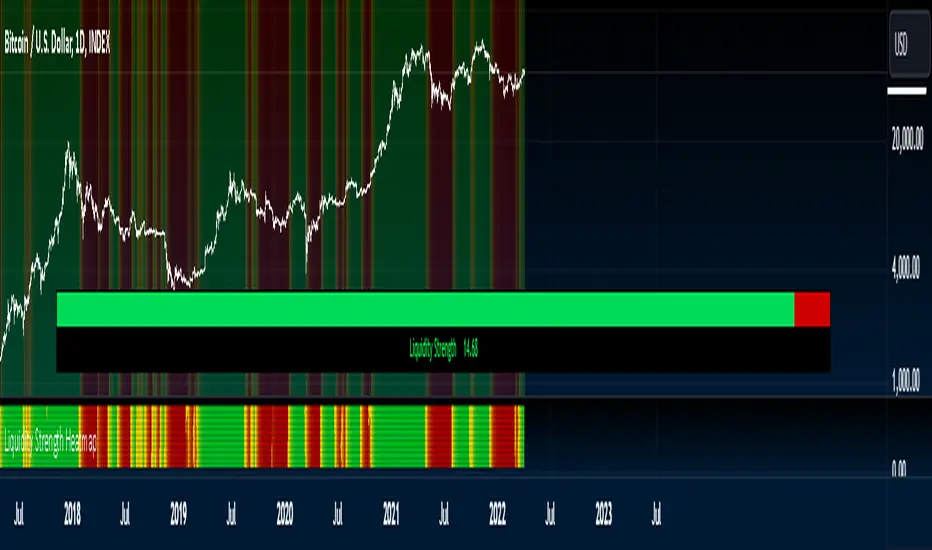
Heatmap Display:
The heatmap applies color gradients to show shifts in liquidity strength: green shades represent liquidity expansion (positive ROC) and red shades indicate contraction (negative ROC).
Users can adjust smoothing parameters to emphasize or dampen liquidity momentum, which enables adaptation for both high-volatility environments and steady trends.
Bar coloring is available to enhance visual clarity by highlighting asset performance in response to liquidity strength.
Table Display (Optional):
An optional table component provides a numerical representation of liquidity conditions, with cells turning green or red depending on liquidity expansion or contraction. This visual detail allows users to track longer-term liquidity cycles beyond the heatmap.
Application:
The Liquidity Strength Heatmap is ideal for traders and analysts focusing on macro-driven asset trends. By monitoring global liquidity shifts, users can enhance their decision-making process, optimizing entry and exit points based on broader economic conditions.
The Liquidity Strength Heatmap provides a real-time visual representation of global liquidity conditions, highlighting potential shifts in asset strength and market liquidity. This indicator integrates macroeconomic and forex data to assess the liquidity impact from major regions, creating a heatmap that visually conveys the liquidity landscape over time. By monitoring these liquidity changes, users can potentially identify asset trends, market turning points, and optimal timing for asset allocation adjustments.
Functionality:
Global Liquidity Calculation: The indicator aggregates liquidity metrics from key components:
Federal Reserve Liquidity: Tracks central bank balance sheets and operations affecting USD liquidity.
Global M2 Money Supply: Compiles M2 metrics from major global economies (China, U.S., Europe, Japan, UK) and adjusts for currency rates.
Asian Liquidity: Monitors Asian liquidity flows using bond yields, the U.S. dollar index (DXY), and high-yield bond spreads, representing financial stability in Asia.
National Balance Sheets in USD: Converts major balance sheets (China, Japan, Europe) into USD to assess liquidity in comparable terms.
Liquidity Rate of Change (ROC):
The indicator calculates the rate of change across different liquidity sources to measure liquidity trends. It averages ROC over multiple global sources to obtain a composite liquidity ROC, which is then compared to the asset ROC over a user-defined period.
Lagged Period Analysis:
The heatmap introduces lagged comparisons (1-16 periods back) between the asset ROC and the composite liquidity ROC, visualizing how liquidity changes over different time frames affect asset performance. Lagged EMAs of the differential between asset and liquidity ROC offer a rolling insight into liquidity-driven market trends, which can reveal underlying trends even amid short-term fluctuations.
Heatmap Display:
The heatmap applies color gradients to show shifts in liquidity strength: green shades represent liquidity expansion (positive ROC) and red shades indicate contraction (negative ROC).
Users can adjust smoothing parameters to emphasize or dampen liquidity momentum, which enables adaptation for both high-volatility environments and steady trends.
Bar coloring is available to enhance visual clarity by highlighting asset performance in response to liquidity strength.
Table Display (Optional):
An optional table component provides a numerical representation of liquidity conditions, with cells turning green or red depending on liquidity expansion or contraction. This visual detail allows users to track longer-term liquidity cycles beyond the heatmap.
Application:
The Liquidity Strength Heatmap is ideal for traders and analysts focusing on macro-driven asset trends. By monitoring global liquidity shifts, users can enhance their decision-making process, optimizing entry and exit points based on broader economic conditions.
Phát hành các Ghi chú
V2 Mã được bảo vệ
Tập lệnh này được đăng dưới dạng mã nguồn đóng. Tuy nhiên, bạn có thể tự do sử dụng tập lệnh mà không có bất kỳ hạn chế nào – tìm hiểu thêm tại đây.
🔍 Access Investing Strategies & Indicators
📊 whop.com/marktquant
🌐 marktquant.com
Nothing shared on this page constitutes financial advice. All information, tools, and analyses are provided solely for informational and educational purposes.
📊 whop.com/marktquant
🌐 marktquant.com
Nothing shared on this page constitutes financial advice. All information, tools, and analyses are provided solely for informational and educational purposes.
Thông báo miễn trừ trách nhiệm
Thông tin và ấn phẩm không có nghĩa là và không cấu thành, tài chính, đầu tư, kinh doanh, hoặc các loại lời khuyên hoặc khuyến nghị khác được cung cấp hoặc xác nhận bởi TradingView. Đọc thêm trong Điều khoản sử dụng.
Mã được bảo vệ
Tập lệnh này được đăng dưới dạng mã nguồn đóng. Tuy nhiên, bạn có thể tự do sử dụng tập lệnh mà không có bất kỳ hạn chế nào – tìm hiểu thêm tại đây.
🔍 Access Investing Strategies & Indicators
📊 whop.com/marktquant
🌐 marktquant.com
Nothing shared on this page constitutes financial advice. All information, tools, and analyses are provided solely for informational and educational purposes.
📊 whop.com/marktquant
🌐 marktquant.com
Nothing shared on this page constitutes financial advice. All information, tools, and analyses are provided solely for informational and educational purposes.
Thông báo miễn trừ trách nhiệm
Thông tin và ấn phẩm không có nghĩa là và không cấu thành, tài chính, đầu tư, kinh doanh, hoặc các loại lời khuyên hoặc khuyến nghị khác được cung cấp hoặc xác nhận bởi TradingView. Đọc thêm trong Điều khoản sử dụng.