OPEN-SOURCE SCRIPT
Auto-Adjusting Kalman Filter by Tenozen
New year, new indicator! Auto-Adjusting Kalman Filter is an indicator designed to provide an adaptive approach to trend analysis. Using the Kalman Filter (a recursive algorithm used in signal processing), this algo dynamically adjusts to market conditions, offering traders a reliable way to identify trends and manage risk! In other words, it's a remaster of my previous indicator, Kalman Filter by Tenozen.
What's the difference with the previous indicator (Kalman Filter by Tenozen)?
*The indicator adjusts its parameters (Q and R) in real-time using the Average True Range (ATR) as a measure of market volatility. This ensures the filter remains responsive during high-volatility periods and smooth during low-volatility conditions, optimizing its performance across different market environments.
*The filter resets on a user-defined timeframe, aligning its calculations with dominant trends and reducing sensitivity to short-term noise. This helps maintain consistency with the broader market structure.
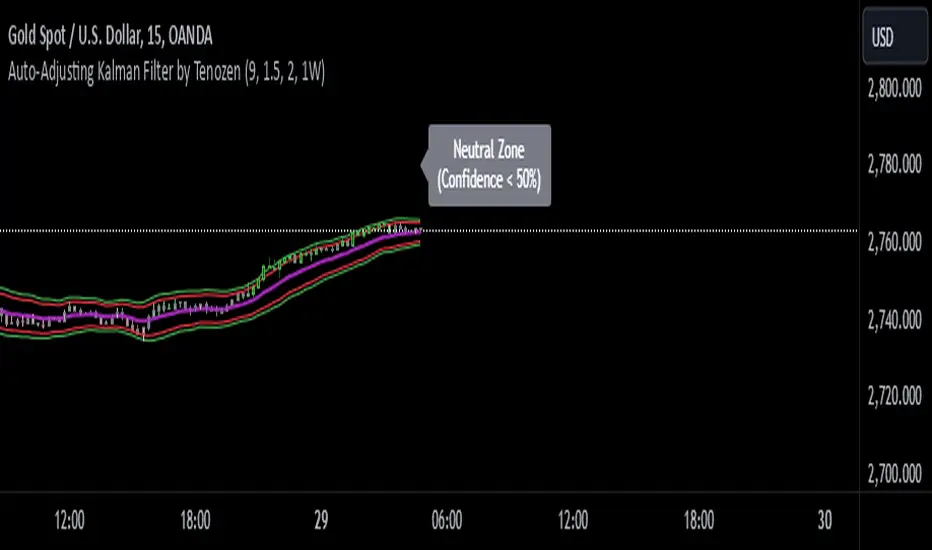
*A confidence metric, derived from the deviation of price from the Kalman filter line (measured in ATR multiples), is visualized as a heatmap:
*Green: Bullish confidence (higher values indicate stronger trends).
*Red: Bearish confidence (higher values indicate stronger trends).
*Gray: Neutral zone (low confidence, suggesting caution).
*This provides a clear, objective measure of trend strength.
How it works?
The Kalman Filter estimates the "true" price by filtering out market noise. It operates in two steps, that is, prediction and update. Prediction is about projection the current state (price) forward. Update is about adjusting the prediction based on the latest price data. The filter's parameters (Q and R) are scaled using normalized ATR, ensuring adaptibility to changing market conditions. So it means that, Q (Process Noise) increases during high volatility, making the filter more responsive to price changes and R (Measurement Noise) increases during low volatility, smoothing out the filter to avoid overreacting to minor fluctuations. Also, the trend confidence is calculated based on the deviation of price from the Kalman filter line, measured in ATR multiples, this provides a quantifiable measure of trend strength, helping traders assess market conditions objectively.
How to use?
*Use the Kalman Filter line to identify the prevailing trend direction. Trade in alignment with the filter's slope for higher-probability setups.
*Look for pullbacks toward the Kalman Filter line during strong trends (high confidence zones)
*Utilize the dynamic stop-loss and take-profit levels to manage risk and lock in profits
*Confidence Heatmap provides an objective measure of market sentiment, helping traders avoid low-confidence (neutral) zones and focus on high-probability opportunities
Guess that's it! I hope this indicator helps! Let me know if you guys got some feedback! Ciao!
What's the difference with the previous indicator (Kalman Filter by Tenozen)?
*The indicator adjusts its parameters (Q and R) in real-time using the Average True Range (ATR) as a measure of market volatility. This ensures the filter remains responsive during high-volatility periods and smooth during low-volatility conditions, optimizing its performance across different market environments.
*The filter resets on a user-defined timeframe, aligning its calculations with dominant trends and reducing sensitivity to short-term noise. This helps maintain consistency with the broader market structure.
*A confidence metric, derived from the deviation of price from the Kalman filter line (measured in ATR multiples), is visualized as a heatmap:
*Green: Bullish confidence (higher values indicate stronger trends).
*Red: Bearish confidence (higher values indicate stronger trends).
*Gray: Neutral zone (low confidence, suggesting caution).
*This provides a clear, objective measure of trend strength.
How it works?
The Kalman Filter estimates the "true" price by filtering out market noise. It operates in two steps, that is, prediction and update. Prediction is about projection the current state (price) forward. Update is about adjusting the prediction based on the latest price data. The filter's parameters (Q and R) are scaled using normalized ATR, ensuring adaptibility to changing market conditions. So it means that, Q (Process Noise) increases during high volatility, making the filter more responsive to price changes and R (Measurement Noise) increases during low volatility, smoothing out the filter to avoid overreacting to minor fluctuations. Also, the trend confidence is calculated based on the deviation of price from the Kalman filter line, measured in ATR multiples, this provides a quantifiable measure of trend strength, helping traders assess market conditions objectively.
How to use?
*Use the Kalman Filter line to identify the prevailing trend direction. Trade in alignment with the filter's slope for higher-probability setups.
*Look for pullbacks toward the Kalman Filter line during strong trends (high confidence zones)
*Utilize the dynamic stop-loss and take-profit levels to manage risk and lock in profits
*Confidence Heatmap provides an objective measure of market sentiment, helping traders avoid low-confidence (neutral) zones and focus on high-probability opportunities
Guess that's it! I hope this indicator helps! Let me know if you guys got some feedback! Ciao!
Mã nguồn mở
Theo đúng tinh thần TradingView, tác giả của tập lệnh này đã công bố nó dưới dạng mã nguồn mở, để các nhà giao dịch có thể xem xét và xác minh chức năng. Chúc mừng tác giả! Mặc dù bạn có thể sử dụng miễn phí, hãy nhớ rằng việc công bố lại mã phải tuân theo Nội quy.
Thông báo miễn trừ trách nhiệm
Thông tin và các ấn phẩm này không nhằm mục đích, và không cấu thành, lời khuyên hoặc khuyến nghị về tài chính, đầu tư, giao dịch hay các loại khác do TradingView cung cấp hoặc xác nhận. Đọc thêm tại Điều khoản Sử dụng.