OPEN-SOURCE SCRIPT
Cập nhật ATR and Volume Analysis
Hi!
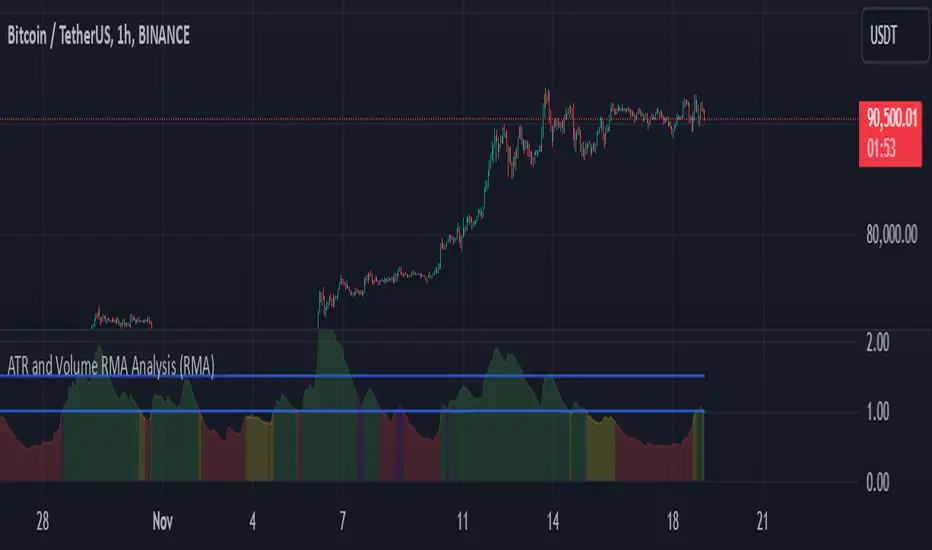
I would like to present an indicator that's meant to measure ratio of Volatility to Volume.
Basically it measures 2 moving averages (14 and 100 period) of ATR and Volume and then compares them. The output is ATR14 / Vol14
Color scheme
Red: Volume and ATR is both below 14 period
Green: Both are above
Yellow: Volume up, volatility down
Purple: Volume down, volatility up
Then there are two lines - 1 and 1.5
That is, in my opinion, the most optimal state to trade, because 1 means that there is some volatility and it's confirmed by volume. Above 1,5 you could see it as overbought (or oversold) zone. If it's above this line, we could expect a retracement since the volatility is not backed by volume. Above 2 it's quite critical and I would suggest closing trades.
(You can use it across all timeframes. In fact it's better if you do so. Longer timeframes are good for spotting tradeable markets while shorter timeframes show overbought / oversold zones)
I have also added option to choose between 4 different moving averages, but in my opinion RMA works the best.
Feel free to share some feedback, I would really appreciate it.
Sincerely,
Beefmaster
Phát hành các Ghi chú
Update: Removed other indicators to match the house rules.Mã nguồn mở
Theo đúng tinh thần TradingView, tác giả của tập lệnh này đã công bố nó dưới dạng mã nguồn mở, để các nhà giao dịch có thể xem xét và xác minh chức năng. Chúc mừng tác giả! Mặc dù bạn có thể sử dụng miễn phí, hãy nhớ rằng việc công bố lại mã phải tuân theo Nội quy.
Thông báo miễn trừ trách nhiệm
Thông tin và các ấn phẩm này không nhằm mục đích, và không cấu thành, lời khuyên hoặc khuyến nghị về tài chính, đầu tư, giao dịch hay các loại khác do TradingView cung cấp hoặc xác nhận. Đọc thêm tại Điều khoản Sử dụng.
Mã nguồn mở
Theo đúng tinh thần TradingView, tác giả của tập lệnh này đã công bố nó dưới dạng mã nguồn mở, để các nhà giao dịch có thể xem xét và xác minh chức năng. Chúc mừng tác giả! Mặc dù bạn có thể sử dụng miễn phí, hãy nhớ rằng việc công bố lại mã phải tuân theo Nội quy.
Thông báo miễn trừ trách nhiệm
Thông tin và các ấn phẩm này không nhằm mục đích, và không cấu thành, lời khuyên hoặc khuyến nghị về tài chính, đầu tư, giao dịch hay các loại khác do TradingView cung cấp hoặc xác nhận. Đọc thêm tại Điều khoản Sử dụng.