(17) Trade Risk Management VS-427)
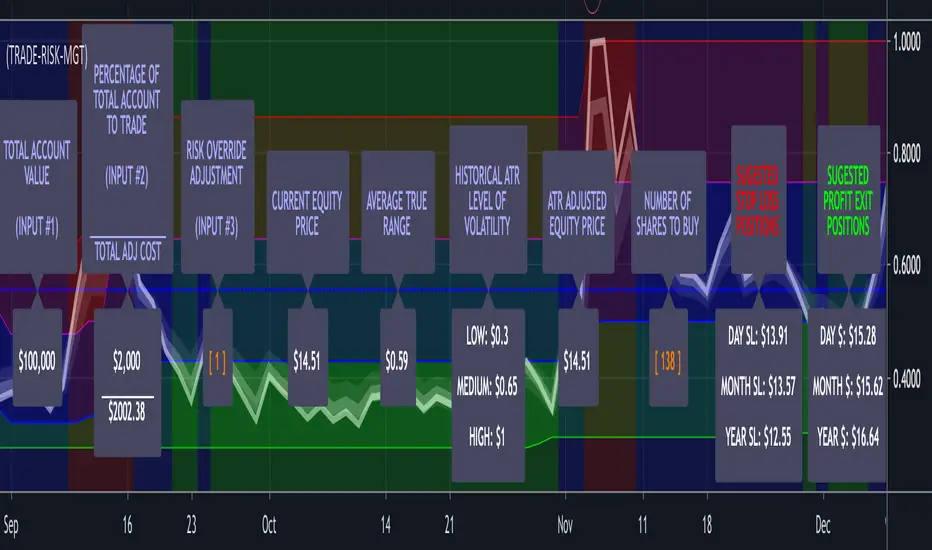
Enter the total value of all of your investments (stocks, cryptos, cash) in input #1 which will then be displayed in Label #1.
You enter the percentage of your account value you are willing to risk on any trade in input #2 which is then displayed in Label #2.
Input #3 allows you to override the built-in risk evaluation based on ATR. Label #3.
Label #4 shows the current equity trading price.
Label #5 shows the current ATR of the equity.
Label #6 shows three levels of historical volatility reflected in the three bands (RED, BLUE, GREEN) shown on the chart.
Label #7 shows the adjusted equity price based on current ATR. If the current ATR is High; Top Red Band, the amount is increased by the (ATR * Risk Factor) Adjustment. Because this increases you're calculated cost basis the number of shares you are indicated to buy is decreased, reducing your exposure to risk in a high volatility/risk environment. If the ATR is Low: Bottom Green Band, the amount is decreased by the (ATR * Risk Factor) Adjustment. Because this decreases your calculated cost basis the number of shares you are indicated to buy is increased because you are in a low volatility/risk environment. If the ATR is neutral: Middle Blue Band, the actual equity cost is utilized and no risk weighting based on ATR is incorporated.
Label #8 shows the resulting change in the price that the risk weighting calculation above had on current price.
Label #9 indicates the recommended number of Risk-Managed-Shares the trader should purchase.
Label #10 indicates the suggested Stop Loss levels and Label #11 shows the suggested Profit Exits Levels.
To further emphasize that the Labels are the Indicator, they get plotted on a line that plots at the center of the current volatility level. If you bring up this indicator and run through one of your trading symbol list, it will enable you to immediately determine exactly what the level of current and historical volatility each of the equities in your list is experiencing.
Additionally, the color of the text on all of the descriptive labels plotted above the center line change color based on the current level of volatility.
Access this Genie indicator for your Tradingview account, through our web site. (Links Below) This will provide you with additional educational information and reference articles, videos, input and setting options and trading strategies this indicator excels in.
Tập lệnh chỉ hiển thị cho người được mời
Chỉ những người dùng được tác giả chấp thuận mới có thể truy cập tập lệnh này. Bạn sẽ cần yêu cầu và được cấp quyền sử dụng. Thông thường quyền này được cấp sau khi thanh toán. Để biết thêm chi tiết, làm theo hướng dẫn của tác giả bên dưới hoặc liên hệ trực tiếp với StockSwinger.
TradingView KHÔNG khuyến nghị bạn trả phí hoặc sử dụng một tập lệnh trừ khi bạn hoàn toàn tin tưởng vào tác giả và hiểu cách hoạt động của tập lệnh. Bạn cũng có thể tìm các lựa chọn miễn phí, mã nguồn mở trong các script cộng đồng của chúng tôi.
Hướng dẫn của tác giả
Thông báo miễn trừ trách nhiệm
Tập lệnh chỉ hiển thị cho người được mời
Chỉ những người dùng được tác giả chấp thuận mới có thể truy cập tập lệnh này. Bạn sẽ cần yêu cầu và được cấp quyền sử dụng. Thông thường quyền này được cấp sau khi thanh toán. Để biết thêm chi tiết, làm theo hướng dẫn của tác giả bên dưới hoặc liên hệ trực tiếp với StockSwinger.
TradingView KHÔNG khuyến nghị bạn trả phí hoặc sử dụng một tập lệnh trừ khi bạn hoàn toàn tin tưởng vào tác giả và hiểu cách hoạt động của tập lệnh. Bạn cũng có thể tìm các lựa chọn miễn phí, mã nguồn mở trong các script cộng đồng của chúng tôi.