OPEN-SOURCE SCRIPT
Up vs Down Volume Compared to Price
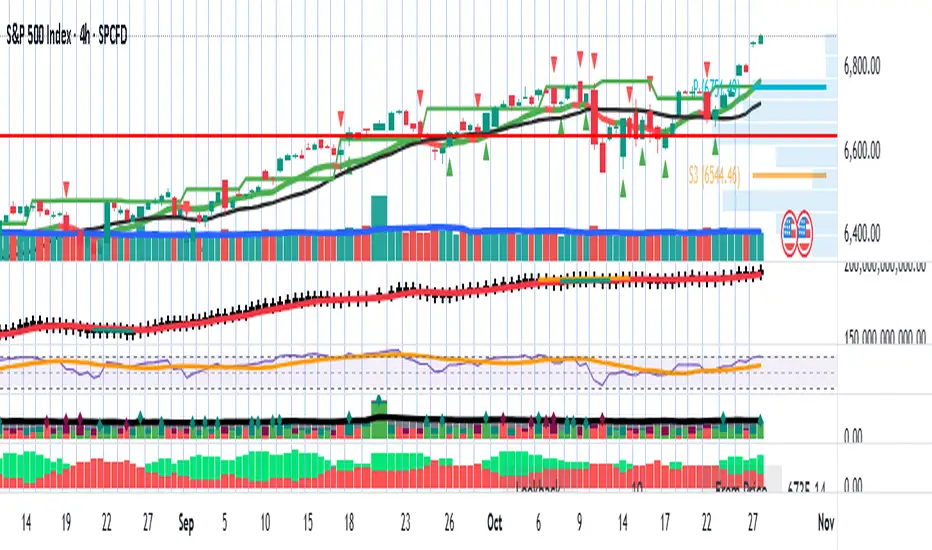
Hi team,
I’ve put together a simple TradingView indicator that breaks down the last N candles into up-moves and down-moves, showing how much volume supported each side. It helps you quickly see whether the market is rallying on strong participation or just drifting higher on weak volume.
The tool tracks total up-volume versus down-volume, compares their ratios, and flags when pullbacks are happening with noticeably lower volume than the prior push up — a setup that often signals a healthy continuation rather than a reversal.
It also shows key metrics like total volume, price change, and up/down ratios directly on the chart for quick assessment. You’ll instantly know if you’re looking at a light-volume pullback or a heavy-volume sell-off.
Let’s test it out across a few symbols and discuss any tweaks we’d like — maybe layering an EMA or VWAP filter for cleaner trend confirmation.
Mã nguồn mở
Theo đúng tinh thần TradingView, tác giả của tập lệnh này đã công bố nó dưới dạng mã nguồn mở, để các nhà giao dịch có thể xem xét và xác minh chức năng. Chúc mừng tác giả! Mặc dù bạn có thể sử dụng miễn phí, hãy nhớ rằng việc công bố lại mã phải tuân theo Nội quy.
Thông báo miễn trừ trách nhiệm
Thông tin và các ấn phẩm này không nhằm mục đích, và không cấu thành, lời khuyên hoặc khuyến nghị về tài chính, đầu tư, giao dịch hay các loại khác do TradingView cung cấp hoặc xác nhận. Đọc thêm tại Điều khoản Sử dụng.