OPEN-SOURCE SCRIPT
Candlestick Reversal Signals
Title: Candlestick Reversal Signals
This Pine Script indicator is designed to identify and plot signals for two key candlestick reversal patterns: Bullish and Bearish Engulfing patterns, as well as Bullish and Bearish Harami patterns. These patterns are widely recognized for their ability to indicate potential trend reversals in the market, providing traders with valuable insights for making informed trading decisions.
Features:
• Bullish Engulfing Pattern:
• Conditions: This pattern is identified when the current candle’s close is higher than the previous candle’s open, and the current candle’s open is lower than the previous candle’s close. Additionally, the current candle’s close must be higher than the previous candle’s close, and the current candle’s open must be lower than the previous candle’s open.
• Signal: When a Bullish Engulfing pattern is detected, a green label is plotted below the relevant bar, indicating a potential upward reversal.
• Bearish Engulfing Pattern:
• Conditions: This pattern is identified when the current candle’s close is lower than the previous candle’s open, and the current candle’s open is higher than the previous candle’s close. Additionally, the current candle’s close must be lower than the previous candle’s close, and the current candle’s open must be higher than the previous candle’s open.
• Signal: When a Bearish Engulfing pattern is detected, a red label is plotted above the relevant bar, indicating a potential downward reversal.
• Bullish Harami Pattern:
• Conditions: This pattern is identified when the previous candle is a bearish candle (open higher than close), and the current candle is a bullish candle (close higher than open) that is contained within the body of the previous bearish candle.
• Signal: When a Bullish Harami pattern is detected, a green label is plotted below the relevant bar, indicating a potential upward reversal.
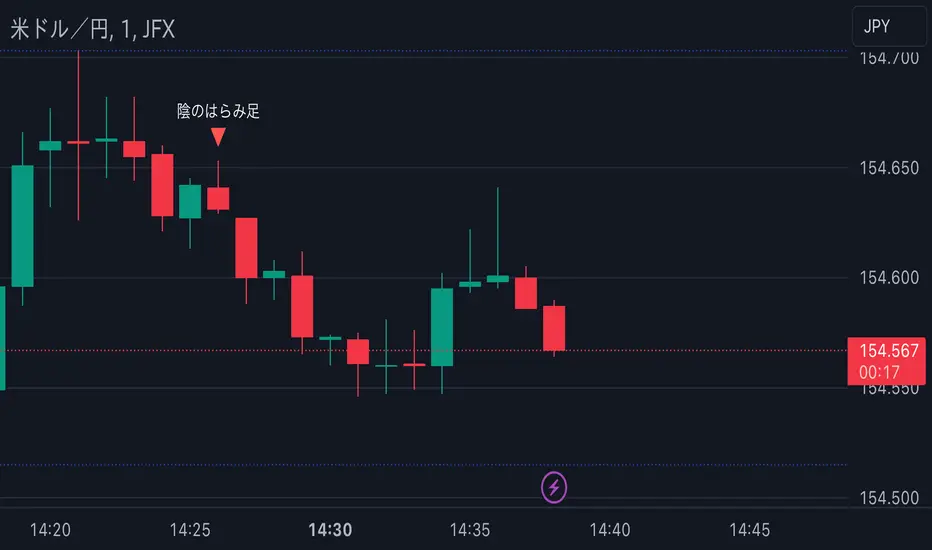
• Bearish Harami Pattern:
• Conditions: This pattern is identified when the previous candle is a bullish candle (open lower than close), and the current candle is a bearish candle (close lower than open) that is contained within the body of the previous bullish candle.
• Signal: When a Bearish Harami pattern is detected, a red label is plotted above the relevant bar, indicating a potential downward reversal.
Usage:
To use this script, simply add it to your TradingView chart. The script will automatically highlight the Bullish and Bearish Engulfing patterns, as well as Bullish and Bearish Harami patterns, by plotting green and red labels on the chart. These visual signals make it easy to spot potential reversal points, helping traders to identify and capitalize on trading opportunities.
Example:
• When you see a green “Bullish Engulfing” label below a candlestick, it suggests that the market might reverse upwards, signaling a potential buy opportunity.
• Conversely, a red “Bearish Engulfing” label above a candlestick suggests a potential downward reversal, signaling a potential sell opportunity.
• A green “Bullish Harami” label below a candlestick also indicates a potential upward reversal.
• A red “Bearish Harami” label above a candlestick indicates a potential downward reversal.
This indicator is a valuable addition to any trader’s technical analysis toolkit, providing clear and actionable signals based on well-established candlestick patterns. By incorporating these reversal patterns into your analysis, you can enhance your trading strategy and improve your decision-making process.
This Pine Script indicator is designed to identify and plot signals for two key candlestick reversal patterns: Bullish and Bearish Engulfing patterns, as well as Bullish and Bearish Harami patterns. These patterns are widely recognized for their ability to indicate potential trend reversals in the market, providing traders with valuable insights for making informed trading decisions.
Features:
• Bullish Engulfing Pattern:
• Conditions: This pattern is identified when the current candle’s close is higher than the previous candle’s open, and the current candle’s open is lower than the previous candle’s close. Additionally, the current candle’s close must be higher than the previous candle’s close, and the current candle’s open must be lower than the previous candle’s open.
• Signal: When a Bullish Engulfing pattern is detected, a green label is plotted below the relevant bar, indicating a potential upward reversal.
• Bearish Engulfing Pattern:
• Conditions: This pattern is identified when the current candle’s close is lower than the previous candle’s open, and the current candle’s open is higher than the previous candle’s close. Additionally, the current candle’s close must be lower than the previous candle’s close, and the current candle’s open must be higher than the previous candle’s open.
• Signal: When a Bearish Engulfing pattern is detected, a red label is plotted above the relevant bar, indicating a potential downward reversal.
• Bullish Harami Pattern:
• Conditions: This pattern is identified when the previous candle is a bearish candle (open higher than close), and the current candle is a bullish candle (close higher than open) that is contained within the body of the previous bearish candle.
• Signal: When a Bullish Harami pattern is detected, a green label is plotted below the relevant bar, indicating a potential upward reversal.
• Bearish Harami Pattern:
• Conditions: This pattern is identified when the previous candle is a bullish candle (open lower than close), and the current candle is a bearish candle (close lower than open) that is contained within the body of the previous bullish candle.
• Signal: When a Bearish Harami pattern is detected, a red label is plotted above the relevant bar, indicating a potential downward reversal.
Usage:
To use this script, simply add it to your TradingView chart. The script will automatically highlight the Bullish and Bearish Engulfing patterns, as well as Bullish and Bearish Harami patterns, by plotting green and red labels on the chart. These visual signals make it easy to spot potential reversal points, helping traders to identify and capitalize on trading opportunities.
Example:
• When you see a green “Bullish Engulfing” label below a candlestick, it suggests that the market might reverse upwards, signaling a potential buy opportunity.
• Conversely, a red “Bearish Engulfing” label above a candlestick suggests a potential downward reversal, signaling a potential sell opportunity.
• A green “Bullish Harami” label below a candlestick also indicates a potential upward reversal.
• A red “Bearish Harami” label above a candlestick indicates a potential downward reversal.
This indicator is a valuable addition to any trader’s technical analysis toolkit, providing clear and actionable signals based on well-established candlestick patterns. By incorporating these reversal patterns into your analysis, you can enhance your trading strategy and improve your decision-making process.
Mã nguồn mở
Theo đúng tinh thần TradingView, tác giả của tập lệnh này đã công bố nó dưới dạng mã nguồn mở, để các nhà giao dịch có thể xem xét và xác minh chức năng. Chúc mừng tác giả! Mặc dù bạn có thể sử dụng miễn phí, hãy nhớ rằng việc công bố lại mã phải tuân theo Nội quy.
Thông báo miễn trừ trách nhiệm
Thông tin và các ấn phẩm này không nhằm mục đích, và không cấu thành, lời khuyên hoặc khuyến nghị về tài chính, đầu tư, giao dịch hay các loại khác do TradingView cung cấp hoặc xác nhận. Đọc thêm tại Điều khoản Sử dụng.