OPEN-SOURCE SCRIPT
Bank Nifty Market Breadth (OsMA)
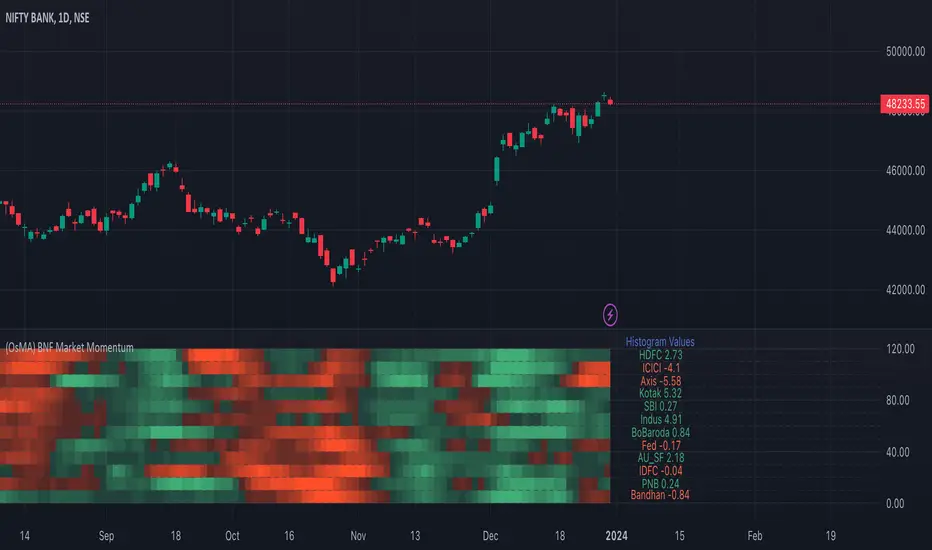
This indicator is the market breadth for Bank Nifty (NSE:BANKNIFTY) index calculated on the histogram values of MACD indicator. Each row in this indicator is a representation of the histogram values of the individual stock that make up Bank Nifty. Components are listed in order of its weightage to Bank nifty index (Highest -> Lowest).
When you see Bank Nifty is on an uptrend on daily timeframe for the past 10 days, you can see what underlying stocks support that uptrend. The brighter the plot colour, the higher the momentum and vice versa. Looking at the individual rows that make up Bank Nifty, you can have an understanding if there is still enough momentum in the underlying stocks to go higher or are there many red plots showing up indicating a possible pullback or trend reversal.
The plot colours are shown as a percentage of the current histogram value taken from MACD from the highest histogram value of the previous 200 bars shown on the current timeframe. Look back value of 200 bars was chosen as it provided a better representation of the current value from its peak over the recent past(previous 200 bars), on all timeframes. Histogram value do grow/fall along with the underlying stock price, so choosing the chart's all-time high/low value as peak was not ideal. Labels on the right show the current histogram value.
Base Code taken from fengyu05's S&P 500 Market Breadth indicator.
Mã nguồn mở
Theo đúng tinh thần TradingView, tác giả của tập lệnh này đã công bố nó dưới dạng mã nguồn mở, để các nhà giao dịch có thể xem xét và xác minh chức năng. Chúc mừng tác giả! Mặc dù bạn có thể sử dụng miễn phí, hãy nhớ rằng việc công bố lại mã phải tuân theo Nội quy.
Thông báo miễn trừ trách nhiệm
Thông tin và các ấn phẩm này không nhằm mục đích, và không cấu thành, lời khuyên hoặc khuyến nghị về tài chính, đầu tư, giao dịch hay các loại khác do TradingView cung cấp hoặc xác nhận. Đọc thêm tại Điều khoản Sử dụng.