OPEN-SOURCE SCRIPT
Previous Day Levels @darshakssc
This indicator provides intraday traders and analysts with immediate visual reference to the previous day's high, low, and close. These historical price levels are frequently watched by market participants for potential reaction, context, and session structure.
How to Add the Indicator:
What You Will See:
These are drawn automatically at each new session and remain visible throughout today’s trading.
Usage:
Use these levels as reference points for context, risk placement, or understanding shifts in session structure.
Watch for price interactions, rejections, or consolidations around these lines—they often act as support/resistance for many trading strategies.
No signals or trade advice are provided by this tool. All decisions are made manually by the trader.
Features:
Persistent, color-coded horizontal lines and clear, small labels.
No alerts, buy/sell arrows, or any indication of trading performance.
Fully automated for each new session—no action required from the user after adding.
Disclaimer:
This indicator is intended for informational and charting purposes only. It is not financial advice or a buy/sell recommendation. Always perform your own due diligence before making trading decisions.
How to Add the Indicator:
- Open any chart on TradingView.
- Click the Indicators button at the top.
- Search for “Previous Day Levels darshakssc” in the Public Library.
- Click the ★ Favorite icon if you wish to save it for quick access in the future.
- Click the indicator’s name to add it to your chart.
- The lines and labels will appear automatically on any intraday timeframe.
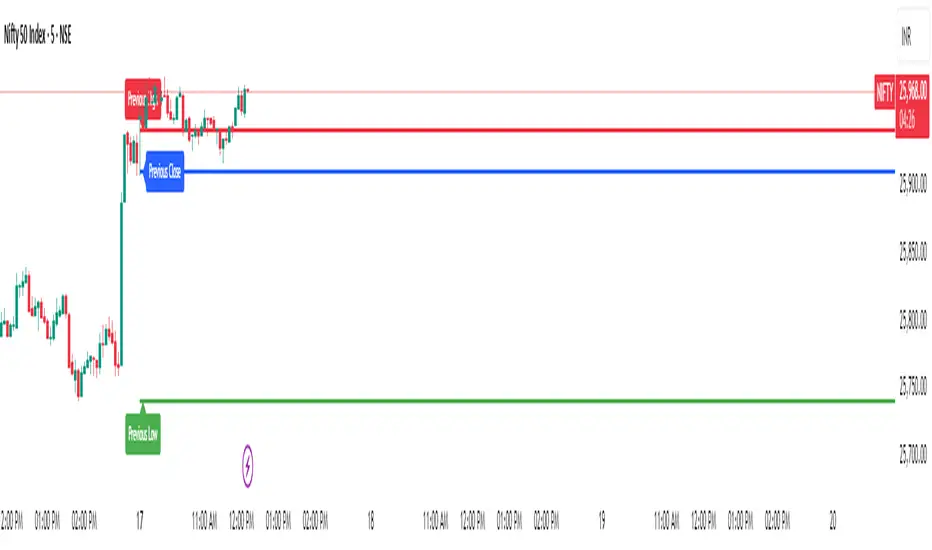
What You Will See:
- Previous day’s High (red line and label: “Previous High”).
- Previous day’s Low (green line and label: “Previous Low”).
- Previous day’s Close (blue line and label: “Previous Close”).
These are drawn automatically at each new session and remain visible throughout today’s trading.
Usage:
Use these levels as reference points for context, risk placement, or understanding shifts in session structure.
Watch for price interactions, rejections, or consolidations around these lines—they often act as support/resistance for many trading strategies.
No signals or trade advice are provided by this tool. All decisions are made manually by the trader.
Features:
Persistent, color-coded horizontal lines and clear, small labels.
No alerts, buy/sell arrows, or any indication of trading performance.
Fully automated for each new session—no action required from the user after adding.
Disclaimer:
This indicator is intended for informational and charting purposes only. It is not financial advice or a buy/sell recommendation. Always perform your own due diligence before making trading decisions.
Mã nguồn mở
Theo đúng tinh thần TradingView, tác giả của tập lệnh này đã công bố nó dưới dạng mã nguồn mở, để các nhà giao dịch có thể xem xét và xác minh chức năng. Chúc mừng tác giả! Mặc dù bạn có thể sử dụng miễn phí, hãy nhớ rằng việc công bố lại mã phải tuân theo Nội quy.
Thông báo miễn trừ trách nhiệm
Thông tin và các ấn phẩm này không nhằm mục đích, và không cấu thành, lời khuyên hoặc khuyến nghị về tài chính, đầu tư, giao dịch hay các loại khác do TradingView cung cấp hoặc xác nhận. Đọc thêm tại Điều khoản Sử dụng.