OPEN-SOURCE SCRIPT
Cập nhật TICK Divergence + Heikin Ashi [Pt]
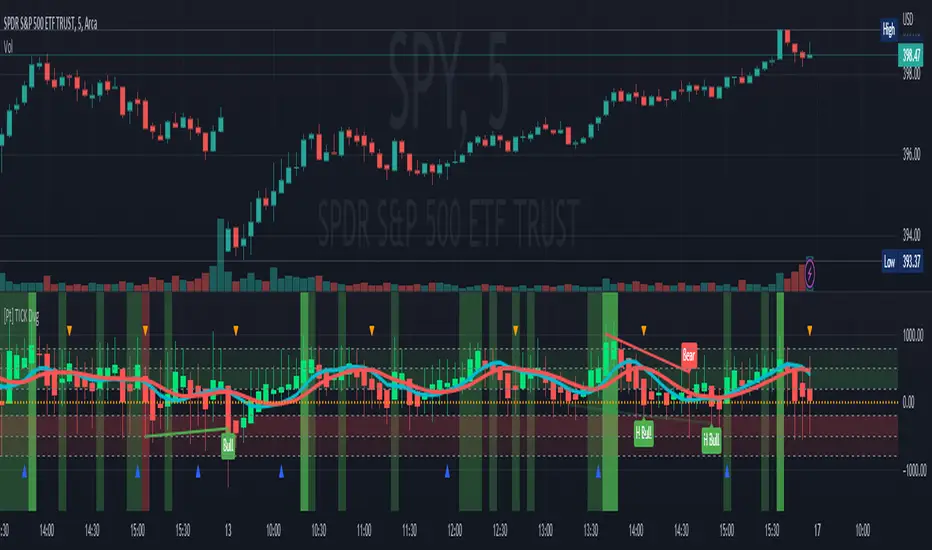
This indicator identifies divergence between NYSE TICK and price, displays TICK in line, bar, or Heikin Ashi format, calculates various types of moving average lines and shows moving average crossovers.
What is TICK
NYSE TICK, also known as the TICK index, is a technical analysis indicator that shows the number of stocks on the New York Stock Exchange (NYSE) that are trading on an uptick or a downtick in a particular period of time. The TICK index is calculated by subtracting the number of stocks trading on a downtick from the number of stocks trading on an uptick. A reading of +1000 on the TICK index, for example, would indicate that there are 1000 more stocks trading on an uptick than on a downtick. The TICK index is often used as a measure of market sentiment, as it can provide insight into whether there is more buying or selling pressure in the market at a given time. A high TICK index reading may suggest that there is strong buying pressure, while a low TICK index reading may indicate that there is more selling pressure in the market.
The TICK index is usually very volatile, so this indicator is best suited for lower timeframes, such as 1 to 5 min charts.
Features
1) Shows bullish, bearish, hidden bullish and hidden bearish divergences
2) Three display modes for TICK data: Line, Bar, Heikin-Ashi

3) Plot various moving average lines and crossovers. Overall background

4) Configurable significant zones. Background colors will change based on closing TICK value.

What is TICK
NYSE TICK, also known as the TICK index, is a technical analysis indicator that shows the number of stocks on the New York Stock Exchange (NYSE) that are trading on an uptick or a downtick in a particular period of time. The TICK index is calculated by subtracting the number of stocks trading on a downtick from the number of stocks trading on an uptick. A reading of +1000 on the TICK index, for example, would indicate that there are 1000 more stocks trading on an uptick than on a downtick. The TICK index is often used as a measure of market sentiment, as it can provide insight into whether there is more buying or selling pressure in the market at a given time. A high TICK index reading may suggest that there is strong buying pressure, while a low TICK index reading may indicate that there is more selling pressure in the market.
The TICK index is usually very volatile, so this indicator is best suited for lower timeframes, such as 1 to 5 min charts.
Features
1) Shows bullish, bearish, hidden bullish and hidden bearish divergences
2) Three display modes for TICK data: Line, Bar, Heikin-Ashi
3) Plot various moving average lines and crossovers. Overall background
4) Configurable significant zones. Background colors will change based on closing TICK value.
Phát hành các Ghi chú
Added option to select TICK symbol (if desired)Removed TICK data and background color from extended hours
Added options in setting page to toggle background colors for in trend zone or in OB/OS zone
Phát hành các Ghi chú
Added alert conditions for:- Dual MA crossovers
- Smoothed MA crossovers
- Divergences
Phát hành các Ghi chú
Updated with option to choose between using TICK High/Low or Close data to calculate divergence, depending on user's preference. See differences shown below:https://www.tradingview.com/x/9juEwd6J/
Mã nguồn mở
Theo đúng tinh thần TradingView, tác giả của tập lệnh này đã công bố nó dưới dạng mã nguồn mở, để các nhà giao dịch có thể xem xét và xác minh chức năng. Chúc mừng tác giả! Mặc dù bạn có thể sử dụng miễn phí, hãy nhớ rằng việc công bố lại mã phải tuân theo Nội quy.
Purchases / Subscriptions / Support - buymeacoffee.com/ptgambler
PayPal - paypal.me/PtGambler
You can reach me privately through my Discord Channel: discord.gg/WMQfaVGyQC
PayPal - paypal.me/PtGambler
You can reach me privately through my Discord Channel: discord.gg/WMQfaVGyQC
Thông báo miễn trừ trách nhiệm
Thông tin và các ấn phẩm này không nhằm mục đích, và không cấu thành, lời khuyên hoặc khuyến nghị về tài chính, đầu tư, giao dịch hay các loại khác do TradingView cung cấp hoặc xác nhận. Đọc thêm tại Điều khoản Sử dụng.