PROTECTED SOURCE SCRIPT
Dynamic Buy/Sell Volume Visualizer [wjdtks255]
Indicator Description:
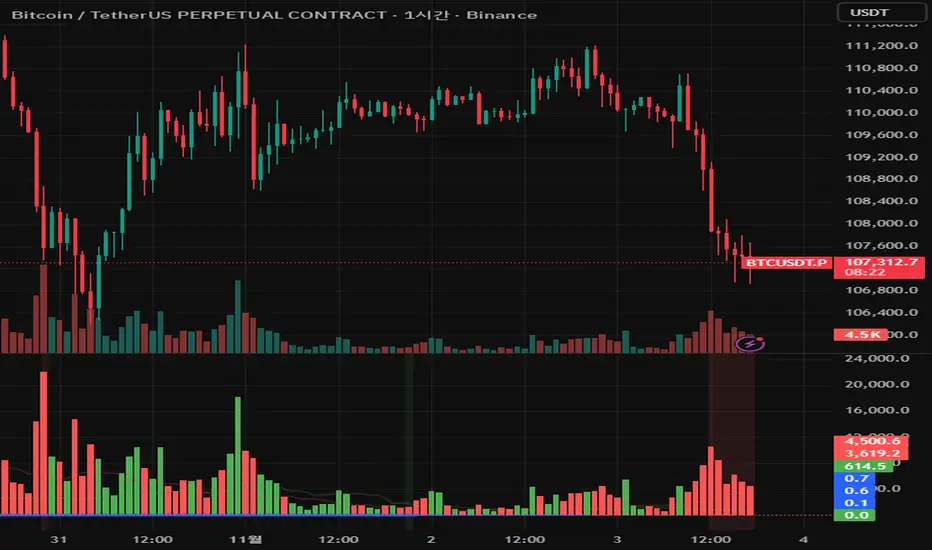
The Dynamic Buy/Sell Volume Visualizer separates bullish and bearish volumes and calculates their moving averages with customizable colors and transparency. It dynamically visualizes buying strength relative to selling pressure by plotting a volume ratio line that changes color intensity and line thickness based on volume dominance. Background colors highlight strong buying or selling phases when volumes exceed thresholds. Volume bars and moving averages provide clear market volume context, and horizontal lines mark key neutral and strength levels.
How It Works:
Bull and bear volumes are distinguished by candle direction.
Moving averages (SMA) smooth volume data with user-defined length and customizable visual styles.
The volume ratio (buy volume MA over total MA) reflects buying strength from 0 (full sell) to 1 (full buy).
The volume ratio line’s color and thickness change dynamically according to the ratio’s magnitude.
Background colors alert users when buy or sell volumes surpass thresholds.
Volume bars and moving averages give detailed volume insights, complemented by horizontal lines showing neutral (0.5), strong buy (0.7), and strong sell (0.3) levels.
Trading Method:
Use the volume ratio line to gauge current market pressure; above 0.7 suggests strong buying, below 0.3 indicates strong selling.
Observe background color shifts as quick visual cues for volume surges or declines.
Combine this volume visualization with price actions to time entries and exits.
Customize moving average parameters to align the indicator with your trading style.
Mã được bảo vệ
Tập lệnh này được đăng dưới dạng mã nguồn đóng. Tuy nhiên, bạn có thể tự do sử dụng tập lệnh mà không có bất kỳ hạn chế nào – tìm hiểu thêm tại đây.
Thông báo miễn trừ trách nhiệm
Thông tin và ấn phẩm không có nghĩa là và không cấu thành, tài chính, đầu tư, kinh doanh, hoặc các loại lời khuyên hoặc khuyến nghị khác được cung cấp hoặc xác nhận bởi TradingView. Đọc thêm trong Điều khoản sử dụng.