OPEN-SOURCE SCRIPT
Cập nhật Fibonacci Forecast Indicator
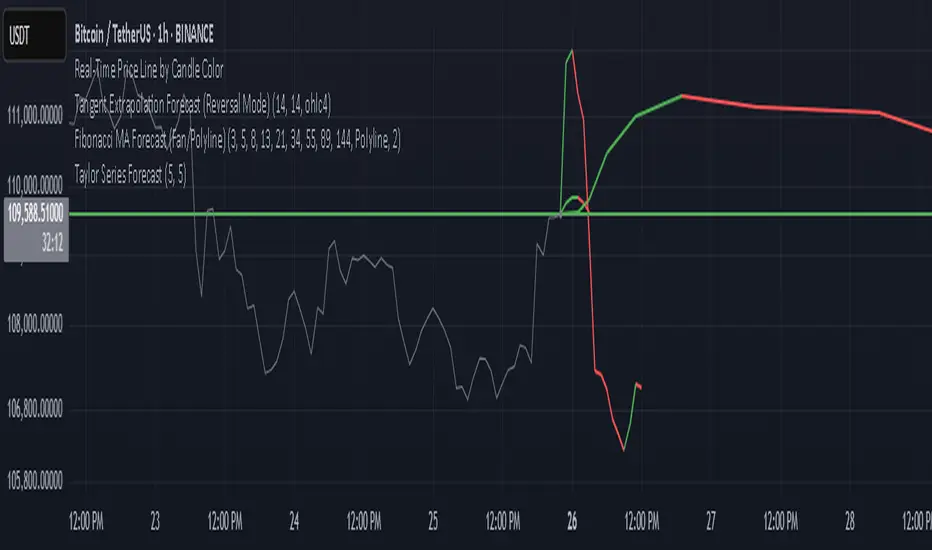
This indicator projects potential price movements into the future based on user-defined Fibonacci-period moving averages. By default, it calculates Simple Moving Averages (SMAs) for the 3, 5, 8, 13, and 21 bars (though you can customize these values). For each SMA, it measures the distance between the current closing price and that SMA, then extends the price forward by the same distance.
Key Features
1. Fibonacci MAs:
- Uses Fibonacci numbers (3, 5, 8, 13, 21) for SMA calculations by default.
- Fully customizable periods to fit different trading styles.
2. Forecast Projection:
- If the current price is above a given SMA, the forecast line extends higher (bullish bias).
- If the current price is below the SMA, the forecast line extends lower (bearish bias).
- Forecast lines are anchored at the current bar and project forward according to the same Fibonacci intervals.
3. Clean Visualization:
- Draws a series of connected line segments from the current bar’s close to each forecast point.
- This approach offers a clear, at-a-glance visual of potential future price paths.
How to Use
1. Add to Chart:
- Simply apply the indicator to any chart and timeframe.
- Adjust the Fibonacci periods and styling under the indicator settings.
2. Interpretation:
- Each forecast line shows where price could potentially head if the current momentum (distance from the SMA) continues.
- When multiple lines are consistently above (or below) the current price, it may reinforce a bullish (or bearish) outlook.
3. Customization:
- You can modify the number of forecast lines, their color, and line width in the inputs.
- Change or add your own Fibonacci periods to experiment with different intervals.
Notes and Best Practices
- Confirmation Tool: This indicator is best used alongside other forms of technical or fundamental analysis. It provides a “what-if” scenario based on current momentum, not a guaranteed prediction.
- Not Financial Advice: Past performance doesn’t guarantee future results. Always practice proper risk management and consider multiple indicators or market factors before making trading decisions.
Give it a try, and see if these Fibonacci-based projections help visualize where price may be headed in your trading strategy!
Phát hành các Ghi chú
additional fib MAsPhát hành các Ghi chú
got rid of redundant functionalityPhát hành các Ghi chú
add angular projectionPhát hành các Ghi chú
difference projectionPhát hành các Ghi chú
now forecasts reversals as wellPhát hành các Ghi chú
linear time intervalsPhát hành các Ghi chú
add ADX reversal conditionsPhát hành các Ghi chú
ADX-ATR weighting, golden ratio interval spacing, pivotsPhát hành các Ghi chú
better functionalityMã nguồn mở
Theo đúng tinh thần TradingView, tác giả của tập lệnh này đã công bố nó dưới dạng mã nguồn mở, để các nhà giao dịch có thể xem xét và xác minh chức năng. Chúc mừng tác giả! Mặc dù bạn có thể sử dụng miễn phí, hãy nhớ rằng việc công bố lại mã phải tuân theo Nội quy.
Thông báo miễn trừ trách nhiệm
Thông tin và các ấn phẩm này không nhằm mục đích, và không cấu thành, lời khuyên hoặc khuyến nghị về tài chính, đầu tư, giao dịch hay các loại khác do TradingView cung cấp hoặc xác nhận. Đọc thêm tại Điều khoản Sử dụng.
Mã nguồn mở
Theo đúng tinh thần TradingView, tác giả của tập lệnh này đã công bố nó dưới dạng mã nguồn mở, để các nhà giao dịch có thể xem xét và xác minh chức năng. Chúc mừng tác giả! Mặc dù bạn có thể sử dụng miễn phí, hãy nhớ rằng việc công bố lại mã phải tuân theo Nội quy.
Thông báo miễn trừ trách nhiệm
Thông tin và các ấn phẩm này không nhằm mục đích, và không cấu thành, lời khuyên hoặc khuyến nghị về tài chính, đầu tư, giao dịch hay các loại khác do TradingView cung cấp hoặc xác nhận. Đọc thêm tại Điều khoản Sử dụng.