PROTECTED SOURCE SCRIPT
Cập nhật Pullback Indicator
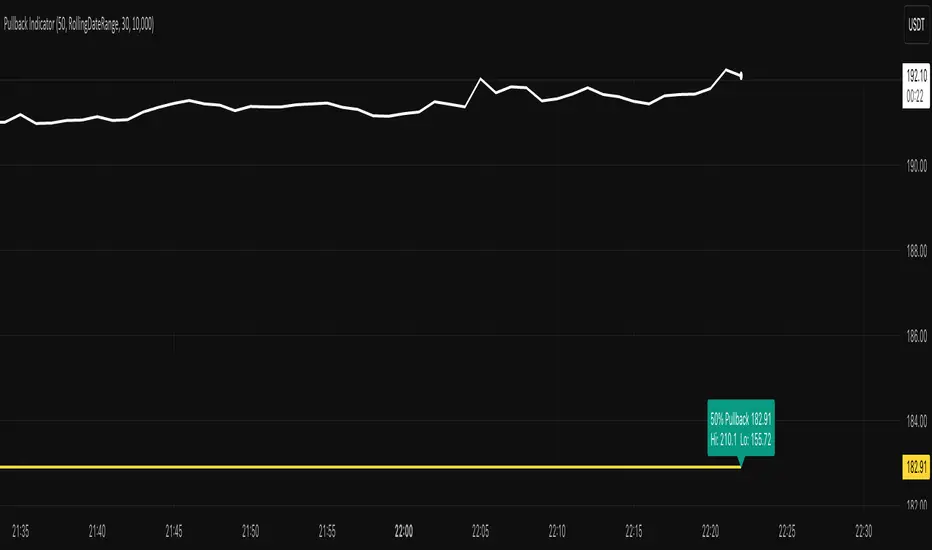
Pullback Indicator
Plots a retracement level between a detected swing High and Low at a user-defined % (e.g., 38.2, 50, 61.8).
Formula: Level = Low + (High − Low) × (Pullback % / 100).
Merging Y-Axis into one
Once you add this indicator to the chart, you will see two Y-axes (or two price scales). Right-click on the price scales on the right, select “Merge all scales into one,” and choose “On the right.”
Modes
• Rolling → High/Low from last N bars on the chart’s timeframe. Recomputed every bar. Good for intraday, fast-adapting ranges.
• RollingDateRange → High/Low from a calendar window (Daily context). Options:
• RollDays = last N calendar days
• or Use Fixed Start Date (window expands day by day)
• Exclude Forming Day = ignore today’s incomplete daily candle for stable intraday levels.
Levels update once per daily bar unless today is included.
Inputs
• Pullback %
• Range Mode (Rolling | RollingDateRange)
• Lookback (bars)
• RollDays / Fixed Start Date
• Exclude Forming Day
• Show Pullback Label
Why range choice matters
Peak & trough are subjective—different windows give different High/Low. Select your window based on trading horizon:
• Intraday → Rolling (bars)
• Swing/position → RollingDateRange (days/fixed date)
How often are High/Low recomputed?
• Rolling (bars):
Recomputed on every bar of the chart’s timeframe using the most recent lookbackBars window. Levels can change frequently.
• RollingDateRange (Daily context):
Computed once per daily bar for the configured calendar window.
• With Exclude Forming Day = ON, the High/Low only update after the prior daily bar closes.
• With it OFF, the current (forming) daily bar can update the High/Low intraday if it sets a new extreme.
⸻
Phát hành các Ghi chú
Pullback IndicatorPlots a retracement level between a detected swing High and Low at a user-defined % (e.g., 38.2, 50, 61.8).
Formula: Level = Low + (High − Low) × (Pullback % / 100).
Merging Y-Axis into one
Once you add this indicator to the chart, you will see two Y-axes (or two price scales). Right-click on the price scales on the right, select “Merge all scales into one,” and choose “On the right.”
Modes
• Rolling → High/Low from last N bars on the chart’s timeframe. Recomputed every bar. Good for intraday, fast-adapting ranges.
• RollingDateRange → High/Low from a calendar window (Daily context). Options:
• RollDays = last N calendar days
• or Use Fixed Start Date (window expands day by day)
• Exclude Forming Day = ignore today’s incomplete daily candle for stable intraday levels.
Levels update once per daily bar unless today is included.
Inputs
• Pullback %
• Range Mode (Rolling | RollingDateRange)
• Lookback (bars)
• RollDays / Fixed Start Date
• Exclude Forming Day
• Show Pullback Label
Why range choice matters
Peak & trough are subjective—different windows give different High/Low. Select your window based on trading horizon:
• Intraday → Rolling (bars)
• Swing/position → RollingDateRange (days/fixed date)
How often are High/Low recomputed?
• Rolling (bars):
Recomputed on every bar of the chart’s timeframe using the most recent lookbackBars window. Levels can change frequently.
• RollingDateRange (Daily context):
Computed once per daily bar for the configured calendar window.
• With Exclude Forming Day = ON, the High/Low only update after the prior daily bar closes.
• With it OFF, the current (forming) daily bar can update the High/Low intraday if it sets a new extreme.
Phát hành các Ghi chú
Pullback IndicatorPlots a retracement level between a detected swing High and Low at a user-defined % (e.g., 38.2, 50, 61.8).
Formula: Level = Low + (High − Low) × (Pullback % / 100).
Merging Y-Axis into one
Once you add this indicator to the chart, you will see two Y-axes (or two price scales). Right-click on the price scales on the right, select “Merge all scales into one,” and choose “On the right.” Also, please right-click again, select Labels -> make sure "Indicators and financials value label" is checked
Modes
• Rolling → High/Low from last N bars on the chart’s timeframe. Recomputed every bar. Good for intraday, fast-adapting ranges.
• RollingDateRange → High/Low from a calendar window (Daily context). Options:
• RollDays = last N calendar days
• or Use Fixed Start Date (window expands day by day)
• Exclude Forming Day = ignore today’s incomplete daily candle for stable intraday levels.
Levels update once per daily bar unless today is included.
Inputs
• Pullback %
• Range Mode (Rolling | RollingDateRange)
• Lookback (bars)
• RollDays / Fixed Start Date
• Exclude Forming Day
• Show Pullback Label
Why range choice matters
Peak & trough are subjective—different windows give different High/Low. Select your window based on trading horizon:
• Intraday → Rolling (bars)
• Swing/position → RollingDateRange (days/fixed date)
How often are High/Low recomputed?
• Rolling (bars):
Recomputed on every bar of the chart’s timeframe using the most recent lookbackBars window. Levels can change frequently.
• RollingDateRange (Daily context):
Computed once per daily bar for the configured calendar window.
• With Exclude Forming Day = ON, the High/Low only update after the prior daily bar closes.
• With it OFF, the current (forming) daily bar can update the High/Low intraday if it sets a new extreme.
Mã được bảo vệ
Tập lệnh này được đăng dưới dạng mã nguồn đóng. Tuy nhiên, bạn có thể sử dụng tự do và không giới hạn – tìm hiểu thêm tại đây.
Thông báo miễn trừ trách nhiệm
Thông tin và các ấn phẩm này không nhằm mục đích, và không cấu thành, lời khuyên hoặc khuyến nghị về tài chính, đầu tư, giao dịch hay các loại khác do TradingView cung cấp hoặc xác nhận. Đọc thêm tại Điều khoản Sử dụng.