Dollar cost averaging (DCA) QFL IndicatorAs investors, we often face the dilemma of willing high stock prices when we sell, but not when we buy. There are times when this dilemma causes investors to wait for a dip in prices, thereby potentially missing out on a continual rise. This is how investors get lured away from the markets and become tangled in the slippery slope of market timing, which is not advisable to a long-term investment strategy.
Skyrex developed a complex indicator based on dollar-cost averaging in Quick Fingers Luc's interpretation. It is a combinations of strategies which allows to systematically accumulate assets by investing scaled amounts of money at defined market cycle global support levels. Dollar-cost averaging can reduce the overall impact of price volatility and lower the average cost per asset thus even during market slumps only a small bounce is required to reach take profit.
The indicator script monitors a chart price action and identifies bases as they form. When bases are reached the script provides entry alerts. During price action development an asset value can go lower and in this way the script will perform safety entries alerts at each subsequent accumulation levels. When weighted average entry price reaches target profit the script will perform a take profit action alert.
Bases are identified as pivot lows in a fractal pattern and validated by an adjustable decrease/rise percentage to ensure significancy of identified bases. To qualify a pivot low, the indicator will perform the following validation:
Validate the price rate of change on drops and bounces is above a given threshold amount.
Validate the volume at the low pivot point is above the volume moving average (using a given length).
Validate the volume amount is a given factor of magnitude above is above the volume moving average.
Validate the potential new base is not too close to the previous range by using a given price percent difference threshold amount.
A fractal pattern is a recurring pattern on a price chart that can predict reversals among larger, more chaotic price movements. These basic fractals are composed of five or more bars. The rules for identifying fractals are as follows:
A bearish turning point occurs when there is a pattern with the highest high in the middle and two lower highs on each side.
A bullish turning point occurs when there is a pattern with the lowest low in the middle and two higher lows on each side.
Basic dollar-cost averaging approach is enhances by implementation of adjustable accumulation levels in order to provide opportunity of setting them at defined global support levels and Martingale volume coefficient to increase averaging effect. According to Quick Fingers Luc's principles trading principles we added volume validation of a base because it allows to confirm that the market is resistant to further price decrease.
The indicator supports traditional and cryptocurrency spot, futures, options and marginal trading exchanges. It works accurately with BTC, USD, USDT, ETH and BNB quote currencies. Best to use with 1H timeframe charts and limit orders. The indicator can be and should be configured for each particular asset according to its global support and resistance levels and price action cycles. You can modify levels and risk management settings to receive better performance
Advantages of this indicator:
The indicator has custom alert settings for each strategy action
The indicator can be used with 3Commas, Cryptohopper, Alertatron or Zignaly bots
The indicator is sustainable to market slumps and can be used for long-term trading
The indicator provides a large number of entries which is good for diversification
Can be applied to any market and quote currency
Easy to configure user interface settings
How to use?
1. Apply indicator to a trading pair your are interested in using 1H timeframe chart
2. Configure the indicator: change layer values, order size multiple and take profit/stop loss values according to current market cycle stage
3. Set up a TradingView custom alert using the indicator settings to trigger on a condition you are interested in
4. The indicator will send alerts when to enter and when to exit positions which can be applied to your portfolio using external trading platforms
5. Update settings once market conditions are changed using backtests on a monthly period
Alert

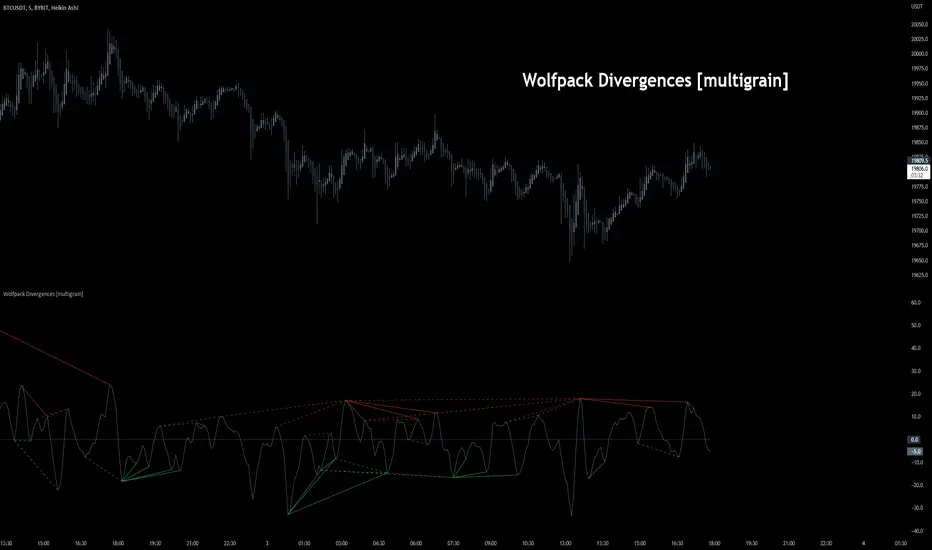
Wolfpack Divergences [multigrain]█ OVERVIEW
A fast and improved divergence finding algorithm that aims to be better than the built-in TradingView divergence algorithm.
█ CONCEPTS
Wolfpack
Wolfpack is an oscillator made popular by darrellfischer1 all the way back in 2017. Since then the Wolfpack oscillator has been utilized by a number of notable strategy/indicator creators. At some point it was realized that the oscillator was simply the Moving Average Crossover Divergence oscillator with the fast and slow length of 3 and 8, respectively. The true significance and reasoning behind these lengths are unknown, however one may surmise that they are chosen due to their relevance as Fibonacci numbers.
Divergences
Divergence is when the price of an asset is moving in the opposite direction of a technical indicator, such as an oscillator, or is moving contrary to other data. Divergence warns that the current price trend may be weakening, and in some cases may lead to the price changing direction.
█ USAGE
Wolfpack
Similar to many other oscillators, when the Wolfpack oscillator reports a value above the zero-line, this indicates a bullish trend in the price. Subsequently, a value below the zero-line indicate a bearish trend in the price.
Divergences
Divergence in technical analysis may signal a major positive or negative price move. A positive divergence occurs when the price of an asset makes a new low while an indicator, such as money flow, starts to climb. Conversely, a negative divergence is when the price makes a new high but the indicator being analyzed makes a lower high.
Impactful pattern and candles pattern AlertThe Alertion indicator!
impactful pattern:
pattern that happen near the zone or in the zone at lower timeframe and give us entry and stop limit price.
It is helpful for price action traders and those who want to decrease their risk.
There are 3 IP patterns:
Quasimodo
Head and shoulder
whipsaw engulfing
These patterns may occur near the zone or may not occur but by them, you can decrease your trading risk for example you can
trade with half lot before IP pattern and enter with other half after pattern.
how to use?
for example:
you find zone at 1h timeframe for short position
when price enter to your zone
you run this indicator and choose your lower timeframe, for example 15m and click on short position.
Then make the alert by right-click on your chart and choose the add alert and at condition box choose the impactful pattern and then click on create
now wait for message :)
Candles pattern:
like reversal bar, key reversal bar, exhaustion bar, pin bar, two-bar reversal, tree-bar reversal, inside bar, outside bar
these occur when the trend turn, so it is usable when the price enter to your zone or near your zone.
This pattern can decrease your risk.
Inside bar and outside bar:
if this pattern engulf up, it is bullish pattern and if engulf down, it is bearish pattern.
what does this indicator do?
this indicator is for making alert
it helps you to decrease your risk and failure.
You optimize it to alert you when IP pattern happen or candle pattern happen or inside bar or outside bar engulfing or all of them.
For IP pattern, it will message you entry and stop limit price.
It works at 2 different timeframes, so you can make alert for example in 1h TF for candles pattern and 15m TF for IP pattern.
Indicator will alert you for candles pattern at your chart timeframe and for IP pattern at timeframe you've chosen when you run the indicator, and it is changeable
in setting.
setting options
TIMEFRAME
IP: select the timeframe for IP patterns it means when IP pattern happen at that timeframe the indicator will alert you
example = your TF is 1h, you found the supply zone and want to trade, note that IP pattern happen in lower TF, so you select 15m TF or TF lower than 1h.
Short position: select it if you want to make short position.
BUFFERING
indicator send you entry and stop limit price
you can change it by amount of percent
it is your strategy to change your entry and stop loss or not
example= in head and shoulder pattern at short position, the stop limit is high price of head in pattern
so the indicator will message you the exact price but if you want to put
your stop limit 5 percent upper than exact price you can enter 5 in front of stop loss
or you want to enter 5 percent lower than exact high price of shoulder, you can optimize it.
ALERTION
you choose what alert you want
IP alert or candle alert or inside and outside bar alert
type your text for alert
you can write additional text for your message
ADVANCE
IP alert frequency option:
1. Once per bar : indicator will alert you for IP pattern once at your chat timeframe bar, and you should wait til next bar for next alert.
2. Once per bar close : alert you when your chart timeframe bar closed and next alert will happen when next bar is closed.
3. All: alert you all the times IP pattern happen
pivot left and right bars: lower will find smaller pattern
at the END:
this indicator is not strategy
it is part of your strategy that help you to increase your winning rate.
It is helpful for scalping and candle patterns finding.
After you make an alert, you can delete the indicator or change your timeframe or make another alert, your previous alert won’t change.
Thank you all.

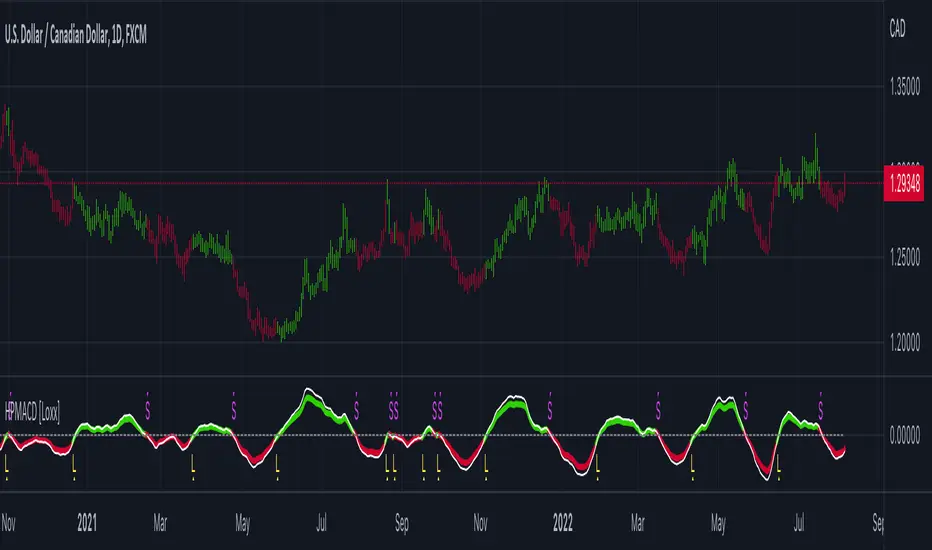
Hodrick-Prescott MACD [Loxx]Hodrick-Prescott MACD is a MACD indicator using a Hodrick-Prescott Filter.
What is Hodrick–Prescott filter?
The Hodrick–Prescott filter (also known as Hodrick–Prescott decomposition) is a mathematical tool used in macroeconomics, especially in real business cycle theory, to remove the cyclical component of a time series from raw data. It is used to obtain a smoothed-curve representation of a time series, one that is more sensitive to long-term than to short-term fluctuations. The adjustment of the sensitivity of the trend to short-term fluctuations is achieved by modifying a multiplier Lambda.
The filter was popularized in the field of economics in the 1990s by economists Robert J. Hodrick and Nobel Memorial Prize winner Edward C. Prescott, though it was first proposed much earlier by E. T. Whittaker in 1923.
There are some drawbacks to use the HP filter than you can read here: en.wikipedia.org
Included
Bar coloring
3 types of signals
Alerts
Loxx's Expanded Source Types
Timed AlertTradingView doesn't offer a way easily set timed alerts. This script solves that problem and also allows you to set variables in the script similar to other alerts.
The variables can be found here .

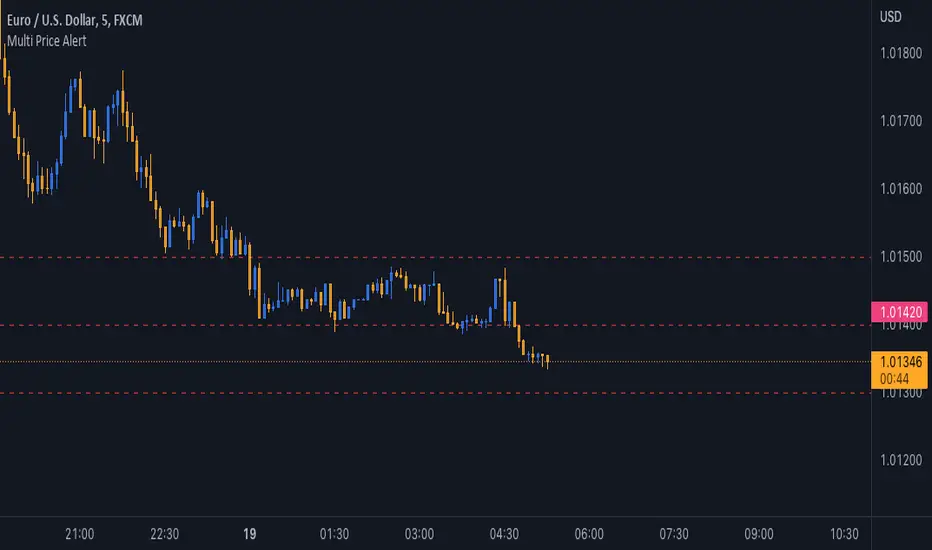
Multi Price AlertSometimes you need set some alert at specific price levels on a chart.
Now you able to set ten different price levels to get alert at this prices.
With this Indicator also Basic Accounts can set more than one alert at price levels.
How to Use :
1- Enable Indicator on your Chart
2- Input your prices on Indicator Settings
3- Active Indicator Alert on 1m Chart (Select Multi Price Alert on Conditions Menu & Once Per Bar on Options)
5- Enjoy !
Notice : If change at prices, you should remove and reset Alert again.
Good trading to all ...
Dragon Double RSI Overbought-Oversold With LabelThis indicator consist of tow RSI length that user can customize it. like length, overbought, oversold. like length, overbought, oversold. also it has one moving average where the user can select from different types of moving averages, price sources, lookback periods and resolutions

Alert example: multiple checked symbols and checked conditionsHere is the example how to check multiple conditions for multiple instruments using only ONE alert.
How to use :
Add into the code needed conditions and instruments.
Apply the indicator on the chart, call Create Alert Dialog and just click "Create".
Enjoy.

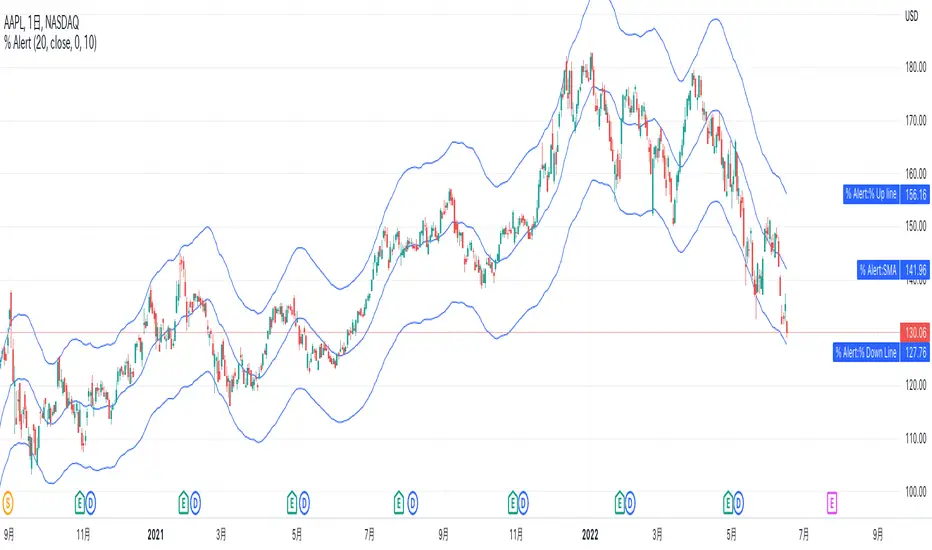
% up/down from SMA AlertsHi all! This script allows an alert option for conditions when the price increase 10% from the SMA and when price decrease 10% from the SMA.
The SMA length defaults to 20, but can be set to any length of your preference at “length” in the inputs tab of the script settings.
Value that increase and decrease 10% from SMA is able to visualize with a line but it can also be hidden in the Style tab.
Also, the default is 10%, but you can set % value of your preference such as 2%, 5%, at "% value" in the inputs tab.
For example with the default settings, if you set the alert condition "% up SMA" in the Alert settings dialog, this alert will be triggered when the price increase 10% from SMA. "% down SMA" will be triggered when the price decrease 10% from SMA.
-----------
このスクリプトは、価格がSMAから10%上昇した時と、10%下降した時の条件のアラートオプションを可能にします。
SMAの期間はデフォルトで20ですが、スクリプト設定のパラメータータブにある「期間」でお好みの期間に設定できます。
そしてこのSMAから10%上昇した値と下降した値は、ラインで視覚的に表示されますが、タイルタブで非表示に指定することも可能です。
また、デフォルトは10%ですが、2%や5%などと、パラメータータブにある「% value」でお好みの%値を設定する事ができます。
例えばデフォルト設定の場合、アラート設定ダイアログで条件を「% up SMA」で設定した場合は、もし価格がSMAから10%上昇したらアラートがトリガーされます。
「% down SMA」を指定した場合は、もし価格がSMAから10%下降したらアラートがトリガーされます。
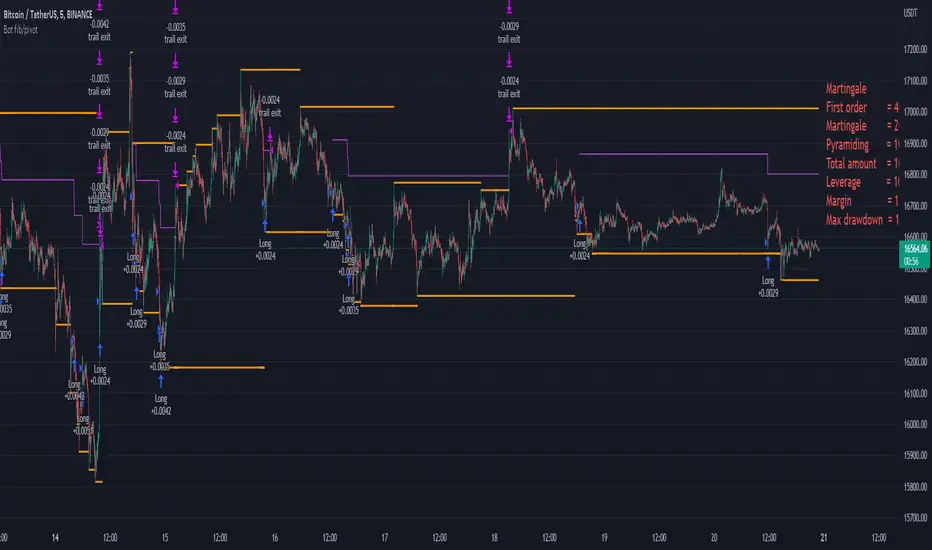
Bot fib/pivot Hello, friends!
This strategy is based on the fibonacci level you choose in the setup and possible pivot points under the control of Williams’ Percent Range.
Williams' Percent Range is a dynamic indicator that detects overbought/oversold conditions.
When the possible reversal points coincide with the fibonacci level, and the high or low points according to Williams also coincide, then an entry occurs.
One of the oldest and most reliable trading tools are widely used support and resistance levels.
In this strategy, we are trying to find these reversal levels based on fibonacci.
//LOGIC ENTRY SETTINGS
Deviation-deviation from the pivot point, the lower this figure, the more entries. The yellow lines on the chart are pivot points.
Fibonacci lvl-fibonacci level, from which the entry will occur, provided that other conditions match
Highest lookback-The setting, which refers to Williams' Percent Range , looks at how many candles ago, was high or low. The smaller the number, the larger, but less accurate inputs.
//AMOUNT(USDT) FIRST ORDER AND > % NEXT
-Martingale first order (the amount of the entrance to the usdt) / next order (Increase of each subsequent order as a percentage)
//EXIT SETTINGS (%, RSI)
-Use RSI for close position? (the position will not be closed if it is in the red, even if the RSI conditions worked)
-Use % for exit? Exit immediately upon reaching the specified percentage
-Use trailing? When the checkbox is checked, the position will be exited by trailing.
Activation trail,after?- When the specified percentage is reached, trailing is activated!
Stop_trail,%- if the last candle falls from the high (after the trailing is activated), the position will be exited.
For example:
We entered the purchase at 100 per asset, activation costs 10, and stop is 2.
the price reached 110, there was an activation, after that it went up to 120, and from the high of the last candle, a 2% drop occurs and the trade is exited.
PS:The default value is 1%, what does this give us? if there is a sharp increase, then we take away all the movement
Use only long?
Allow long?- Only long trades will be displayed
Allow short? Only short trades will be displayed
Allo reverse? Upon receipt of a return signal, the opposite position will be closed.
//MARTINGALE GRID
If there is a check mark in the line "Use martingale and grid?"
then the grid will be active
If there is a check mark in the "Limit each next entry,%?" then, even if the entry from the bot logic is triggered, and the price does not fall by the specified percentage, then there will be no entry!
If there is a check mark in the "Grid,%" column, then purchases with martingale support will be added with a decrease by the specified percentage!
PS: "Grid" always starts anew, as the input from logic triggered!
//FILTER SETTINGS
1) Use filter oscillator? (The filter uses 7 averaged oscillators)
Period-the period for which you will be billing
Upper line-Short entry border.
(if 40, then there will be no entry until it reaches)
Lower line-Long entry border.
(20 until below 20 no entry)
2)Use filter range?
Filter type-moving average selection
Bars back-offset speed based on number of last bars
Period-period to calculate
3)Use filter supertrend?
Supertrend filter with multitimeframe
// How do filters work 2 and 3?
Filters can work either one by one or together.
A trade is entered when conditions from the logic and filters in the red zone are triggered, when there are no entries in the green zone.
//DATA RANGE:
-Testing results for any period of time
//PIRAMIDING
-Also in the settings there is a pyramid of order, keep this in mind. Make a deal for a small part of the deposit, and not for all the money at once!
PS: to use martingale, you need to write in the hook messages:
"amount": "{{strategy.order.contracts}}" (purchases will be in the amount of coins equivalent to USDT)
The default settings for TF are 1 minute, 10 inputs.
You can choose your settings for any TF, but look at different coins to make sure you have good statistics
Signal generatorThis simple script generates signals for testing the connection from TradingView to a REST API client via the webhook and demonstrates very basic concepts of gerenating alerts within the script.
This script also demonstrates how to visualize when a buy or a sell should take place and how to use diagnostics text for bug fixes/informational purposes.
This is for testing and learning only. Do not use with real money as losses WILL occur. This script is for educational purposes only and should only be used with demo accounts, never with real money .
Buy signals are generated when closing price is less then opening price.
Sell Signals are generated when closing price is greater then opening price.
Can also be used to test signal counting and very rudimentary dollar cost averaging.

MACD Multiple AlertsThis script help traders to catch bullish and bearish momentum. It creates an alert for 40 altcoins based on the MACD cross over and cross under.
The MACD input are adjustable in the settings and you can choose your favorite assets.
Simply add this indicator to the chart wait that if finish to load and then create an alert on the time frame of your choice.
Enjoy your trading
F_rank_01

Bounce Manager TrendlinesThe trendline script is made for manual input of trendlines using point clicks on the chart. The script will then see if price respects these lines by the parameters you input in settings panel. On a respectable bounce it will print buy/sell arrows. The script also has functionality to send alerts, this is helpful if you want to automate trendlines . I created this script and many others under the bounce manager toolkit to expand on the signalling capabilities of popular drawing tools as I find using just a crossover to be lacking especialy for full automation.
components:
- Line respect: When price moves past this the script will no longer look for entry until a new trend has been established. The line can also be used as a stop loss.
- Confirmation: When price touches the line during a trend it
will wait to cross over this line to confirm a reaction from the line.
- Consolidation filter: A trend filtering system, this is a distance from
the line price has to break to confirm trend direction.
- Stop loss: This can be set to a percentage distance from the low after
bounce. Or it can be set to the line respect line
- Take profit: This can be a fixed take profit target or a risk to reward
based take profit. With risk to reward it will multiply the stop loss
distance by the input and use that to create target (green cross)
- ATR based or % based: there are 2 versions of the script, one for strict
percentage based logic and another one based on ATR values
If you are having problems figuring out which settings to use I recommend you check the Bounce Manager ATR script for reference as this script plots the components:
Zignaly automation settings:
zignaly integration, you can use the settings panel to decide your risk management. Option to use a fixed take profit % or an automatic risk to reward calculation based on the stop loss. Stop loss can get calculated using the max violation setting as a stop loss (this will put stop loss below line respect level) or when not checked it will use 0.01% below the low of the signal candle as stop loss. Just add your zignaly private key in the settings and use any alert function call as alert. Make sure to use zignaly.com as your webhook url.
If 5 trendlines are not enough use the 20 line input version, this script is for the clean strong trendline trader.
Part of the Honest Algo indicator suite

Moving Averages With Cross AlertsA simple way to add up to 5 moving averages with optional crossover/crossunder alerts.
Available options for Moving Average Type are:
SMA
EMA (default)
HMA
RMA
WMA
VWMA
VWAP
ALMA
By default, 5 moving averages are enabled and set to the following:
MA1 set to 5
MA2 set to 13
MA3 set to 50
MA4 set to 200
MA5 set to 800
Each moving average has the following options:
Enable/Disable
Source (default is close)
Length
Color
Heikin-Ashi Trend AlertThis script:
Adds a Heikin-Ashi line to the chart (EMA-based).
Provides alerts triggered when the color goes from green to red and vice versa.
Just add the indicator to the chart, create an alert and select " Heikin-Ashi Trend Alert " from the dropdown. Profit.

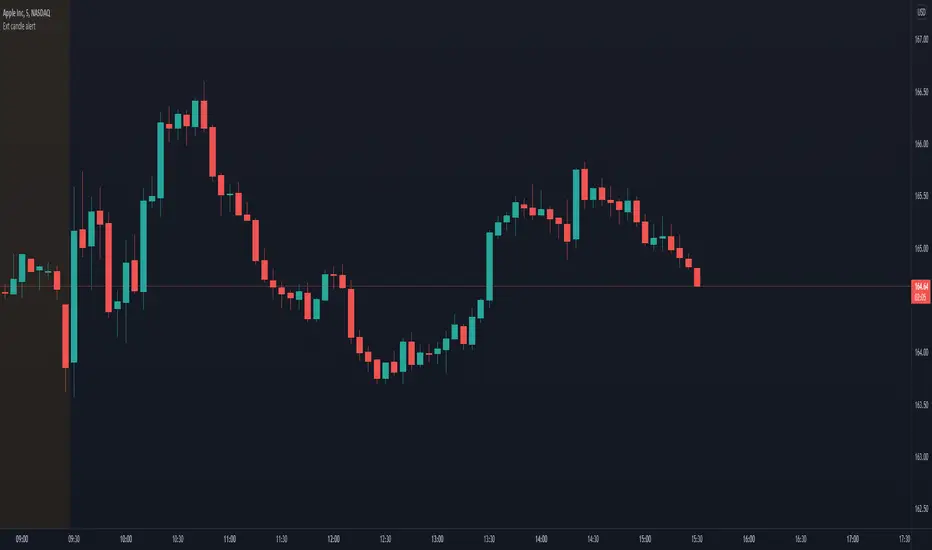
Extended candle alertThis indicator lets you set an alert that triggers when a candle body has got a specific % extension.
Customizable settings
Extension % threshold: the % of the candle extension that has to trigger the alert
Instructions to make it work
Add the indicator to your layout
Set the desidered extension % threshold
Create an alarm (Alt + A)
In the first condition toolbox select "Ext candle alert"
In the second condition toolbox select either long or short condition
Press create (unless you want to change secondary stuff like notification settings)
OBV+EMA HistogramHistogram of the difference between On Balance Volume and an EMA of the On Balance Volume (OBV + EMA).
Using a 55 EMA, on the daily timeframe of BTC, bull/bear trends occur when the histogram is above/below the zero line respectively.
Divergences also have a notable effect.
-- Added alert conditions when OBV crosses EMA to signal a possible trend change, for bullish and bearish cases.

boonam17_ALERT이용 관련 문의는 이메일 boonam17@naver.com 통해 해주시기 바랍니다.
백테스트 결과와 실제 투자 결과는 개인 블로그를 통해 업데이트할 계획입니다.

Renko Candles OverlayHello All,
For long time I got many request for Renko Candles and now here it's, Renko Candles Overlay . I tried to make almost everything optional, so you can play with the options as you want.
Let see the options:
Method: the option for brick scaling method: ATR, ATR/2, ATR/4, Percent, Traditional
- ATR Period: period for Average True Range and it's valid if the method is ATR
- ATR/2 Period: period for Average True Range and it's valid if the method is ATR/2
- ATR/4 Period: period for Average True Range and it's valid if the method is ATR/4
- Traditional: User-defined brick size, it's valid if the method is Traditional
- Percent: Percent of Close price, it's valid if the method is Percent
if the method is not Traditional (fixed brick size) then Brick size is calculated/updated when new bricks added. so The box sizes may be different because of the calculation is dynamic.
Levels & Lines for new Bricks: if you enable this option then the script shows the levels for new brick
Change Bar Color: optionally the script changes the bar color by using direction of the bricks
and some other options for coloring.
The script shows the bricks for visible area, which is approximately 280 candles. so if you change the width and number of the bricks then number of bricks that is shown is adjusted automatically to fit the screen. you can see the examples below:
The script shows the levels to new brick as a line and label:
Because of real-time bar is not confirmed until the candle close, the script shows the bricks as Unconfirmed , and unconfirmed bricks shown in different color:
You can change the width of the bricks (width is 10 in following example):
Optionally candle colors are changde by the direction of the bricks:
If you have any recommendation then please drop a comment under the script ;)
Enjoy!

Alligator: Three signals confirmation with AlertsHello Trading Viewers,
The following is the William’s Alligator indicator with alerts indicating strong momentum, it can be used for scalping in lower time-frames or just riding the momentum in 1hr or 4hrs charts.
Input choices are:
1. Source of Data: Open, Low, High, Close, HL2, HLC3 and so on.
2. Simple and Exponential are the two choices of moving averages.
3. Lips, Teeth and Jaws input numbers are Fibonacci numbers with offsets from -4 to +4.
4. Up Momentum and Down Momentum signals will be plotted top and bottom of the charts respectively when conditions are met.
Idea used to confirm strong momentum
When (High + Low / 2) price is greater than Alligator’s Lips, Teeth, and Jaws, it is considered as a good time to go long; however, to strengthen the idea, the up-momentum condition needs to be approved three times consecutively. (Three consecutive candle bars should remain above Lips, Teeth, and Jaws to trigger an alert signal and plot Up- momentum shape on the charts)
The same idea with down-momentum, but the condition (High + Low / 2) price should be less than Alligator’s Lips, Teeth, and Jaws.
There is an alert set-up, once strong momentum is spotted it will send an alert once per bar close. You can relax and run an errand when the alert is not triggered.
Happy Trading!
TPTR_Dynamic_Ratio_CorrelatorThe script provides a way to compute ratio between two indexes (or stocks) of your choice, and paints a "up-arrow" below the first candle where and when the value of the ratio exceeds your threshold of choice.
It also creates a table summarizing the value of your securities, and the value of the ratio below.
The script will also alert you with a message (automatically) when the ratio of your security_1 and security_2 exceeds the ratio.

[DA]SAR HILODescription of the indicator:
The SAR indicator will indicate a trend change on the chart:
LONG: Red up arrow + GOLONG alert + red horizontal line
SHORT: Blue down arrow + GOSHORT alert + blue horizontal line
A HILO trend channel is also formed, which is reset when the trend changes.
The HILO channel will help you see the price movement in the channel.
Trend change alerts will only work at the close of the current bar.
For GOLONG/GOSHORT alerts to work, you need to select in the Tradingview menu:
Alerts => Indicator Name => Condition => Any call to the alert() function (Any alert() function call)
Price and trend direction in the table:
LONG + Red: The price is trending LONG
LONG + Yellow: The price is moving against the LONG trend
SHORT + Blue color: The price is moving along the SHORT trend
SHORT + Yellow: The price is moving against the SHORT trend
▲▼ Arrows: Rising/Falling bar
% Percentage taken from blue/red levels
I will be glad to receive your feedback on the indicator operation.
[Rygel] MACD 4C with divergences, crossovers and alertsThis indicator is a reliable, exhaustive, instant, simple divergence detector for the MACD 4C oscillator.
I've struggled for months to find a MACD divergence indicator I can rely on, I've tinkered with the ones I found and never was satisfied by the final result. For all of them important divergences were not shown, for some divergences was shown too late, for others divergence lines was not drawn, some even shown some strange exotic divergences... I played will all the parameters and something was always wrong or missing at the end.
It was even worse for the MACD 4C indicator, the 4-color MACD, which I prefer to use.
So I finally decided to write my own divergence algorithm and to create my own indicator. After a few attempts, here's the result.
This MACD indicator is using the same divergence detection algorithm I wrote for my RSI indicator. You'll find on its description page a comparison of my divergence algorithm with other ones to see how it differs.
When I built this indicator, my objectives were to create one that is:
Reliable. I didn't want to have to double-check an indicator to make sure it's doing what I expect it to do. I want to be able to look at it for one second and know I can rely on it.
Exhaustive. I didn't want to have to rely on multiple indicators to be sure I'm not missing a divergence.
Instant. I wanted the divergences to be shown as soon as soon as they form and not after a pivot is confirmed. For some indicator, when the divergence is displayed, it's already too late to act on it.
Simple. I wanted my indicator to be clean, readable and not visually aggressive. The main objective of this indicator is to show divergences and I didn't want to visually overload it with unrequired information.
I wanted my indicator to be a simple as possible, nonetheless you'll find a few parameters to tinker with. Many of them will need no explanation but here's the list.
Show signal line: disabled by default. Show the MACD signal line.
Color signal line: disabled by default. Show the signal line as green when it goes up and read when it goes down.
Show signal crossovers: enabled by default. Show a green dot when MACD crosses up its signal line and a red dot when it crosses down.
Show zero line: enabled by default. Show a line at the 0 value.
Show zero crossovers: disabled by default. Show a green triangle when MACD crosses up the 0 line and a red triangle when it crosses down.
Show regular divergences: enabled by default.
Show hidden divergences: disabled by default for readability. I try to keep the indicator as clean as possible by default.
Bullish regular divergence color : no explanation needed I suppose.
Bullish hidden divergence color : same.
Bearish regular divergence color : ditto.
Bearish hidden divergence color : uhh.
Show overbought and oversell backgrounds : when RSI is oversold or oversell, the background color changes to red or green. The indicator uses two levels of oversold/overbought. When the RSI is strongly oversold/overbought the background color gets brighter. You can configure these levels in the advanced parameters.
Advanced parameters:
MACD fast moving average length: 12 by default.
MACD slow moving average length: 26 by default.
MACD signal moving average length: 9 by default.
Show divergences before pivot confirmation : enabled by default. Divergences will appear as soon as possible, before the pivot is confirmed by another candlestick. Unconfirmed divergences will appear as dashed lines then disappear if not confirmed or turn to solid lines if confirmed. This may create false positives with alerts as the divergence may disappear.
Minimum bars to check: 5 by default. As this indicator detects absolutely all the divergences, some may be insignificant and it may become unreadable without some filtering. If you want to see absolutely all the divergences, you may lower this value. Please note TradingView limits to 50 how many lines are displayed at the same time on an indicator. So when you display more divergences, some in the past disappear. It's not usually an issue but if you scroll back in time, divergences will stop to show at one point in the past.
Maximum bars to check: 75 by default. Divergences may go far in the past, this parameters limit how old a divergence may be. You can higher it to show more divergences.
Show pivots: disabled by default. Show the pivot points used for divergence detections.
This indicator offers the following alerts:
Any divergence
Bearish divergence
Bullish divergence
Regular bearish divergence
Regular bullish divergence
Hidden bearish divergence
Hidden bullish divergence
MACD becoming positive
MACD becoming negative
MACD crossing up signal line
MACD crossing down signal line
Please note TradingView limits for performance reason to 50 the number of lines you can display on an indicator at the same time. So when you scroll back in time, at one point divergences will stop to show. If you want to see divergences far in the past, you may need to use the replay feature or to configure stronger filtering settings.
I hope you'll enjoy this indicator as much as I do! :)
Feel free to comment if you experience a bug or if an important feature is missing for you. (Please note the core of this indicator is divergence detection, I want to keep it simple so I will probably not add many unrelated features to it.)
