LuxAlgo® - Signals & Overlays™Signals & Overlays™ is an all-in-one toolkit made up of more than 20+ features primarily focused on generating useful signals & overlays to fulfill any trader's technical analysis needs with relevant data.
Created directly with TradingView Pine Script Wizard, alexgrover - this is a first of its kind comprehensive script made fully from the ground-up to provide an all-in-one solution for traders.
Signals & Overlays™ can be used alongside other forms of technical analysis, however, it was also designed to be used as a stand-alone toolkit that can fit any trading style. Every feature included considers how not all technical indicators fit every market condition.
The ideal way to utilize this indicator is to explore through all of the features over time, pick & choose 2-3 features best suit your style of trading, and stick with those to create your own unique LuxAlgo trading strategy.
Providing Endless Possibilities Catering To All Trading Styles
Signals & Overlays™ works in any market for discretionary analysis & includes many features:
Beginner-friendly Presets to enable multiple features at once within one-click (locks other settings when enabled).
Confirmation Signals: Normal & Strong signals to help traders confirm trends (not to be followed blindly).
Contrarian Signals: Normal & Strong to help traders spot reversals (also not to be followed blindly).
Exit Signals: "x" marks that apply for both Confirmation Signals & Contrarian Signals to suggest potential take-profit areas during signals.
Signal Optimization Methods: Sensitivity / Agility, optimal sensitvity parameter displayed on dashboard, and Autopilot (dynamic setting).
Candle Coloring: Purple/Green/Red to visualize trends developing between 'normal' & 'strong'.
6+ Indicator Overlays that helps traders visualize trends, find reversal points, and get dynamic areas of support & resistance.
Filters within "Presets / Filters" to allow users to filter Confirmation Signals with Indicator Overlays & other metrics within LuxAlgo Premium.
A complete dashboard with highly actionable metrics such as Trend Strength, current volatility, volume analysis, etc.
Advanced Settings to display customizable TP/SL points, further enhance signal optimizations, & customize dashboard size/location.
Full Any Alert() Function Call Conditions included
Highly useful Filtered Alert Creator section to generate custom filtered signal alerts with Indicator Overlays & other metrics.
+ more. (Check the changelog below for current features)
🔶 USAGE
Basic Signals & Candle Coloring Demonstration
In the image below we can see a basic example of how these 2 core components function within Signals & Overlays™.
As explained earlier, the Confirmation Signals can generate normal labels as well as strong labels marked by the "+" symbol. These signals are directly correlated to the candle coloring in order to see the development of trends & navigate through different market conditions as best as possible.
The candle coloring comes especially in handy when using signals, whereas a positive sign for an uptrend to occur rather than a fake-out is to see candles consistently hold as green. This indicates the market is strong & is likely to continue an uptrend. Vice versa for sell signals & the candles holding as red.
Normal Confirmation Signals often occur with smaller trends, retracements within larger trends, or just as signals a user may not want to trust as much directly. In order to enhance your ability to trust signals more & find more actionable use cases out of LuxAlgo Premium, we recommend going to the settings menu of the indicator & activating some indicator overlays. These are covered in the next section.
🔶 INDICATOR OVERLAYS W/ SIGNALS
In the image below we have enabled the "Smart Trail" & "Reversal Zones" indicator overlays from within the settings of Signals & Overlays™. By using these overlays alongside the signals & candle coloring, users can find more confluence to create trading strategies or plans.
The Smart Trail provides an excellent area of dynamic support/resistance for traders, as well as an additional confluence for general trend following purposes alongside the Confirmation Signals.
The Reversal Zones are particularly useful for areas to immediately take profit on trades, however, during strong trends price may continue rising or falling through the Reversal Zones which makes a good use case of waiting for price to first exit the Reversal Zones before considering the next move in the market.
In the next image below we can see the market is generally ranging, making it more complicated for the standard Confirmation signals to perform greatly as they are meant to excel for finding developing trends. This image displays the Contrarian Signal Mode, Contrarian Gradient candle coloring, as well as the Trend Catcher Indicator Overlay to help us trade these market conditions specifically.
Paired with the Contrarian based candle coloring, these signals can be helpful to a trader looking to find confluent reversals. You can also see the Trend Catcher indicator overlay gives a hybrid approach to analyzing the underlying trend within this price action.
Some traders naturally are Contrarian in nature, so this signal mode may be of primary interest to them, however, most of the use cases will come from the standard Confirmation sigals paired with other overlays or regular technical analysis.
🔶 SIGNALS WITH AI CLASSIFICATION
Our toolkit is able to classify generated signals using a simple machine learning algorithm into four levels. These levels indicate if a signal will most likely indicate a trend continuation (level 3/4) or a reversal/retracement (1/2).
Users are able to filter out certain signals depending on their classification, only keeping signals of interest and potential filtering out false signals.
🔶 FILTERS
In the next image below we can see after resetting the Signals & Overlays™ indicator to it's defaults, we have simply enabled the "Smart Trail Filter" from within the Presets / Filters section at the top of the settings.
By doing this, we can filter out signals that are not aligned with the Smart Trail indicator overlay, which gives direct confluence in every signal that generates on the chart.
Applying filters to signals do not necessarily make them instantly "better" than using the indicator without them. Between every technical indicator, there are trade-offs. So while we can now use Confirmation signals & retests of the Smart Trail as great optimal entry points, at times the indicator may miss signals or retests of the Smart Trail.
The same is seen below with another one of the Filters within Signals & Overlays™; Trend Strength Filter.
We can see the indicator is using the Trend Strength metric to only generate Confirmation Signals that align with a trending market which can clean up a lot of noise during retracements as well as ranging markets.
However, the trade-off present now with this filter enabled is that at times the indicator will miss trends, in which we'd still need to be aware of the price action, candle coloring, or other forms of analysis to give us indications the market may start a new trend opposed to just relying on signals directly.
🔶 CONCLUSION
We believe that success lies in the association of the user with the indicator, opposed to many traders who have the perspective that the indicator itself can make them become profitable. The reality is much more complicated than that.
The aim is to provide an indicator comprehensive, customizable, and intuitive enough that any trader can be led to understand this truth and develop an actionable perspective of technical indicators as support tools for decision making.
You can see the Author's instructions below to get instant access to this indicator & our LuxAlgo Premium indicator suite.
🔶 RISK DISCLAIMER
Trading is risky & most day traders lose money. All content, tools, scripts, articles, & education provided by LuxAlgo are purely for informational & educational purposes only. Past performance does not guarantee future results.
Algo

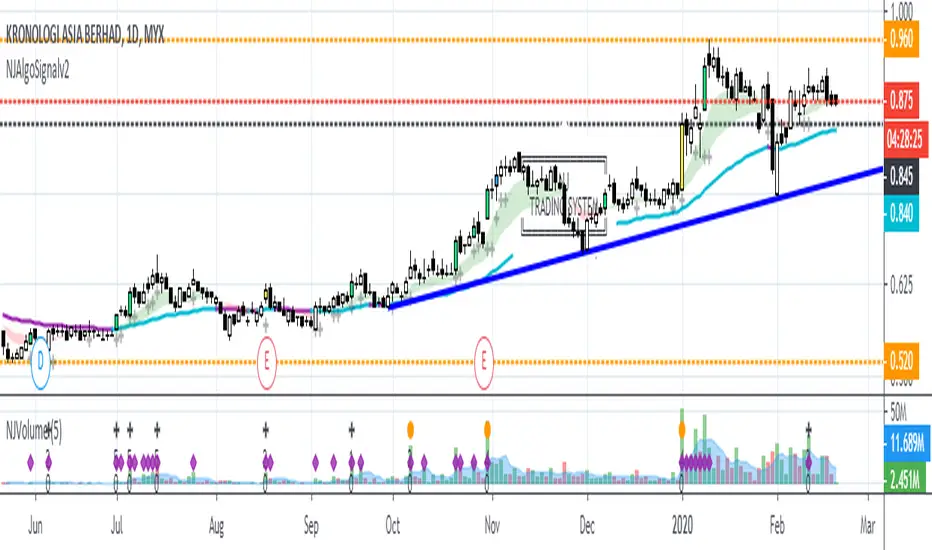
NJAlgoSignalv2NJ-ALGO-SIGNAL
Combination of Price Breakout with Volume
Bar Color
Yellow = Breakout with Volume and Trend Change
Lime = Breakout with Volume
Blue = Breakout without Volume
Black Line = Trailing Stop Line
Sell when price break the Stop Loss Line.
Try to entry on Yellow and Lime Candle.
Can consider to exit when Blue Candle occur. Sign of weakness on uptrend.
Label
Shows only when bar color condition meet
Calculate risk level based on the current price and trailing stop loss line (Black Line).
52W High
By default is off.
Background Color
To Indicate Bullish or Bearish zone.
Green = Bullish zone
Red = Bearish zone
[B] hamster-bot ZZ Breakout reversal strategyAttention! This is a beta version of the strategy script >> <<
A backtest should only be done if you understand how the options work. Otherwise, do a test in the release version

CryptoEngineering 🔥Isn’t It Time You Made Your Crypto Portfolio Great Again? 🔥
The falling knives, the heartbreaking crashes, the devastating feeling of watching a missed trade soar all the way to the moon.
The markets aren’t fair, which means you need a tool that gives you an edge. So,It is time to try EngineeringRobo.
The Engineeringrobo is a great ally in a crypto market - when the price moves the algorithm will automatically show Buy and Sell orders when there is a best opportunity to make a profit. It is a just SMART trading system script on TradingView that brings the easiest approach to trading with a high profitability rate.
I created EngineeringRobo to help you on your traders as a robo advisor , It will "not " trade on behalf of you on exchanges via API. It is not an AI robot,It is am ALGO Trading robot. You can use it on any trading markets (BIST, S&P 500,Commodities ,Forex, Crypto ) with any time frame!
My unique algorithm find profitable altcoins based on their Ichimoku, McGinley, MA, RSI, MACD, Stochastic, Volumes and Price Changes gives you BUY and SELL signals. The EngineeringRobo indicator displays two different signals for entry and exit on a coin to maximize its profitability on the chart. The signals can appear at any time during an open candle, but once closed the signal is final and wont change in the future.
One of the biggest advantages of algo trading is removing human emotion from the crypto markets,humans trading are susceptible to emotions that lead to irrational decisions.Robo doesn't have to think or feel good to make a trade. If conditions are met, it enters.When the trade goes the wrong way or hits a profit target, It exits. It doesn't get angry at the market or feel invincible after making a few good trades. The two emotions that lead to poor decisions that algo traders aren't susceptible to are fear,and greed.
That's why It makes money but most of you not!
What Are the Advantages of using it as a ROBO Advisor?
🔴Reduce your required screen-time
🔴Reduce anxiety over missing setups when you are busy
🔴Turn existing indicators into alerts (eg. Whenever RSI goes overbought)
🔴Find comfort in knowing that you have me on your side
To get the maximized results from @EngineeringRobo
Open tradingview
Decide the coin/BTC
Pick 1M
Draw the Support & Resistance lines
Change the 1W
Draw the lines - Support & Resistance
Find out Chart Patterns
Change to 3D/1D / 3H
Check Robo' signals
Set your orders
Enjoy your profits💰
***Even the best automated day trading software can trigger false trends.
In August 2012 by Knight Capital group;who lost over $440 million in just half an hour when their trading software went rogue in response to market conditions. That's why it is a Robo advisor not trading bot! Engineeringrobo is not a get-rich-quick scheme as well!
Disclaimer
Information on EngineeringRobo should not be seen as a recommendation to trade BIST, S&P 500,Commodities ,Forex, Crypto.
EngineeringRobo is not licensed nor authorized to provide advice on investing and related matters.
Information on the page is not, nor should it be seen as investment advice.Any trading decisions that you make are solely your responsibility. Clients without sufficient knowledge should seek individual advice from an authorized source.
Crypto and Forex trading entails significant risks and there is a chance that clients lose all of their invested money. Past performance is not a guarantee of future returns. Before trading with any of the Algos, clients should make sure they understand the risks.
EngineeringRobo nor its agents or partners are not registered and do not provide any services on the US territory.
***I have been trading since 2016 . Got my first bitcoin in 2013

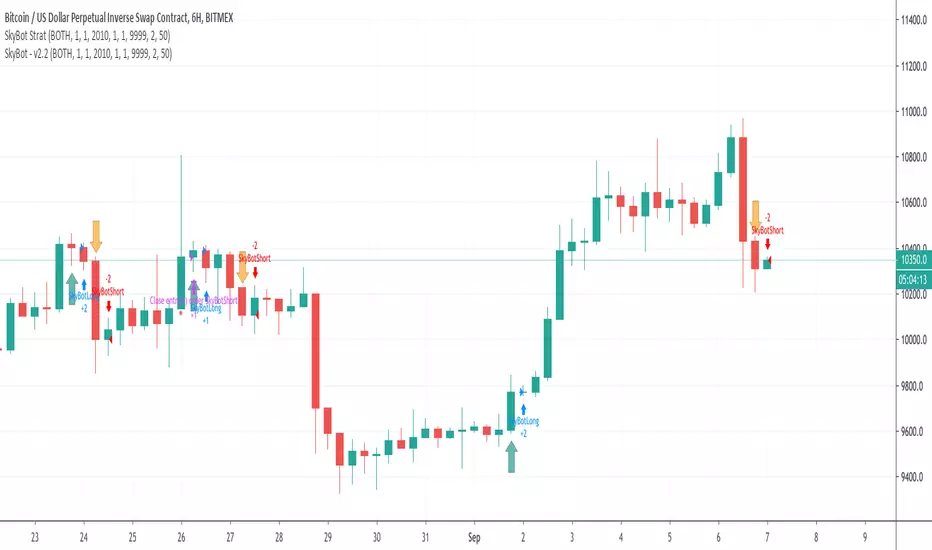
SkyBot Strategy - BTC and XBTUSD Trading Bot for CryptoThe SkyBot is written to provide a good balance between long-term trading and short-term for more action. It has been running for over a year before it was decided to share with the public.
SkyBot uses moving price action data from multiple time frames to determine when to go long or short. It also provides the user with the ability to use stop loss and take profit values to match whatever risk management rules you use in your trading.
SkyBot has simple to use alerts making it simple to use with many auto-trading offers.
SkyBot has been coded in the latest version of Pine (v4) and will be updated as new features, functionality, and support is released with Pine.
To get access to SkyBot, please signup here: cryptoscriptking.com
This is the indicator script that is intended to be used to get alerts for the purposes of automation. The strategy script is also included allowing you to do your own backtesting.
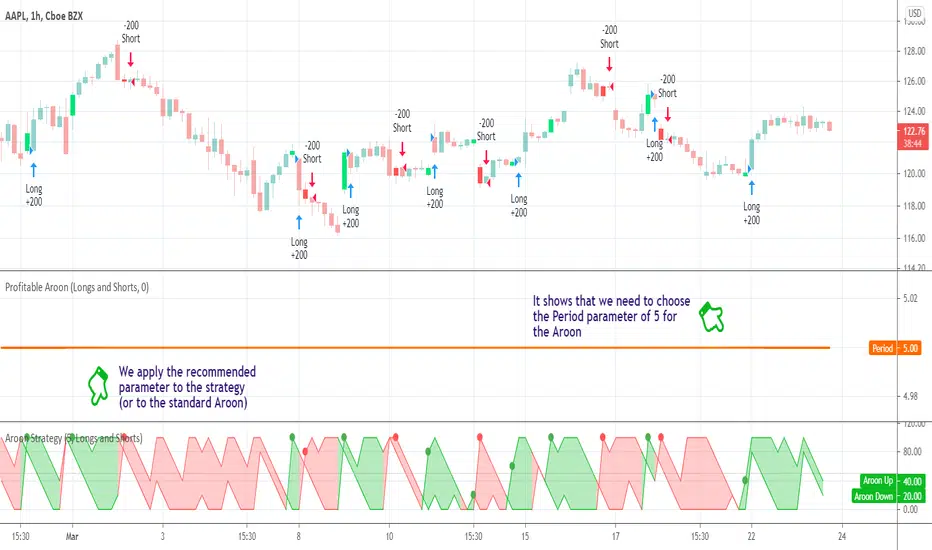
Profitable AroonIntroduction
The Aroon indicator was developed by well-known technical analyst Tushar Chande in 1995 and is used to identify trend changes in the price of an asset, as well as the strength of that trend. The fact that he named the indicator "Aroon" which is Sanskrit for "Dawn’s Early Light" demonstrates his belief in his indicator's trend discovery capabilities.
It is composed of two lines, Aroon Up and Aroon Down .
The most basic strategy is to use the crossovers as trade signals:
when Aroon Up crosses above Aroon Down , go Long
when Aroon Down crosses above Aroon Up , go Short
Exit when a crossover occurs in the opposite direction
What is this tool?
This tool is a performance scanner that uses a decision tree-based algorithm under the hood to find the most profitable period setting for the Aroon. It analyzes the range of periods between 2 to 100 and backtests the Aroon indicator for each period using the strategy mentioned above across the entire history of an instrument. If a more profitable parameter was found, the indicator will switch its value to the found one immediately.
Alerts
It has an alert that notifies when a more profitable period was found.
NOTE : It does not change what has already been plotted.
Good luck and Happy Trading!
[New series!] [Consistent Losing Strategies] 34 EMA Scalping//---------------------------INTRO------------------------------
Hi All!
Let me introduce myself as a semi-successful forex trader & lover of automation.
I've taken to algo trading and have been hunting down strategies (that usually use indicators) to automate, backtest, and hopefully implement in MT4.
Unfortunately, most strategies are complete bulls*** and the select cases that are shown to "prove" success are limited.
These strategy sources often do not provide useful analytics either.
I want to change that approach to trading! We can really benefit each other and the community by being methodical about backtesting
as well as evaluating our results with some kind of scoring heuristic.
As for what that standardized process looks like..well I'm still working on it.
I'm pretty much on Tv for multiple hours of the day, screening strategies via Pinescript and I'd like to start sharing my progress!
This is a new series I'd like to start on consistently losing strategies. I'll make all the code public, so if you think I've made a blunder
or approached a problem the wrong way, then drop me a DM or paste your fix into the comments.
//---------------------------STRAT------------------------------
34 EMA Scalping strategy (ref. forextradingstrategies4u )
How you're supposed to trade it:
BUY:
1. Market is in an down trend as shown by the 34 EMA
2. Price breaks above a downwards trend line
3. Price breaks above the 34 EMA
4. Look for a very bullish candlestick or chart pattern
SELL:
1. Look for the 34 EMA to show we are in an uptrend
2. Price breaks below an upwards sloping trend line
3. Price breaks below 34 EMA
4. Look for a bearish candlestick or a chart pattern
//---------------------------CONC------------------------------
Q: Why does it fail?
A: I believe this strategy relies too much on subjective input (aka, trendlines).
Q: Why does it fail as an algo?
A: The 34 EMA is no more predictive than any other EMA, although it does a good job at filtering out noise.
Q: Should I try it out?
A: No, it's trash. This is the proof that it is trash.

Trend Precognition - Mtrl_Scientist (arrow-only)Hey everybody,
Per request, I'm also adding the arrow-version to the updated base algorithm.
However, I advise everyone to also add the indicator version that I published previously.

Trend Precognition - Mtrl_ScientistHi everyone,
This is an updated version of my base algorithm "BTC Precognition". I've managed to remove some lag, while at the same time smoothing the curve (blue).
All you need to know about it is on the chart's legend. The arrows just correspond to the bottoms/tops of the blue signal curve (marked with green/red circles). However, predicting turning points is difficult and I'm still working on that. So for now, the signals are offset by 1 candle into the past. This means that all of your trades will be 1 candle late, unless you trade intrabar using your own intuition. As a help, I've also included the first derivative (black curve) that will tell you the slope of the blue curve. Remember, when the curve is about to turn, the slope becomes zero. However, you can anticipate this by looking at the slope's direction and guessing when it will cross the zero line.
This is still all work in progress, so invite-only.

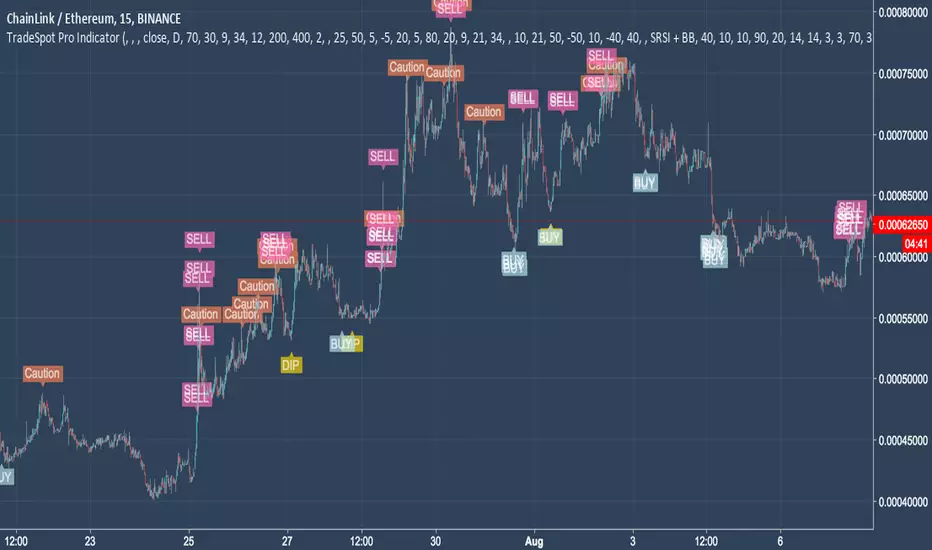
TradeSpot Pro || Accompanying Strategy indicatorTradeSpot Pro
Overview
This script is an accompaniment to the existing TradeSpot Pro || All Purpose Advanced Trading Indicator
This script is for swing trading with longs, primarily on Binance / Kucoin / Coinbase and other crypto exchanes but is not limited to those markets. The details of what logic is behind the script can be found on the indicator version linked above.
Bags? This script has been tweaked and modified to completely destroy bear markets despite being focused on longs, see the BTCUSD image or PM me for any chart of your liking. I dislike indicators that show an amazing looking run in a bull market but in bear markets they fall apart - well with TradeSpot Pro that is not the case, it is completely market agnostic
Access
For details of access please join the TradeSpot community server where we can sort you out: discord.gg
Alternatively PM me if you would like to directly purchase the strategy and paired indicator.

TradeSpot Pro || All Purpose Advanced Trading Indicator & AlertsTradeSpot Pro Indicator
Version: 1.0
TradeSpot Community Website
TradeSpot is a community of traders that specialise in using automated bots to execute spot & margin trading, you can join up via the above link where you too can discuss cryptocurrency, general trading, investments and get informed on the latest botting tools to enhance your day to day trading.
For an in-depth explanation and briefing on what this indicator is capable of, please contact me directly.
Features
Inclusion of all 4 highly regarded indicators previously used by the indicator and combined into one cross-functional powerhouse script sporting different strategies eg. EMA, RMI, RSI, BB based signals (and more!
Neat presentable UI for easily displaying the quality of your current settings.
Incredible customisation, one of the most heavily parameterised scripts on TradingView - this is not a plug and play solution but rather a script you can learn and tweak to really fine tune your strategy, ultimately improving results.
Big list of features listed on the community Discord server that will be developed and added to the indictor in good time (and a backtesting script!).
Combine indicators, a heavily asked for feature finally here - being able to match the signals between included indicators to create an even more robust trading signal.
Scripted with a full array of custom and alerts and more coming for use in manual trading endeavours to never miss a trade or for use with automated bot solutions that can be seen on the community site.
Access
Discord Server
For trial access please follow the link the server above and use the '!trial' command on the chat channel. If you don't use Discord please private message me on here.
Omni Trader Accompanying Backtesting StrategyVersion 1.0
Purpose
This backtesting strategy indicator is a accompanying tool for use with my popular trading and alert indicator: Omni Trader | RMI EMA RSI VOL | Margin Focused Indicator
Reference Indicator Link:
Features
This strategy has been programmed to act exactly how the accompanying indicator would be used with an automated strategy such as Autoview or through manual trading
Has identical coloured signals with correct icons for reference with the indicators standard alert conditions (LONG/SHORT)
The ability to toggle on or off all the logic and UI presets you could previously use to enhance the standard indicator
Fully customisable in the settings regarding trading strategy to match exactly how you have the reference indicator set up with alerts or how you are trading manually with it.
Ability to choose a timeframe, want to ignore the crypto boom at the latter stages of 2017? Sure you can, change the time frames in the settings to see a more recent representation of your trades.
Stop Loss & Take Profit enabled in this back tester for fine tuning of your strategy, especially useful for automated users to refine the most profitable settings for your style.
Access
This indicator is free for existing owners of my Omni Trader | RMI EMA RSI VOL | Margin Focused Indicator linked above as an accompanying tool to improve their strategy and net more profit. If you would like access to any of my indicators or would like to know more please find me on my community discord channel where you can find indicator details/documentation and general help:
Discord Link: discord.gg
Thank you for the immense support everyone, happy trading!
- Falco

Fibonacci Algo - LongAutomatic Fibonacci retracement entry, stop loss and extension target level as apart of a customisable strategy.
Automatic plots of 23.6% 38.2%, 50%, 61.8%, 65%, 78.6% and -23.6, -61.8% and -100% levels.
Customisable Fib Length - Time period over which max and min pivots are chosen.
Customisable Offsetfib - Offsets the pivots and sell zone as your entry position
will be some time after the upper and lower pivots are set.
Vegas Wave - Automatic plot. Shows price relative to wave and EMA crossover - See my 'Vegas Wave' code for more of an explanation.
A strategy based off buying the 50-618 with a defined stop loss the other side of the 65 or 786 can easily be formulated.
This tool will automatically plot those points but a defined Risk Management strategy will always be needed.
The 236 and 382 region can also be plotted, allowing for lesser retracements coinciding with wave 4 pullbacks ( Elliott Wave Traders).
Works best in Bullish trends but will work on all timeframes (Bullish correction in an downtrend also possible).
Previous pivots shown but be careful to identify which of the several pivots you are using.
Start at a larger timeframe and move down. (Entries consistent on several timeframes are golden)
Pivots and retracements are dynamic. Be sure to note your entry and targets.
Works well when used in combination with an oscillator which highlights Divergence.
Also refer to my other 'Fibonacci' Codes for more context.

MACD, backtest 2015+ only, cut in half and doubledThis is only a slight modification to the existing "MACD Strategy" strategy plugin!
found the default MACD strategy to be lacking, although impressive for its simplicity. I added "year>2014" to the IF buy/sell conditions so it will only backtest from 2015 and beyond ** .
I also had a problem with the standard MACD trading late, per se. To that end I modified the inputs for fast/slow/signal to double. Example: my defaults are 10, 21, 10 so I put 20, 42, 20 in. This has the effect of making a 30min interval the same as 1 hour at 10,21,10. So if you want to backtest at 4hr, you would set your time interval to 2hr on the main chart. This is a handy way to make shorter time periods more useful even regardless of strategy/testing, since you can view 15min with alot less noise but a better response.
Used on BTCCNY OKcoin, with the chart set at 45 min (so really 90min in the strategy) this gave me a percent profitable of 42% and a profit factor of 1.998 on 189 trades.
Personally, I like to set the length/signals to 30,63,30. Meaning you need to triple the time, it allows for much better use of shorter time periods and the backtests are remarkably profitable. (i.e. 15min chart view = 45min on script, 30min= 1.5hr on script)
** If you want more specific time periods you need to try plugging in different bar values: replace "year" with "n" and "2014" with "5500". The bars are based on unix time I believe so you will need to play around with the number for n, with n being the numbers of bars.
