Arbitrage Tick (Pro)Arbitrage Tick Pro is meant for Longer Term Traders who want to reduce noise.
It also allows us to see all Major Higher Highs while not ignoring Minor Higher Highs and Lower Lows (Faded) that may occur.
If you like to buy and hold this in conjunction with the Arbitrage Pro Band allows you to Maximize your profit and minimize your stress
This indicator also has built in alerts to help keep you informed of when the tides have changed on both Major and Minor Scales.
Enjoy,
Arbitrage Trade Team
Arbitrage

Arbitrage 3D
Good morning Traders,
Imagine each stock is its own universe
And within each universe there are Galaxies (Multiple time frames to trade within)
And within each Galaxy there are planets that orbit bigger planets that orbit the sun (Arbitrage Bands)
Wouldn't it be cool if you ALWAYS knew WHERE you were in the galaxy and could actually SEE the reversal coming?
Well now you can!
We would like to introduce Arbitrage 3D
This tool is designed for those risk takers who love to live on the edge.
Stop Guessing, Start Profiting
Your Arbitrage Trading Team
Once you eliminate the impossible, whatever remains, no matter how improbable, must be the truth.
--Arthur Conan Doyle

Arbitrage SR v1.45Fact: Support and resistance are the foundation of every trade.
Are you tired of looking for support?
That’s static?
Doesn’t work all the time?
Tired of guessing when the stock will stop falling?
Taking profit too soon?
Well look no further Arbitrage SR is here to help you have better entrances and superb exits.
If you’re no stranger to Arbitrage bands this little gem will help your confidence levels soar!
Let’s keep this easy:
Only buy when the maroon line is sitting on the bottom of the support line
Only sell when you see the maroon line up against the the top resistance line. If you like elliot waves. You will love Arbitrage SR.
This is the single most asked question: Am I too late to enter the trade? The answer is simple Wait for the maroon line to touch support and that's your next entry into the trade.
Use it on any time frame. We personally love the 15 minute and Daily.
As always thank you for your support
Arbitrage Trade Team

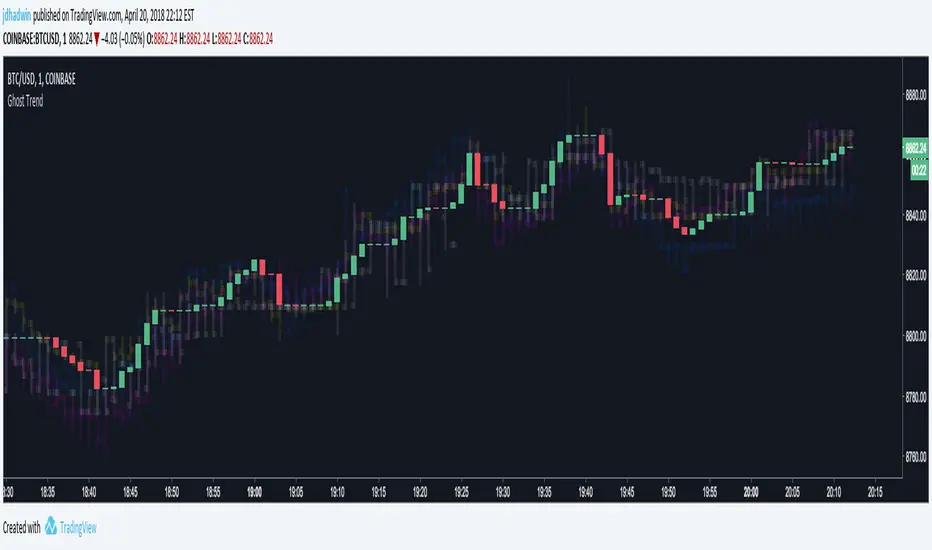
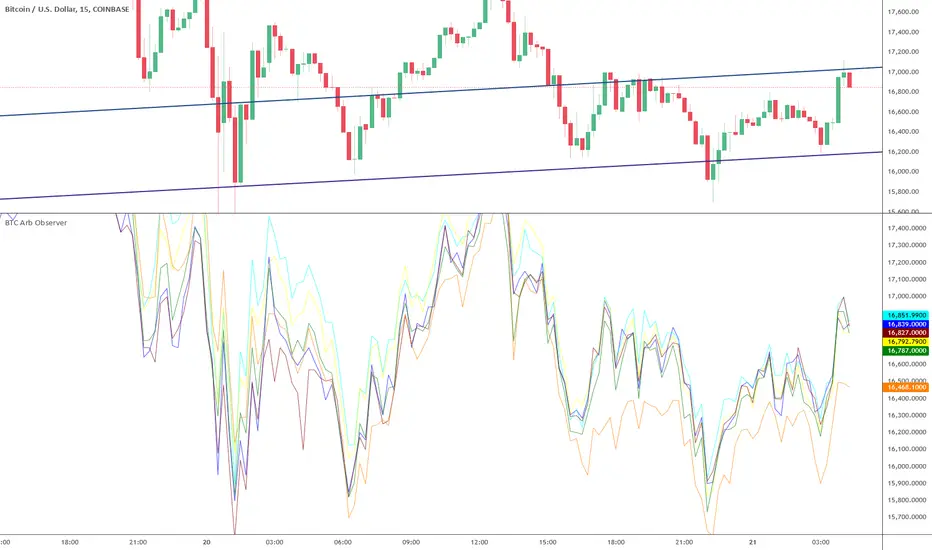
Ghost TrendUse ghosted charts from multiple exchanges to visualize global market trends for your trading pair BEFORE the trend comes to your exchange. Use Ghost Averaging to find what Bitcoin is ACTUALLY doing across up to four exchanges, by averaging all four exchanges into a single ghost. As for the name, Ghost Trend just sounded way cooler than Arbitrage Helper!
Hone your skills and you may even find yourself able to avoid crashes moments BEFORE they happen, or able buy right BEFORE a take-off. Ghosts sometimes show moves earlier than the exchange you're using. But be careful, sometimes ghosts are nasty little deceivers 8o
Instructions:
First time ghosting? Start out with a 1 minute Bitcoin chart on Coinbase ( ), then check out the Ghost Trend settings.
Start small, pick just one alternate exchange (say Bitfinex ) and play with the Ghosted Open/High/Low/Close settings. Certain combinations will display bars by default, others will display plotted lines. Make it work for you.
Next, pick a second exchange and you'll see a second ghost. Now comes the fun part. Click "Average Ghosted Pairs". Now you're looking at the two averaged together. You can even average Coinbase back into the Ghosted Average if you want. Add up to four, and most importantly, have fun.
DON'T FORGET TO SET THE CORRECT CHART RESOLUTION!!! Everything goes haywire if you mismatch Ghost Trend's resolution with your current chart.
Lots of fun to be had on the 1 minute chart, but it's especially useful to use Ghost Averaging with Open and Close unchecked and High and Low checked, when on greater resolution charts. ;) Happy arbitraging!
If you'd like to incorporate Ghost Trend into your script, you know where to find me.
~jdhadwin
Spreads + MA + Bollinger Bands [USDBRL] Crypto
Cryptocurrency adoption is on a constant upward trajectory. The interest for trading 'crypto assets' could not stay anywhere behind. The amateur nature of the market together with huge 'price inefficiencies' is always giving rise to excellent arbitrage opportunities throughout the globe. This code aims to help traders to make money placing safe and profitable trades which will eventually help the community to move towards more efficient price discovery.
The script combines up to three assets to be monitored at the same time. It also allows the trader to plot Simple or Exponential Moving Averages and Bollinger Bands (BB) for each asset he wants to trade.
Instructions:
* International/local -- it allows the trader to switch between international spreads and local (currency) spreads, considering the market he is targeting. The default value is international. Unchecking the field will set the script for local trades.
* Fees -- enables one to add his effective operational cost directly on the chart. This feature might be potentially relevant for traders who engage with fast-moving markets which demands action to be taken right away. The logic for calculations when fees are in place is the following (fee ≠ 0): if (spread > 0), then (spread - fee). If (spread < 0), then (spread + fee). When the spread is too short, the code may plot somewhat weird charts. In this case, it might be interesting to keep fee = 0.
* Standard/ Absolute BB -- it changes from standard Bollinger Bands (default value) to absolute Bollinger Bands . The standard version calculates the bands over the moving average. The absolute version calculates each band in isolation taking absolute values as arguments. Play with the two options (and deviation) to see which is better regarding your market and the instrument of your choice. Uncheck the field to get the absolute version. Feedback on this point is particularly appreciated.
* Expon. Ma -- it switches everything from Simple Moving Averages ( SMA ) to Exponential Moving Averages ( EMA ). Default value: SMA .
I hope you guys manage to make money using the script. And if you do, feel free to show your appreciation. Any amount is welcome! Let's take advantage of what crypto enabled us.
Tips : =>
BTC: 33RUY4AXBEL89gEsoqDpXRgvdZWePhLrqc
LTC: M9mBqVhxWNuZuCPEsrRtH3ygxNYnCdMEki
LTC: 36btZsgNxqiPibag6quTEtdX367wXskUnJ (old format)
ETH: 0x1D3E1701F1A0C379e7Fcb60BADBcd14AcE8160c4
DASH: XnKHHcmhZmR2SAqavP1x6FbEBrqTYa4kTk
If you want to use the script, please, let me know leaving a comment below.
Trade wisely and good luck out there.
Spreads + MA + Bollinger BandsCryptocurrency adoption is on a constant upward trajectory. The interest for trading 'crypto assets' could not stay anywhere behind. The amateur nature of the market together with huge 'price inefficiencies' is always giving rise to excellent arbitrage opportunities throughout the globe. This code aims to help traders to make money placing safe and profitable trades which will eventually help the community to move towards more efficient price discovery.
The script combines up to three assets to be monitored at the same time. It also allows the trader to plot Simple or Exponential Moving Averages and Bollinger Bands (BB) for each asset he wants to trade.
Instructions:
* International/local -- it allows the trader to switch between international spreads and local (currency) spreads, considering the market he is targeting. The default value is international. Unchecking the field will set the script for local trades.
* Fees -- enables one to add his effective operational cost directly on the chart. This feature might be potentially relevant for traders who engage with fast-moving markets which demands action to be taken right away. The logic for calculations when fees are in place is the following (fee ≠ 0): if (spread > 0), then (spread - fee). If (spread < 0), then (spread + fee). When the spread is too short, the code may plot somewhat weird charts. In this case, it might be interesting to keep fee = 0.
* Standard/ Absolute BB -- it changes from standard Bollinger Bands (default value) to absolute Bollinger Bands. The standard version calculates the bands over the moving average. The absolute version calculates each band in isolation taking absolute values as arguments. Play with the two options (and deviation) to see which is better regarding your market and the instrument of your choice. Uncheck the field to get the absolute version. Feedback on this point is particularly appreciated.
* Expon. Ma -- it switches everything from Simple Moving Averages (SMA) to Exponential Moving Averages (EMA). Default value: SMA.
I hope you guys manage to make money using the script. And if you do, feel free to show your appreciation. Any amount is welcome! Let's take advantage of what crypto enabled us.
Tips : =>
BTC: 33RUY4AXBEL89gEsoqDpXRgvdZWePhLrqc
LTC: M9mBqVhxWNuZuCPEsrRtH3ygxNYnCdMEki
LTC: 36btZsgNxqiPibag6quTEtdX367wXskUnJ (old format)
ETH: 0x1D3E1701F1A0C379e7Fcb60BADBcd14AcE8160c4
DASH: XnKHHcmhZmR2SAqavP1x6FbEBrqTYa4kTk
If you want to use the script, please, let me know leaving a comment below.
Trade wisely and good luck out there.
Ágios + MMEste script é uma versão flexível de ágios e médias movéis. Além de alterar o comprimento da média ao que acha mais adequado, o usuário pode escolher livremente o ativo (criptos ou outros) e comparar o preço entre diferentes exchanges. Ainda é possível alterar livremente a conversão de moedas.
Arbitrage LoopArbitrage Loop is based on the Ichimoku Cloud ;
If the Green line is on top we are in a Bullish Loop
If the Red line is on top we are in a Bearish Loop
This Indicator is fixated on our 0 Line,our "One Price" where we are measuring the pace of the trend
So as the pace changes we can see the change and react accordingly.
We hope you enjoy this new Indicator.
Arbitrage Trade Team

Simple Spread Simple spread between two tickers. Click format to set inputs for tickers. ex: "COINBASE:BTC:USD"

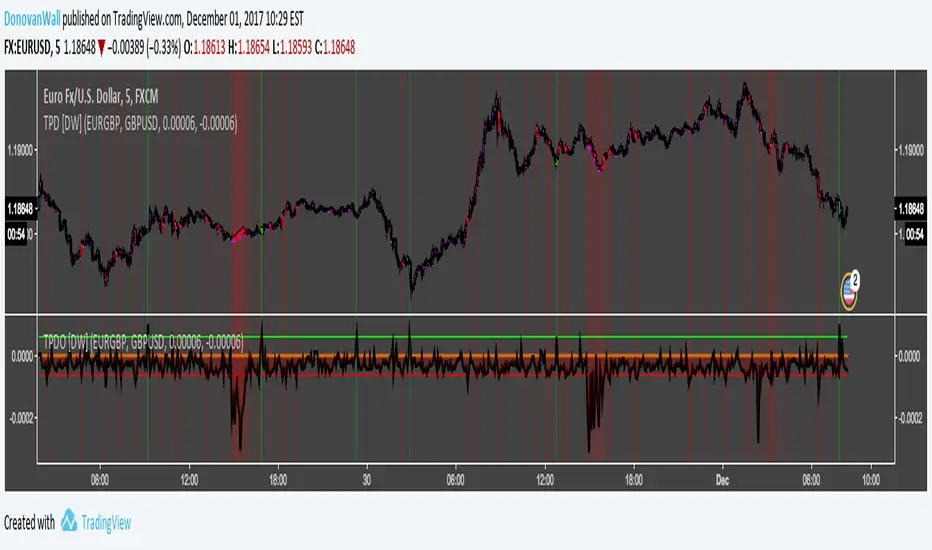
Triangular Price Divergence Oscillator [DW]This is an experimental study designed to show discrepancies in price using the formula S(a/$) = S(a/b)*S(b/$).
For example: EUR/USD = (EUR/GBP)(GBP/USD), USD/JPY = (USD/CHF)(CHF/JPY), etc.
NOTE: If the pairs you entered do not fit this criteria, the results are invalid.
Different Charting types deliver different divergences.
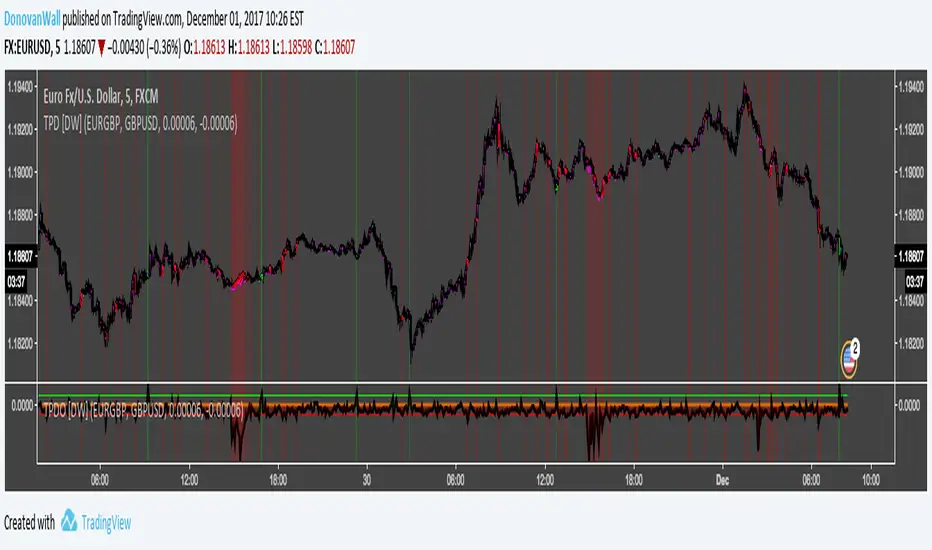
Triangular Price Divergence [DW]This is an experimental study designed to show discrepancies in price using the formula S(a/$) = S(a/b)*S(b/$).
For example: EUR/USD = (EUR/GBP)(GBP/USD), USD/JPY = (USD/CHF)(CHF/JPY), etc.
NOTE: If the pairs you entered do not fit this criteria, the results are invalid.
Different Charting types deliver different divergences.
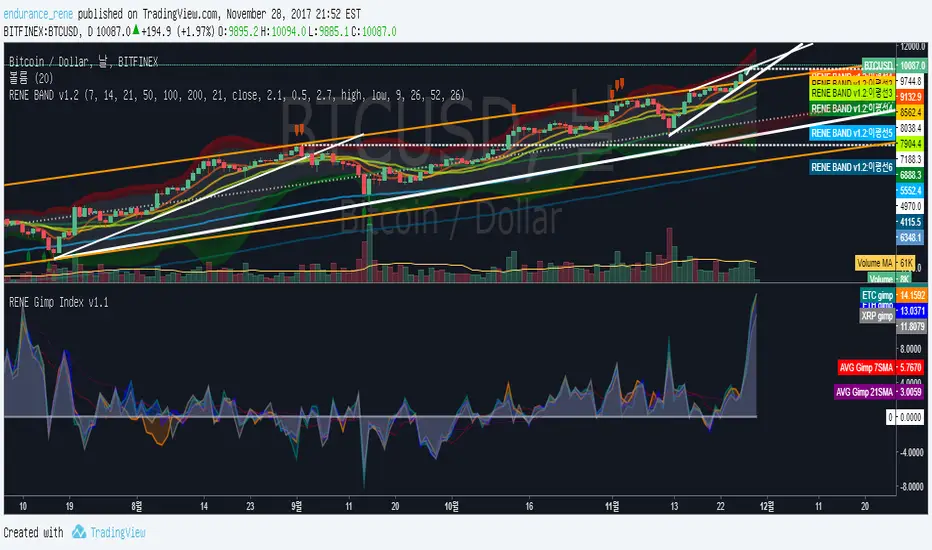
RENE Gimp Index v1.1RENE Gimp Index v1.1
1. 서 Intro
르네지표 2번째 RENE_Gimp Index v1.1을 공개합니다.
많은 분들의 요청이 있어 다음과 같은 지표를 공개하게 되었습니다.
2nd RENE indicator, RENE_Gimp Index v1.1 has released. (Gimp means 'Kimchi Premium')
Due to popular demand, I open this indicator to public.
2. 데이터 소스 Data source
4대 메이저 코인을 넣었으며, 데이터 소스는 다음과 같습니다
BTC : 빗썸 - 비트파이넥스
ETH : 코빗 - 비트파이넥스
ETC : 코빗 - 비트파이넥스
XRP : 코빗 - 비트파이넥스
(거래량기준으로 볼땐 빗썸을 사용하는게 더 적합하겠으나,
빗썸데이터가 비트에만 국한되어있어 부득이하게 다음과 같이 사용하였습니다.)
It shows four major coins, and the data sources are as follows
BTC: Bithumb - Bitfinex
ETH: Korbit - Bitfinex
ETC: Korbit - Bitfinex
XRP: Korbit - Bitfinex
(It's better to use bithumb data because of the high volume,
however the Bithumb data is limited to bitcoin only, I inevitably used Korbit data.
3. 계산법 Calculations
산식은 다음과 같습니다.
BTC 김프(%) = (BTC원화 - BTC미화*달러/원환율) / (BTC미화*달러/원환율) * 100
또한 7일 21일 단순이동평균선을 넣어 평균수치에 대해 인지할 수 있도록 하였습니다.
The formula is calculated as follows
BTC GIMP (%) = (BTC won-BTC US dollar * USD / WON) / (BTC US dollor * USD/ WON) * 100
I also added a simple moving average line on the 7th and 21st so that we can recognize the average figures.
4. 사용권한 Authorizations
개인적으로 김프를 보는데 사용하다가 르네밴드의 많은 성원에 감사하는 차원에서 무료로 공개하게 되었습니다.
따라서 별도의 권한부여는 필요하지 않으며
하단의 Add to favorite script 추가하신후, 지표- 즐겨찾기에서 사용하시면 됩니다.
혹은 퍼블릭 스크립트에서 "RENE Gimp Index"로 검색하실 수 있습니다.
I was personally used this indicator to see GIMP
and I decided to release to public for free to express my gratitude to many supports to the René Band.
Therefore, no authorization is required
Add to favorite script at the bottom and use it in Indicator - Favorites.
Or, you can search for "RENE Gimp Index" in public scripts.
5. 도움이 되었다면? Satisfied?
사용해 보시고 마음에 드신다면 RENE BAND v1.2 구매로 저에게도 도움을 주시면 감사하겠습니다.
(그림을 클릭하시면 해당 글로 이동합니다)
이미 많은 판매량을 기록하고 있으며 체험3일 이후 구매율이 높은것으로 보아 이용자분들은 만족하시고 계십니다.
이 지표사용으로 수익내는데 도움이 되셨으면 좋겠습니다.
If you would like to use it, please help me by purchasing RENE BAND v1.2.
(Click on the picture above to go to the Rene Band page)
It already sold a lot, and since the purchase rate is high after 3 days of experience, users are satisfied.
I hope this index will help you earn Profit.
글이 도움되셨다면 좋아요 눌러주시고
의견이 있으시다면 코멘트를 달아주세요. 피드백은 언제나 환영입니다 :)
If the article was helpful, Please press Favorite button below,
If you have any questions or thoughts, please leave a comment. Feedback is always welcome :)
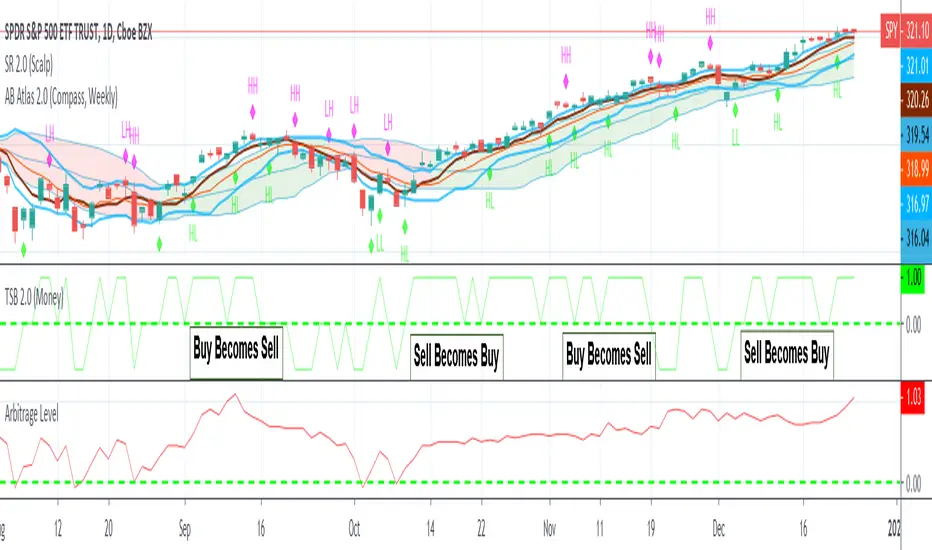
Arbitrage Level (Advance)This version of level is designed for stocks that have not existed long enough to qualify for our standard arbitrage level formula.
It also can be used on shorter time periods to show entries for day trades or swing trades.
Enjoy

Arbitrage LevelThe hardest question to answer in trading is "should I be in this trade"
With the help of Arbitrage Level, We can answer that question on whatever time frame you would like to trade.
How it works:
Just like a carpentry level, we want to know when there is more momentum up or down. So using momentum indicator (our red line) we can not only measure how fast it's moving but also in what direction.
So if the red line crosses over the dotted green line a new up trend should be beginning. If it crosses under it's time to go to cash.
Enjoy!
CryptoArbitrageBreakoutThis oscillator is a toolkit to explore arbitrage opportunities between crypto exchanges.
Each bar shows the amount of arbitrage (the price difference of a financial instrument) between the two exchanges.
Colored bars indicated that a sudden increase of arbitrage happend - see the chart for examples.

CryptoArbitrageDivergenceStudy that is related to my CryptoArbitrageDivergenceStrategy.
Buy-/ Sell signals are generated, when the price is rising on one exchange, while it is falling on the other exchange.
You can configure for how many candles the condition must be true, before a signal is generated.
The first exchange can be chosen by selecting the financial instrument of choice, the other exchange can be set in the properties dialog of my study/ indicator.
There are also alertconditions implemented, so you can receive buy-/ sell signals via pop-up, SMS or Email.

Arbitrage Advance BandIf you have truly mastered the Arbitrage Band, The Novice Band,and Intermediate Band, You are ready for The Advance Band.
This Band in conjunction with the other lower bands will help you plan longer term strategies
Less stress and way more profit with fewer decisions.
This Band will give you the winning edge to take your trading to new personal records for profit.

Arbitrage Novice BandNovice Level Bands Shows you a bigger picture of what is happening with the Arbitrage Band.
The Center Line of the Arbitrage Band Must STAY within the Novice Band

Arbitrage PulseArbitrage pulse is used to see the big picture.
The Bright Blue Line can not leave our Year Band (Dark Grey Band)
Whenever our money line (Lime green line) crosses that bright blue line good or bad things happen.
Typically our Major line( Orange Line) supports our money line but when it breaks support look out below!

ArbitrageArbitrage v1.0
This is a simple tool to indicate arbitrage opportunities between TWO markets. Base currency must be the same for both markets. Arbitrage signal and minimum market spread uses percentage, base currency or both. Spread input accepts increments as small as 0.00000001. Works best with smaller time frames.
I will develop this further if enough people show an interest.

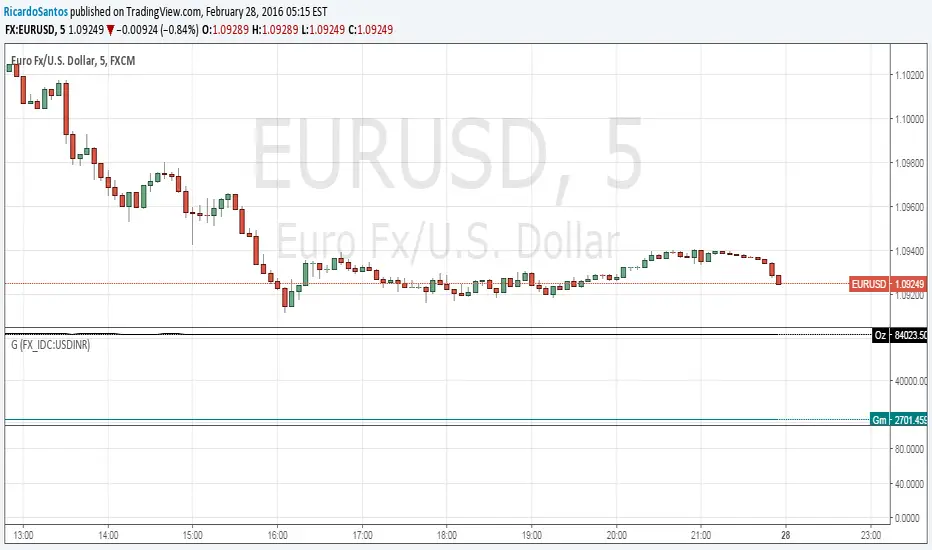
[RS]Gold to Custom Currency V0Request for: sankar2389
Gold conversion from dollar to INR and to grams.
StatArbPair trading is employed by professional traders to outperform the market. This script is a complete trading strategy where you can set your own parameters and the system will generate ready to trade signals. All you have to do is just execute profitable trades based on your own parameters.
