Position Avg Line + P/L Table - SightLine LabsPosition Avg – SLL is a lightweight position-tracking indicator designed to display a persistent average price level on the chart along with a real-time position summary table.
This script is non-trading and does not generate signals, entries, or exits. It is intended strictly for position awareness and visual reference.
What this indicator does:
Plots a persistent horizontal average price line (dashed by default)
Displays a live position statistics table showing:
Shares owned
Average price
Current price
Unrealized profit/loss in dollars
Unrealized profit/loss in percent
Updates automatically as price changes
Works across all timeframes
Does not depend on broker integration or strategy logic
Key features:
Average Price Line:
User-defined average price input
Persistent across the entire chart
Adjustable color and width
Visibility toggle
Position Table:
Six selectable table positions:
Top Left, Top Center, Top Right, Bottom Left, Bottom Center, Bottom Right
Adjustable text size (Tiny through Huge)
Optional table background fill
Optional inner grid lines
Optional outer frame border
Independent color control for:
Header background
Header text
Value text
Positive and negative P/L values
Chart Overlay Options:
Optional chart background tint
Does not modify the global chart theme
Inputs overview:
Position Settings:
Shares Owned
Average Price
Visual Settings:
Show or hide average price line
Line color and width
Table Settings:
Table position
Table text size
Color Settings:
Header background and text colors
Value text color
Positive and negative P/L colors
Optional table background, grid, and frame colors
How to use:
Add the indicator to a chart
Open the settings panel
Enter the number of shares and the average price
Adjust table position, size, and colors as desired
Use the average price line and table as a visual reference for trade and risk management
Notes and limitations:
This indicator does not place trades
It does not connect to any broker
All values are manually entered
Unrealized P/L is calculated using the chart’s current price
Commissions, fees, and slippage are not included
Disclaimer:
This script is provided for educational and informational purposes only. It does not constitute financial advice, investment recommendations, or trade signals. All trading decisions are the sole responsibility of the user.
Developed by SightLine Labs.
Averageprice

Average Price Calculator / VisualizerDCA Average Price Calculator - Visualize Your Breakeven & TP!
Ever wished you could visualize your trades and instantly see your average entry price right here on TradingView? Especially if you're a DCA (Dollar-Cost Averaging) trader like me, tracking multiple entries can be a hassle. You're constantly switching to a spreadsheet or calculator to figure out your breakeven and take-profit levels. Well I've developed this DCA Average Price Calculator to solve exactly that problem, bringing all your position planning directly onto your chart.
What It Does
This indicator is a interactive tool designed to calculate the weighted average price of up to 10 separate trade entries. It then plots your crucial breakeven (average price) and a customizable take-profit target directly on your chart, giving you a clear visual of your position.
Key Features
Up to 10 Order Entries: Plan complex DCA strategies with support for up to ten individual buys.
Flexible Size Input: Enter your position size in either USD Amount or Number of Shares/Contracts. The script is smart enough to know which one you're using.
Instant Average Price Calculation: Your weighted average price (your breakeven point) is calculated and plotted in real-time as a clean yellow line.
Customizable Take-Profit Target: Set your desired profit percentage and see your take-profit level instantly plotted as a green line.
Detailed On-Chart Labels: Each order you plot is marked with a detailed label showing the entry price, the number of shares purchased, and the total USD value of that entry.
Clean & Uncluttered UI: The main Average and TP labels are intelligently shifted to the right, ensuring they don't overlap with your entry markers, keeping your chart readable.
How to Use It - Simple Steps
Add the indicator to your chart.
Open the script's 'Settings' menu.
In the 'Take Profit' section, set your desired profit percentage (e.g., 1 for 1%).
Under the 'Orders' section, begin filling in your entries. For each 'Order #', enter the Price.
Next, enter the size. You can either fill in the 'Size (USD)' box OR the '/ Shares' box. Leave the one you're not using at 0.
As you add orders, the 'Avg' (yellow) and 'TP' (green) lines, along with the blue order labels, will automatically appear and adjust on your chart!
Who Is This For?
DCA Traders: This is the ultimate tool for you!
Position Traders: Keep track of scaling into a larger position over time.
Manual Backtesters: Quickly simulate and visualize how a series of buys would have played out.
Any Trader who wants a quick and easy way to calculate their average entry without leaving TradingView.
I built this tool to improve my own trading workflow, and I hope it helps you as much as it has helped me. If you find it useful, please consider giving it a 'Like' and feel free to leave any feedback or suggestions in the comments!
Happy trading

True Average PriceTrue Average Price
Overview
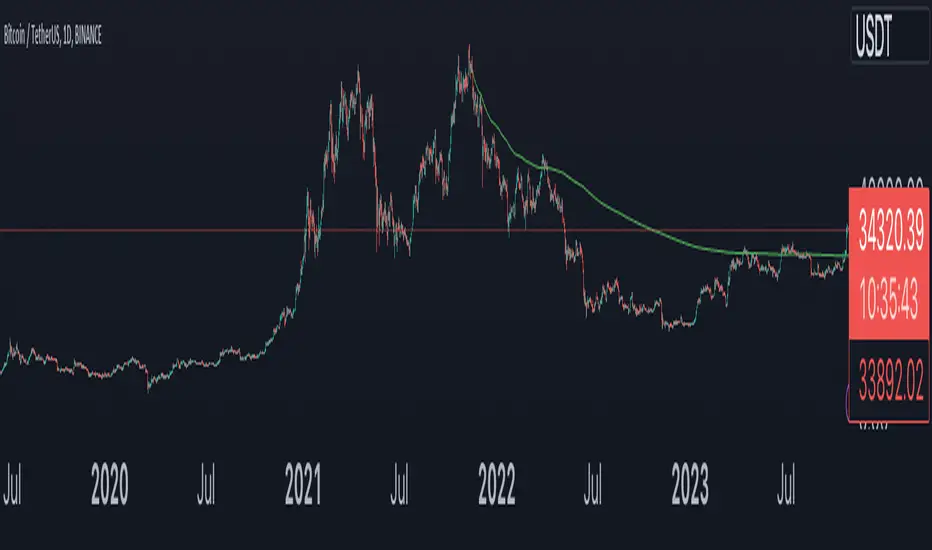
The indicator plots a single line representing the cumulative average closing price of any symbol you choose. It lets you project a long-term mean onto your active chart, which is useful when your favourite symbol offers limited history but you still want context from an index or data-rich feed.
How It Works
The script retrieves all available historical bars from the selected symbol, sums their closes, counts the bars, and divides the totals to compute the lifetime average. That value is projected onto the chart you are viewing so you can compare current price action to the broader historical mean.
Inputs
Use Symbol : Toggle on to select an alternate symbol; leave off to default to the current chart.
Symbol : Pick the data source used for the average when the toggle is enabled.
Line Color : Choose the display color of the average line.
Line Width : Adjust the thickness of the plotted line.
Usage Tips
Apply the indicator to exchanges with shallow history while sourcing the average from a complete index (e.g., INDEX:BTCUSD for crypto pairs).
Experiment with different symbols to understand how alternative data feeds influence the baseline level.
Disclaimer
This indicator is designed as a technical analysis tool and should be used in conjunction with other forms of analysis and proper risk management.
Past performance does not guarantee future results, and traders should thoroughly test any strategy before implementing it with real capital.

Anchored Average Price by Atilla Yurtseven (AAP)Anchored Average Price indicator is designed to pinpoint a specific date and price in a given financial instrument's price chart. Once anchored to the desired date and price level, the script calculates and displays the average price from that anchor point to the current day.
Features
Customizable Source: Allows users to choose the source data for calculations. By default, it uses hlc3, which is the average of high, low, and close prices.
Start Date Input: The script includes a timestamp-based input that allows the user to specify the anchor date easily.
Customizable Color: Users can change the color of the plotted average line, adding an additional layer of customization to the visual representation.
Code Mechanics
Initialization: Declares the variables and arrays required for calculations and display. The array is used to store price data.
Condition Check: Only starts storing and calculating data if the chart's time is equal to or greater than the user-defined start date.
Data Storing: Once the condition is met, the script pushes the src price data into the array for future averaging.
Average Calculation: It calculates the average price of the values stored in the array.
Data Clearing: If the condition is not met, the array is cleared, and no average is plotted.
Plotting: The average price is plotted on the chart with the user-defined color.
By incorporating these features and mechanics, AAP provides traders and investors with a powerful tool for assessing average prices anchored to a specific date or swing.
Disclaimer:
This TradingView script is intended for educational and informational purposes only and should not be considered as investment or trading advice. Past performance is not indicative of future results. Trading and investing carry a high level of risk, and you should consult with a qualified financial advisor before making any financial decisions. The creator of this script, Atilla Yurtseven, is not responsible for any losses or damages incurred as a result of using this script.
Trade smart, stay safe
Atilla Yurtseven
LNL Keltner CandlesLNL Keltner Candles
This indicator plots mean reversion (reversal) arrows with custom painted candles based on the price touch or close above or below keltner channel limits (upper & lower bands). This study was created primarily for swing trading & higher time frames such as daily and weekly. Lower time frames might result in more false signals.
Mean Reversal Arrows:
1. Reversal Arrow Up - If the price drops below the lower band extremes, reversal up is the trigger for a bullish mean reversion.
2. Reversal Arrow Down - Once the price reach the higher band extremes, reversal down is the trigger for a bearish mean reversion.
The Concept of Mean Reversion:
There are just two types of moves in any market: The market is either expanding from the mean or retracing back to the mean. These reversions & epxansions are happening across all types of markets. The goal of this study is to catch the powerful mean reversion from extremes back to the mean. Once the candles light up green / red, it is time to look for the reversal (purple) arrow which triggers the mean reversion setup. Mean reversion is not about catching the next big swing turn to new highs or lows. It is all about the base hits = the mean. So the target here is always the average price. The idea here is to catch the average market ebbs & flows, not the next home run.
What Do I Mean by Mean?
Mean is usually the average price from the last 20-30 bars. Basically something like a 20 MA or Keltner Channel or Bollinger Band midline are really good visual representators of the mean (average price).
Hope it helps.
