Pi Toolkit – MAs & Volatility Bands (Label v6 Clean)learning how to code, trying to see if Pi will unlock the secrets of the market!
see if it works for anyone!
thanks again
Bolinger

Bollinger Band + Mid BandBollinger Band + Mid Band
This indicator combines the classic Bollinger Bands with enhanced customization options, allowing traders to fine-tune the settings according to their specific strategies.
Key Features:
Moving Average Flexibility: Choose between Simple Moving Average (SMA), Exponential Moving Average (EMA), or Weighted Moving Average (WMA) as the central basis for the Bollinger Bands. This flexibility allows you to align the indicator with your preferred method of trend analysis.
Dual Band Deviation: The indicator includes two sets of upper and lower bands based on different standard deviation multipliers. This helps you analyze both the tightness of price action and potential breakout zones.
Customizable Colors: The mid-band, upper bands, and lower bands can be fully customized in terms of color, allowing you to personalize the visual representation of the indicator on your charts.
Dynamic Transparency: The space between the outer Bollinger Bands can be filled with a customizable transparent color, making it easy to visualize price movements within the bands.
Alerts for Crossovers: Alerts are triggered whenever the price crosses above the upper band or below the lower band, giving you timely notifications of potential breakout or breakdown scenarios.
Overbought/Oversold Visualization: The background of the chart changes color when the price crosses above the upper band (indicating overbought conditions) or below the lower band (indicating oversold conditions), providing a visual cue to help you identify market extremes.
Labeling for Significant Events: Labels appear on the chart whenever the price crosses the upper or lower bands, helping you quickly identify key moments for further analysis.
This script is designed for traders who want to leverage Bollinger Bands in their technical analysis but require additional flexibility and customization options. Whether you're using it for trend analysis, volatility assessment, or identifying overbought and oversold conditions, this tool can be tailored to fit a wide variety of trading styles.
Usage:
Ideal for traders looking to enhance the standard Bollinger Bands with more dynamic and customizable features.
Suitable for any market, including stocks, forex, and cryptocurrencies.
Useful in identifying volatility squeezes, breakouts, and potential reversal points.

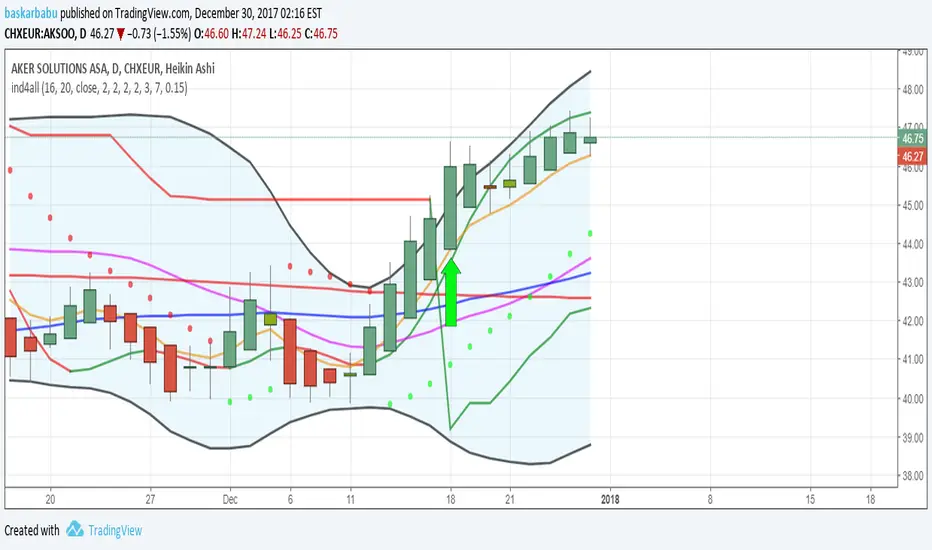
Bollinger BandsThis strategy is inspired from Power of Stock aka Subhasish Panni.
Target is minimum 1:3 when you get this setup right.
Buy when:
1) Low is greater than upper band of BB and next candle breaks high of that candle, SL is Low of previous candle which is has low above upper band.
2) High is lower than lower band of BB and next candle breaks high of that candle, SL is low of previous candle which has high lower than lower band.
Sell when:
1) Low is greater than upper band of BB and next candle breaks low of that candle, SL is high of previous candle which is has low above upper band.
2) High is lower than lower band of BB and next candle breaks high of that candle, SL is high of previous candle which has high lower than lower band.
Disclaimer: this setup will cause many small stoploss hit, you have to accept that loss but you will be profitable because of R:R.

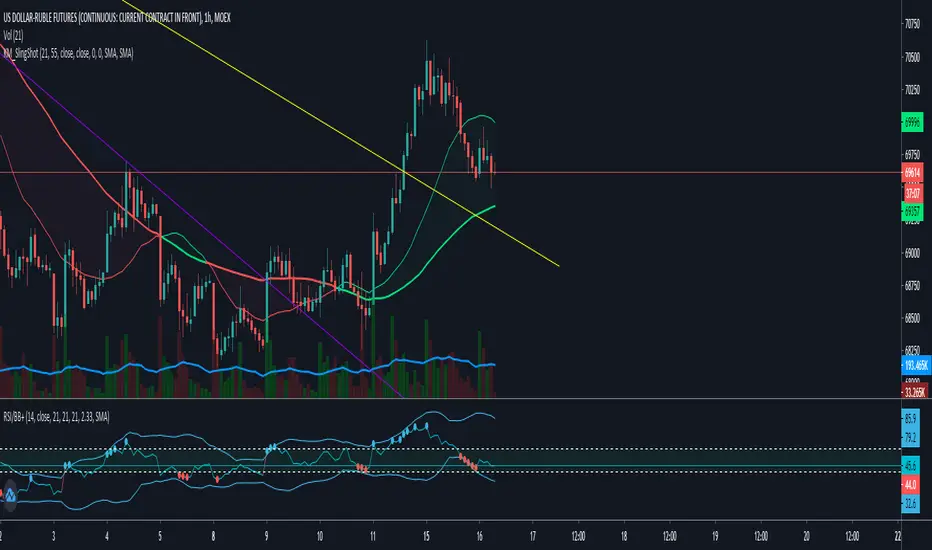
Trendlines Boll Ichi S1 by GammaprodI. How to use this indicator :
------------------------------
I.1. Set your teadingview theme to dark theme.
I.2. Gammaprod indicator is valid for forex, stock and but more valid for crypto.
I.3. Use three timeframe for more validation (choose between those, that fit to your trading style) :
- Timeframe 1m, 5m, and 15m for Scalping
- Timeframe 30m, 1h and 4h for Intraday
- Timeframe 4h, 1D and 1W for Swing Trading
I.4 Always use THREE INDICATORS FROM GAMMAPROD, those three indicators is back to back each other, by the way, I only made those three indicators only (for now) :
- Trendlines Boll Ichi S1 by Gammaprod
- MACD Volume S2 by Gammaprod
- Stoch RSI Divs Zone S2 by Gammaprod
============================================================================
II. How to setting :
--------------------
II.1. Trendlines Boll Ichi Crypto by Gammaprod
II.1.A. Support and Resistance
- Well if you familiar with this indicator you can add it, but recommended for Timeframe 30m or more
II.1.B. Trendlines Primary or Trendlines Secondary
- Timeframe 1m you DON'T NEED Trendlines Primary or Trendlines Secondary
- Timeframe 5m you DON'T NEED Trendlines Secondary, but you CAN ADD Trendlines Primary if you fell it helpful (for me, it is helpful to find where the candles start or the end trend or a consolidation or where the candles will surpass a resistance or a support).
- Timeframe 15m you DON'T NEED Trendlines Secondary, DEFENITELY add Trendlines Primary it will help to find where the candles stop or a consolidation or where the candles will surpass a resistance or a support).
- Timeframe 30m or more, DEFENITELY NEED BOTH Trendlines Primary and Secondary Trendlines, it will help to find where the candle stop or consolidation or where the candle will surpass a resistance or support).
II.1.C. Bollinger, Ichimoku Cloud and Lagging Span
- Please DON'T CHANGE IT at all, it's really helpful to know when and where to make an entry decesion or a trend or a consolidation, if you don't understand how to read it, you better to learn it first (on "how to read" section and "How to OPEN position" the section below)
II.2. Stoch RSI Divs Zone Crypto by Gammaprod (DON'T CHANGE IT)
II.3. MACD Volume Crypto by Gammaprod (DON'T CHANGE IT)
============================================================================
III. How to read :
------------------
III.1. Sell or Buy Priority :
III.1.A. Sell Priority
- Color background on macd and stoch rsi is pink or purple sell is the priority, (if you're not sure to buy, just wait until the best moment to sell)
III.1.B. Buy Priority
- Color background on macd and stoch rsi Teal or light green buy is the priority, (if you're not sure to sell, just wait until the best moment to buy)
III.1.C. Indecision / Golden Moment
- Color background on stoch rsi yellow is indecision / golden moment of reversal pattern (wait until it formed background only on Stoch RSI), please be careful at this moment.
III.2. Trend / Consolidation :
III.2.A. BULLISH trend
- When Stoch RSI and MACD have teal or light green background that's means BULLISH trend, better to confirm by the candle is above green cloud and lagging span (red line) is also above the candle.
III.2.B. BEARISH trend
- When Stoch RSI and MACD have the Pink or purple background that's means BEARISH trend, better to confirm by the candle is above purple cloud and lagging span (red line) is also below the candle.
III.2.C. CONSOLIDATION
- When Stoch RSI have the mix background that's means CONSOLIDATION, better to confirm by the candle is in or near to green / purple cloud and lagging span (red line) is also on the candle.
III.3. Special Mark
III.3.A. Ideal Bullish :
- Near line 20 and green / teal background = When Stoch RSI have the char R / H on lime color label, that's means divergence or hidden divergence for buy position, if you not see this label that's means just a standard confirmation for buy
III.3.B. Not an Ideal Bullish :
- Near line 80 and green / teal background = if this happens make sure you know what happen, it could be a false signal or bullish continual pattern
III.3.C. Ideal Bearish :
- Near line 80 and pink / purple background = When Stoch RSI have the char R / H on lime color label, that's means divergence or hidden divergence for buy position, if you not see this label that's means just a standard confirmation for sell position.
III.3.D. Not an Ideal Bearish:
- Near line 20 and pink / purple background = if this happens make sure you know what happen, it could be a false signal or bearish continual pattern
III.3.E. The Beginning of Reversal (from BEARISH to BULLISH) :
- When Stoch RSI line shaping GREEN position is near 20.
- MACD lines still PINK, position lines is UNDER the HISTOGRAM, but the HISTOGRAM start to SHAPE FALL PINK (light pink) and the BACKGROUND still PINK / PURPLE.
- Position CANDLES NEAR BLUE line, NEAR PURPLE CLOUD, and lagging span (red line) STILL ON the area candle. (it used to be confirmed with the golden moment).
III.3.F. The Beginning of Reversal (from BULLISH to BEARISH) :
- When Stoch RSI line shaping PINK position is near 80.
- MACD lines still GREEN, position lines is ABOVE the HISTOGRAM, but the HISTOGRAM start to SHAPE FALL GREEN (light green) and the BACKGROUND still TEAL / GREEN.
- Position CANDLES NEAR WHITE line, NEAR TEAL CLOUD, and lagging span (red line) STILL ON the area candle. (it used to be confirmed with the golden moment).
III.3.G. False Signals, or It could be a Golden Moment (better to see it on TF 15 or bigger):
- Near line 20 or 80 and yellow background = When Stoch RSI have the char R / H on color label, that's means divergence or hidden divergence for buy / sell position, if you not see this label that's means just a standard confirmation for buy / sell depends on where the Stoch RSI line if near 20 that's means buy, near 80 means sell
============================================================================
IV. How to OPEN position:
-------------------------
IV.1. Bullish
IV.1.A. Trendlines Boll Ichi S1 by Gammaprod
- The candles above the green cloud.
- Lagging span (red line) above the candles.
- then open buy near yellow line (the first option) / blue line (the second option) (always confirm the position with two other indicators below).
IV.1.B. MACD Volume S2 by Gammaprod
- Teal or Green background.
- The lines is shaped or shaping green.
- Better if at the green histogram.
IV.1.C. Stoch RSI Divs Zone S3 by Gammaprod
- Teal or Green background.
- The lines is shaping green.
- Better if on the bottom (at a range 20).
IV.2. Bearish
IV.2.A. Trendlines Boll Ichi S1 by Gammaprod
- The candles below the purple cloud.
- Lagging span (red line) below the candles.
- then open buy near yellow line (the first option) / white line (the second option) (always confirm the position with two other indicators below).
IV.2.B. MACD Volume S2 by Gammaprod
- Pink or purple background.
- The lines are shaped or shaping green.
- Better if at the pink histogram.
IV.2.C. Stoch RSI Divs Zone S3 by Gammaprod
- Pink or purple background.
- The lines are shaping pink.
- Better if the line on the top (at a range 80).
IV.3. Consolidation
IV.3.A. Trendlines Boll Ichi S1 by Gammaprod
- The candles on the cloud (green or purple).
- Lagging span (red line) on the candles.
- then open buy near the white or blue line (always confirm the position with two other indicators below).
IV.3.B. MACD Volume S2 by Gammaprod
- Changing the background.
- The line is near the middle line.
- Have small Histogram.
IV.3.C. Stoch RSI Divs Zone S3 by Gammaprod
- Mix background specially on a timeframe 15m or more.
- The line move fast up and down.
- Better if on the bottom or the top of the lines (at a range 20 or 80).
============================================================================
>> The secret ingredient is comparing the timeframe :
The example scalping (Timeframe 1m, 5m and 15m)
- TF 1m is for making an open position.
- TF 5m is for making a judgement of the trend market.
- TF 15m is to confirm that judgement from TF 5m, be careful if it not similar then it used to be a consolidation or the beginning of the reversal.
There's a lot a way to open the position than above information that i gave it to you, but consider there are a limit chars on this column, I hope it will help your trading and make a more profit on it.

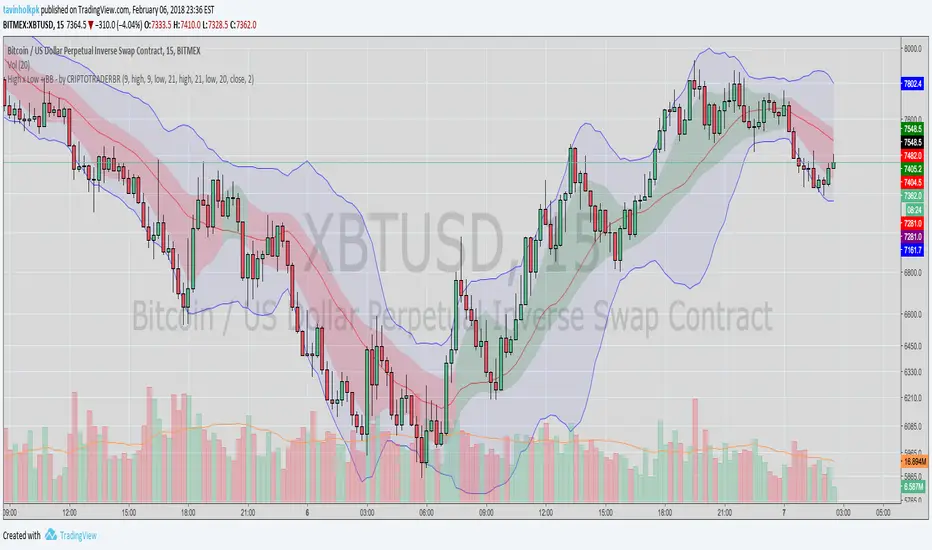
CDub's BolBandsUses a set of Bollinger Bands (user defined deviation, user defined deviation * 2) to determine possible entry set ups.
Signals are triggered when price crosses and closes, and crosses the first band (closest to the baseline MA) in the desired direction.
baseline can be your take profit 1 target
The inside band determines entry and can be used as a take profit 2 target (Opposite side of baseline)
The outside band is a suggested stop loss target (Same side of baseline) and can be used as a take profit 3 target (Opposite side of baseline)
Suggestions are welcome!
-CDub


Bollinger Bands MTF [LonesomeTheBlue]With this script you can follow Bollinger Bands for current and higher time frame together. Higher time frame is calculated by script.
if current period
1m => higher period=5m
3m => higher period=5m
5m => higher period=15m
15m => higher period=1h
30m => higher period=1h
45m => higher period=1h
1h => higher period=4h
2h => higher period=4h
3h => higher period=4h
4h => higher period=1day
1day => higher period=1week

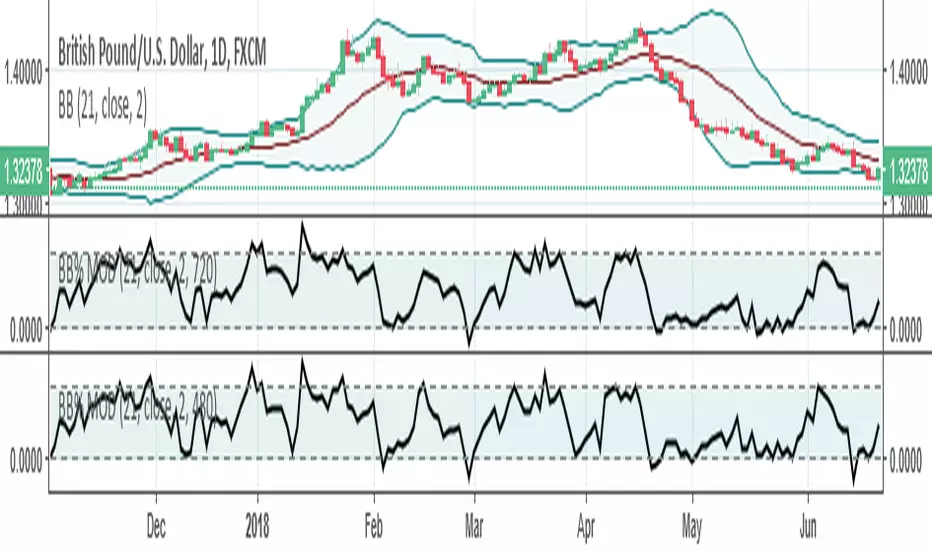
BB% MODHELLO EVERYONE !
I created this indicator to simplify my life in the study of the bollinger bands on a multi-time frame optics.
It works exactly like the bollinger bands %B you have of defaul inside tradingwiew;
BUT you can choose via an integrated button that I integrated if you see the indicator on the chart timeframe or a custom time frame, which can be changed via a window
Timeframe that you can choose from the window: 1M, 3M, 15M, 30M, 45M, 1H, 2H, 4H, 8H, 12H, D, 3D, W
For more info contact me in PM
I usually answer in 1/3 Day
BB% MODHELLO EVERYONE !
I created this indicator to simplify my life in the study of the bollinger bands on a multi-time frame optics.
It works exactly like the bollinger bands %B you have of defaul inside tradingwiew;
BUT you can choose via an integrated button that I integrated if you see the indicator on the chart timeframe or a custom time frame, which can be changed via a window
Timeframe that you can choose from the window: 1M, 3M, 15M, 30M, 45M, 1H, 2H, 4H, 8H, 12H, D, 3D, W .
For more info write me in PM.
I answer in 24/48 H

Doube BB and RSI IndicatorSimple but interesting combo with Bollinger Bands, RSI and Volumes cut off
Make sure to check my other scripts :)

RSI+ with Bollinger BandsRelative Strenght Index + SMA on RSI + Bollinger Bands on it - very good solution to see reversals and see lows and highs.
Use different timeframe.
StdDev is 2.17 by default to get 97% probability.
RSI + SMA с наложенными Bollinger Bands - прекрасное решение для поиска разворотных точек и аномального поведения цены.
Используйте разные таймфреймы одновременно.
StdDev = 2.17 по умолчанию для обеспечения попадания в диапазон в 97% случаев.
All indicators in one!All indicators in one!
Hull MA (2 colors) + Bollinger Bands + 6 EMA + 50 SMA + 200 SMA + Parabolic SAR + SUPER TREND (2 colors) + Doji signals (yellow)