Trendline + Bull/Bear Flag + EMA 9/21 Buy-Sell Signalseasy scalping and buy sell signals on 9-21 ema cross and trendline breakout
Breakoutsignal

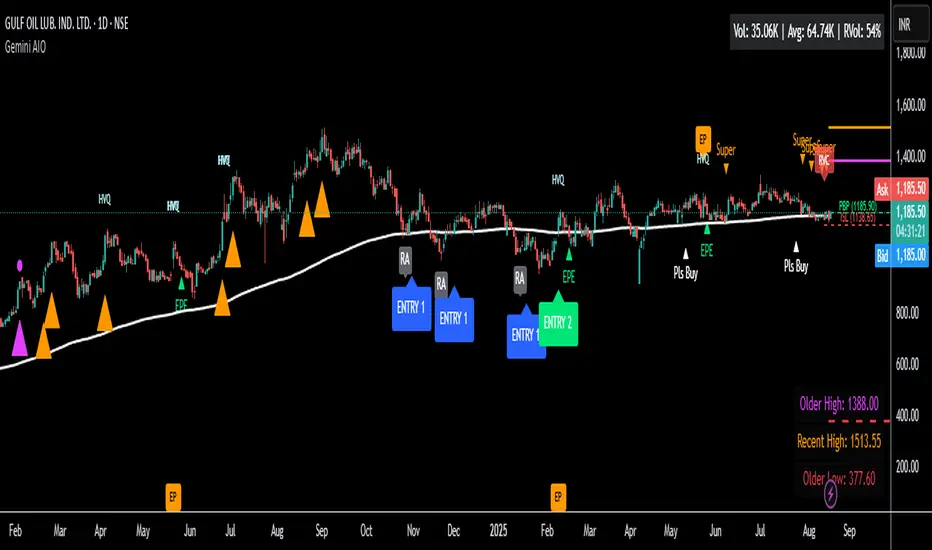
Gemini All-in-OneDescription
The Gemini AIO (All-in-One) is a comprehensive overlay indicator designed for swing and position traders. It merges three distinct and powerful trading strategies into a single, cohesive tool to identify high-probability setups in stocks that are in confirmed uptrends.
What the Indicator Does:
Combines Three Strategies: Integrates a multi-scanner breakout system, a mean-reversion model, and a multi-year breakout tool into one indicator.
Main Modules
Signals Module:
1. Features six unique scanner signals (CS1-CS6) to identify a variety of bullish consolidation patterns.
2. Includes a full trade management framework with RVC (Red Volume Candle), PBP (Post Breakout Pivot Entry), and ISL (Initial Stop Loss) levels.
3. Identifies powerful Episodic Pivot (EP) and EP Entry (EPE) signals for stocks showing exceptional strength.
Reversal Module:
1. A mean-reversion strategy that primarily uses Bollinger Bands to find oversold conditions.
2. Provides a three-stage signal process: RA (Reversal Setup), Entry 1, and Entry 2 to time entries from a potential bottom.
Multi-Year Breakout (MYBO) Module:
1. Automatically identifies and plots historical, multi-year resistance and support levels.
2. Generates a clear signal when the price breaks out above these significant long-term levels.
Advanced Alerts: Features a highly customizable alert system that can be timed to trigger either on the bar's close or at a specific time of day (e.g., 2:30 PM IST), allowing for end-of-day style notifications.
How to Best Use It:
This indicator is most powerful when used with a systematic, rules-based approach. The core principle is to use long-term moving averages to define the trend and then use the indicator's signals to time entries within that trend.
The Foundation (Trend Filter): The most important rule is to only consider long setups on stocks where the 150-day SMA is above the 200-day EMA, and the 150-day SMA is sloping upwards. This keeps you aligned with the primary uptrend.
Strategy 1: The Momentum Breakout (PBP Entry)
1. Confirm the stock meets the primary trend filter rules.
2. Wait for an AIO setup signal (Super, Pls Buy, etc.) to draw a PBP line.
3. Enter when the price crosses above the PBP line or wait for a pull back after the price has crossed the PBP line.
Strategy 2: The Mean Reversion (RA Entry)
1. Confirm the stock meets the primary trend filter rules.
2. Wait for an "RA" (Reversal Setup) signal to appear on the chart.
3. Enter on the "ENTRY 1" (Risky Entry) or "ENTRY 2" signal (Safer Entry) or wait for a pull back after "ENTRY 1" or "ENTRY 2" signal.
Strategy 3: Multi-Year Breakout (MYBO) :
1. A breakout triangle (orange or fuchsia) appears below the candle, signaling a close above the "Recent High" (Orange) or "Older High" (Fuchsia).
2. Recent High refers to the highest price the stock has reached in last 12 months. Breaking above the "Recent High" is a sign of strong current demand.
3. Older High refers to the highest price the stock reached in a more distant, historical period - the period between 5 years ago and 1 year ago. Breaking above the "Older High" is a sign of VERY strong demand as it has broken a historic high.
4. Wait for a breakout triangle to appear on the chart.
5. Enter on the high of the candle marked with a breakout triangle or wait for a pull back after that signal.
Customize Your View: Use the "Inputs" tab to enable/disable the modules you want to focus on and configure the alerts you want to receive. Use the "Style" tab to hide any visual elements you don't need to keep your chart clean.
Angle Market Structure [BigBeluga]🔵 OVERVIEW
Angle Market Structure is a smart pivot-based tool that dynamically adapts to price action by accelerating breakout and breakdown detection. It draws market structure levels based on pivot highs/lows and gradually adjusts those levels closer to price using an angle threshold. Upon breakout, the indicator projects deviation zones with labeled levels (+1, +2, +3 or −1, −2, −3) to track price extension beyond structure.
🔵 CONCEPTS
Adaptive Market Structure: Uses pivots to define structure levels, which dynamically angle closer to price over time to capture breakouts sooner.
Breakout Acceleration: Pivot high levels decrease and pivot low levels increase each bar using a user-defined angle (based on ATR), improving reactivity.
Deviation Zones: Once a breakout or breakdown occurs, 3 deviation levels are projected to show how far price extends beyond the breakout point.
Count Labels: Each successful structure break is numbered sequentially, giving traders insight into momentum and trend persistence.
Visual Clarity: The script uses colored pivot points, trend lines, and extension labels for easy structural interpretation.
🔵 FEATURES
Calculates pivot highs and lows using a customizable length.
Applies an angle modifier (ATR-based) to gradually pull levels closer to price.
Plots breakout and breakdown lines in distinct colors with automatic extension.
Shows deviation zones (+1, +2, +3 or −1, −2, −3) after breakout with customizable size.
Color-coded labels for trend break count (bullish or bearish).
Dynamic label sizing and theme-aware colors.
Smart label positioning to avoid chart clutter.
Built-in limit for deviation zones to maintain clarity and performance.
🔵 HOW TO USE
Use pivot-based market structure to identify breakout and breakdown zones.
Watch for crossover (up) or crossunder (down) events as trend continuation or reversal signals.
Observe +1/+2/+3 or -1/-2/-3 levels for overextension opportunities or trailing stop ideas.
Use breakout count as a proxy for trend strength—multiple counts suggest momentum.
Combine with volume or order flow tools for higher confidence entries at breakout points.
Adjust the angle setting to fine-tune sensitivity based on market volatility.
🔵 CONCLUSION
Angle Market Structure enhances traditional pivot-based analysis by introducing breakout acceleration and structured deviation tracking. It’s a powerful tool for traders seeking a cleaner, faster read on market structure and momentum strength—especially during impulsive price moves or structural transitions.

tuasab_indytuasab_indy is a breakout strategy indicator that uses Bollinger Bands to identify support (lower band) and resistance (upper band). It shows dotted lines as breakout outlines to visually mark breakout zones.
It uses emoji signals to indicate swing breakouts:
🚀 Rocket signals a breakout below the swing low — prepare to enter a sell position.
🔨 Hammer signals a breakout above the swing high — prepare to enter a buy position.
The breakout percentage threshold is set by default at 30%, which can be increased to adjust sensitivity. The indicator supports layered entry orders at buy1 and buy2 lines for buying, as well as sell1 and sell2 lines for selling. It can also trigger alerts whenever a breakout occurs.

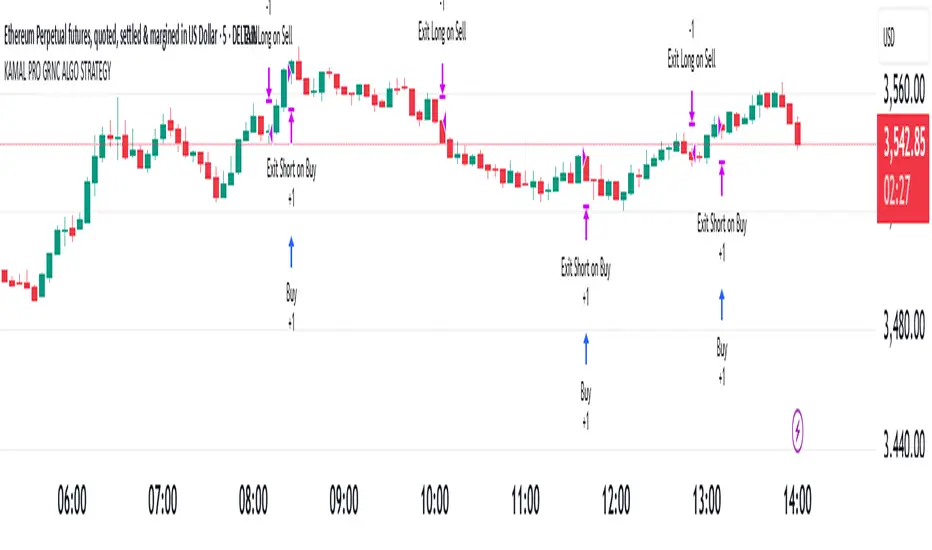
KAMAL PRO GRNC ALGO STRATEGY candles breakout strategy for all index and commodities and forex and crypto trade.and also use for algo trade
Imbalance Scanner [Afnan]Identify the most aggressive candles on any chart—instantly or historically—and act before the crowd notices.
🔥 What It Does
Four-tier detection system: 🟡 Low → 🟠 Mild → 🔴 Explosive → 💥 Super Explosive
Smart filtering: Detects abnormal candle bodies and ranges that signal market imbalances
Volume confirmation: Optional filter ensures moves are backed by institutional-level activity
Directional control: Choose All, Bullish, or Bearish candles to match your trading bias
Pine Scanner optimized: Scan entire watchlists in real-time or historically.
Clean interface: Minimal emoji labels with background highlighting—no chart clutter
⚡ Quick Setup
1. Load & Configure: Add to chart and open indicator settings
2. Set Detection Level: Choose minimum imbalance strength (Low/Mild/Explosive/Super)
3. Optional Volume Filter: Enable for higher-quality signals with volume confirmation
4. Pine Scanner Setup: Set "Days Back" (0 for live scanning, >0 for historical analysis)
5. Create Alerts: Pre-built alert conditions for each explosive level
🎯 Primary Use Cases
Smart Money Detection: Spot where big players are active through explosive price movements
Market Inefficiencies: Find supply/demand imbalances as they develop
Breakout Confirmation: Validate genuine breakouts using explosive candle analysis
Identify momentum acceleration points for optimal timing
📊 Pine Scanner Ready
Fully compatible with TradingView's Pine Scanner for real-time watchlist monitoring and historical analysis.
💼 Professional Edge
Built by @AfnanTAjuddin for active traders who need reliable, fast imbalance detection across any market or timeframe. Perfect for day trading, swing trading, and institutional activity tracking.

High Volume Buyers/Sellers+High Volume Buyers/Sellers+
This indicator helps traders spot bars where unusually high or extreme volume occurs, indicating strong buying or selling pressure.
How it works:
Calculates a volume moving average (SMA) over a user-defined period.
Marks bars where the current volume exceeds:
High Volume Multiplier → small green circle (bullish) or red circle (bearish).
Extreme Volume Multiplier → small green up-triangle (bullish) or red down-triangle (bearish).
Settings:
Volume MA Period → Number of bars used to calculate the average volume.
High Volume Multiplier → Threshold to define high volume.
Extreme Volume Multiplier → Threshold to define extreme volume.
Show Extreme Volume Signals → Option to enable or disable extreme volume markers.
Usage tips:
Apply this indicator on a clean chart to visually highlight momentum bursts or exhaustion points.
It works well for both intraday and swing trading strategies where volume confirmation matters.
⚠ Note: This script only displays on-chart markers and does not plot any lines or indicators.

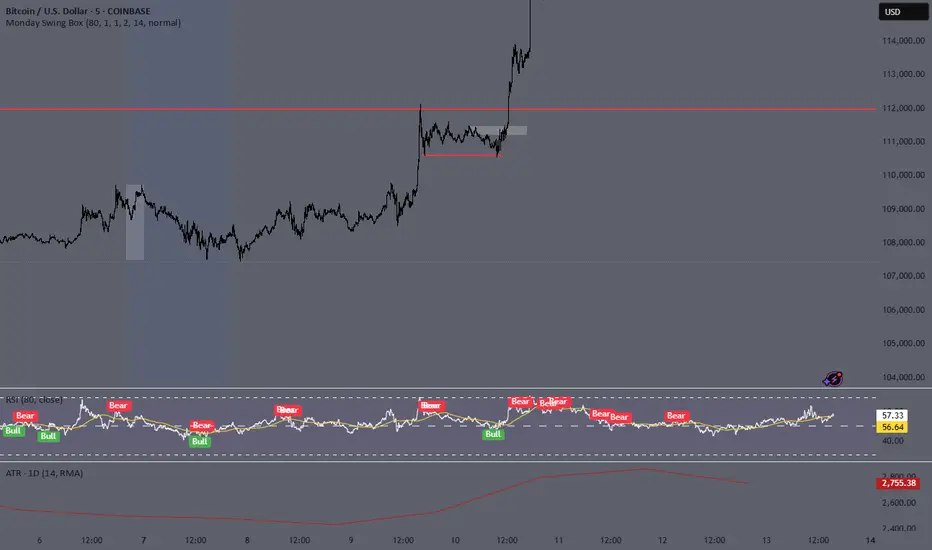
Monday Swing Box# Monday Swing Box Indicator - Trading Applications
This "Monday Swing Box" indicator can be very useful in trading for several strategic reasons:
## 1. **"Monday Effect" Analysis**
* **Concept**: Mondays often have particular characteristics in the markets (opening gaps, weekend catch-up, different volumes)
* **Utility**: Allows visualization and quantification of these Monday-specific movements
* **Application**: Helps identify recurring patterns in your strategy
## 2. **Relative Volatility Measurement with ATR**
* **The ATR percentage tells you**:
* **< 50%**: Low volatility Monday (possible consolidation)
* **50-100%**: Normal volatility
* **> 100%**: Very volatile Monday (important event, potential breakout)
* **Advantage**: Contextualizes the movement relative to historical volatility
## 3. **Practical Trading Applications**
### **For Day Trading**:
* **Entry**: A Monday with >150% ATR may signal a strong movement to follow
* **Stop Loss**: Adjust stop sizes according to Monday's volatility
* **Targets**: Calibrate targets according to the movement's magnitude
### **For Swing Trading**:
* **Support/Resistance**: Monday's high/low often become key levels
* **Breakout**: Breaking above/below Monday's box may signal continuation
* **Retracement**: Return to Monday's box = support/resistance zone
### **For Risk Management**:
* **Sizing**: Adapt position sizes according to measured volatility
* **Timing**: Avoid trading abnormally volatile Mondays if you prefer stability
## 4. **Specific Possible Strategies**
### **"Monday Breakout"**:
* Wait for a break above/below Monday's box
* Enter in the direction of the breakout
* Stop at the other end of the box
### **"Monday Reversal"**:
* If Monday shows >200% ATR, look for a reversal
* The box becomes a resistance/support zone
### **"Monday Range"**:
* Trade bounces off the box limits
* Particularly effective if ATR % is normal (50-100%)
## 5. **Visualization Advantages**
* **Historical**: See past patterns across multiple Mondays
* **Comparison**: Compare current volatility to previous Mondays
* **Anticipation**: Prepare your strategy according to the type of Monday observed
## 6. **Limitations to Consider**
* Monday patterns can vary according to markets and periods
* Don't trade solely on this indicator, but use it as a complement
* Consider macroeconomic context and news
This indicator is therefore particularly useful for traders who want to exploit Monday's specificities and have an objective measure of this day's relative volatility compared to normal market conditions.
Bullish Combo Scan by TLP📈 Bullish Combo Scan by TLP
This indicator scans for high-probability bullish breakout setups based on price action and volume strength, and optionally provides position sizing based on your risk management preferences.
🔍 Key Features:
$ Breakout Detection
Identifies stocks with a $0.90 or more price gain from the open, supported by strong volume and price structure.
% Breakout Detection
Flags stocks moving 4% or more from the previous close, also requiring momentum confirmation and volume above 100,000.
Momentum Filter
Breakouts are filtered to avoid extended moves by requiring low price movement between the previous two candles.
Volume & Price Conditions
Ensures breakouts are supported by liquidity (volume > 100,000) and minimum price (≥ $3) to reduce noise.
Position Size Calculator (Optional)
Displays position size based on your account value, risk percentage, and stop loss derived from a configurable previous candle’s low.
Screener-Ready Output
Includes a numeric plot to support TradingView's built-in screener, showing 1 for $ breakout and 2 for % breakout.
⚙️ Customizable Inputs:
Toggle $ breakout or % breakout conditions
Set your account size and risk per trade
Choose which candle’s low to use for stop loss calculation
✅ Best Used For:
Intraday or swing traders looking for fresh breakout setups
Traders who prefer a rules-based, volume-confirmed breakout scan
Screening large watchlists with custom logic for alerts and automation

Trendline Breakouts With Volume Strength [TradeDots]Trendline Breakouts With Volume Strength is an innovative indicator designed to identify potential market turning points using pivot-based trendline detection and volume confirmation. By merging dynamic trendline analysis with multi-tiered volume filters, this tool helps traders quickly spot breakouts or breakdowns that may signal significant shifts in price action.
📝 HOW IT WORKS
1. Pivot-Based Trendline Detection
The script automatically scans for recent pivot highs and lows over a user-defined lookback period.
When it finds higher pivot lows, it plots green uptrend lines; when it finds lower pivot highs, it plots red downtrend lines.
These dynamic lines update as new pivots form, providing continuously refreshed trend guidance.
2. Volume Ratio Analysis
A moving average of volume is compared against the current bar’s volume to calculate a ratio (e.g., 1.5×, 2×).
Higher ratios suggest above-average volume, often interpreted as stronger participation.
The script applies color-coded cues to highlight the intensity of volume surges.
3. Breakout & Breakdown Detection
Each trendline is monitored for a defined “break threshold,” which helps avoid minor penetrations that can trigger premature signals.
When price closes beyond a threshold below an uptrend line, the indicator labels it a “BREAKDOWN.” If it closes above a threshold on a downtrend line, it labels it a “BREAKOUT.”
Volume surges accompanying these breaks are highlighted with contextual emojis and distinct color gradients for quick visual reference.
4. Trend Direction Table
A small on-chart table provides a snapshot of the current market trend—Uptrend, Downtrend, or Sideways—based on a simple moving average slope and the number of active uptrend or downtrend lines.
This table also displays quick stats on how many lines are actively tracked, helping traders assess the broader market posture at a glance.
🛠️ HOW TO USE
1. Choose a Timeframe
This script works on multiple timeframes. Intraday traders can monitor minute or hourly charts for frequent pivot updates, while swing and position traders may prefer daily or weekly intervals to reduce noise.
2. Observe Trendlines & Labels
Watch for newly drawn green/red lines connecting pivots.
When you see a “BREAKOUT” or “BREAKDOWN” label, confirm whether volume was abnormally high based on the ratio or color-coded bars.
3. Consult the Trend Table
Use the table in the bottom-right corner to quickly check if the market is trending or range-bound.
Look at the count of active uptrend vs. downtrend lines to gauge broader sentiment.
4. Employ Additional Analysis
Combine these signals with other tools (e.g., candlestick patterns, oscillators, or fundamental analysis).
Validate potential breakouts using standard techniques like retests or support/resistance checks.
❗️LIMITATIONS
Delayed Pivots: Trendlines only adjust once new pivot highs or lows form, which can introduce a slight lag in highly volatile environments.
Choppy Markets: Rapid, back-and-forth price moves may produce conflicting trendline signals and frequent breakouts/breakdowns.
Volume Data Reliability: Gaps in volume data or unusual market conditions (holidays, low-liquidity sessions) can skew ratio readings.
RISK DISCLAIMER
Trading any financial instrument involves substantial risk, and this indicator does not guarantee profits or prevent losses. All signals and visual cues are for educational and informational purposes only; past performance does not assure future outcomes. You retain full responsibility for your trading decisions, including proper risk management, position sizing, and the use of additional confirmation methods. Always consider the possibility of losing some or all of your original investment.

Breakout Core | by Solid#SignalsBreakout Core | by SolidSignals
General Overview
Breakout Core is an advanced breakout trading strategy designed for Bitcoin (BTC). Optimized for the unique market dynamics following the launch of BlackRock’s Spot ETFs in January 2024, it adapts to Bitcoin’s post-ETF volatility patterns. The strategy’s core strength lies in its low drawdown, achieved through a proprietary time-based signal-filtering algorithm that sets it apart from traditional breakout strategies. Breakout Core offers traders a reliable tool for navigating Bitcoin’s evolving market with reduced risk and enhanced precision.
Mechanisms
Breakout Core combines well-known indicators BB, EMAs, MAs with custom-tuned parameters to improve signal accuracy. Its unique feature is a proprietary time-filter algorithm that prioritizes high-probability breakout signals during specific high-volatility trading hours, derived from market analysis post-ETF launch. This algorithm minimizes false positives, particularly in volatile conditions, by integrating time-based volatility patterns with price action. The result is a robust strategy that optimizes entry and exit points for Bitcoin trading.
Objectives
Breakout Core aims to provide steady returns with controlled risk by targeting Bitcoin’s breakout patterns in the post-ETF market. Its low drawdown, achieved through extensive optimization and proprietary logic, makes it suitable for leverage trading (e.g., 3–5x leverage), balancing growth with capital protection. Tailored for BTC, the strategy equips traders with a precise tool to navigate Bitcoin’s transformed market dynamics.
Backtesting and Parameter Notes
Backtesting was performed using a $10,000 USDT account, risking up to 10% of equity per trade, including 0.06% commission fees and 2-tick slippage, aligned with standard exchange conditions. The strategy report details backtesting results from the launch of BlackRock’s Spot ETFs. These settings are the script’s defaults, ensuring transparency. Traders are encouraged to verify results using TradingView’s Deep Backtest feature to adapt to current market conditions.
Please note: Past performance does not guarantee future results.
Chart and Usage
The chart is clean and intuitive, displaying only Breakout Core’s buy and sell signals for easy interpretation. Parameters are pre-optimized for immediate use, with adjustable Take Profit (TP) and Stop Loss (SL) levels. Traders should validate custom settings via TradingView’s backtesting tools to ensure market compatibility. An integrated Alarm Panel supports API connectivity, providing clear Entry/Exit commands for Long and Short positions, enabling seamless automated trading workflows.
Originality Statement
Breakout Core is an original strategy developed by SolidSignals, leveraging standard indicators (Bollinger Bands, EMAs, MAs) combined with a proprietary time-filter algorithm. No third-party or open-source code is used, ensuring full compliance with TradingView’s originality requirements. The time-filter mechanism, based on post-ETF volatility analysis, distinguishes this strategy from conventional breakout approaches.
Important Disclaimer
Market conditions evolve continuously, and past performance is not indicative of future results. Traders are responsible for validating the strategy’s settings and performance under current market conditions before use.

Multi Year BreakoutWhat the Script Does (Simple Summary)
Name: It's called "Multi Year Breakout" (or MYBO for short) and shows up right on your main price chart.
Settings You Control: You can easily change settings like:
How many months or years back the script should look to find the important old highest price and lowest price.
How many months back it should look for the recent highest price.
Whether you want to see the lines drawn on the chart for these highs and lows.
The color, thickness, and style (solid, dashed, dotted) of the lines.
An optional info box showing the price levels, where it appears, and the text size.
What it Calculates: It finds the exact price for the highest high in the "older" period you set, the highest high in the "recent" period, and the lowest low in the "older" period.
What it Draws:
It draws horizontal lines on your chart at these key price levels. Think of the high lines (Fuchsia for older, Orange for recent) as price ceilings (resistance).
It draws small triangle arrows below the price bars when a potential breakout happens.
The Breakout Signal:
It checks if today's closing price moved above the highest ceiling (either the older Fuchsia line or the recent Orange line, whichever was higher yesterday).
If it did, you get an arrow:
Fuchsia Arrow: Price broke above the older high ceiling (often more important).
Orange Arrow: Price broke above the recent high ceiling.
Alerts:
The script creates alert conditions. If you want a notification (popup, email, etc.), you MUST manually create an alert in TradingView's alert menu, choosing this script and selecting either the "Fuchsia Breakout" or "Orange Breakout" condition.
Best Way to Use It (Simple Guide)
Goal: Use this script to help find stocks that are breaking through significant past price ceilings. This might signal the start of a new upward move.
Best Charts: Works best on Daily or Weekly charts to see the bigger picture price action over months and years.
Setup:
Add the script to your preferred chart.
Adjust the settings (gear icon ⚙️) to define your "older" and "recent" periods (e.g., 60 months back for the older start, 12 months back for the older end / recent end).
Choose which lines you want to see (usually the Fuchsia and Orange high lines are most useful).
Reading the Chart:
Fuchsia Line: A major price level that stopped the price going higher in the more distant past. Breaking this is often significant.
Orange Line: The highest price reached more recently. Breaking this shows current momentum.
Arrows: An arrow appears when the price closes above the relevant high line (based on yesterday's level). The color tells you if it cleared the older (Fuchsia) or recent (Orange) hurdle.
Very Important - Use Other Tools Too! Don't trade based only on an arrow. Always look for extra confirmation:
Volume: Was there a lot more trading activity than usual on the breakout day? (High volume is a good sign).
Chart Pattern: Was the stock building up energy in a pattern before breaking out?
Market Direction: Is the overall stock market also looking positive?
Set Up Alerts (If Wanted): If you want TradingView to notify you, go to the 'Alert' menu, select this script (MYBO), choose the "Fuchsia Breakout" or "Orange Breakout" condition, and set how you want to be notified.
Manage Risk: Sometimes breakouts look good but then fail. Always decide before you trade how much you're willing to risk and where you'll exit if the price falls back down (use a stop-loss).
Think of this script as a signal that says "Hey, look at this stock, it just cleared an important level!". It's your cue to investigate further using other analysis before making any trading decisions.

NR4 & NR7 with Breakouts [LuxAlgo]NR4 & NR7 with Breakouts is a simple indicator that utilizes the NR4 and NR7 candle patterns to display candle ranges and signals from range breakouts.
🔶 USAGE
The Narrow Range Patterns are candle formations determined by the last candle having a narrower (high-low) range than the previous number. This indicator showcases the 2 most recognized Narrow Range Patterns, which are the 4 and 7 bar variants (NR4 and NR7).
These patterns, introduced by Toby Crabel, are thought to provide insight for potential market breakouts by identifying periods of low volatility indicated by a candle with a small range. This is due to the idea that markets often move from periods of low volatility (contraction) to high volatility (expansion), and the NR4 and NR7 patterns help spot these transitions.
By utilizing these patterns, traders are better able to anticipate and respond to market shifts for better decision-making and risk management.
NOTE: These patterns have traditionally been studied on the Daily Timeframe Chart. This indicator allows the user to select a timeframe to generate these patterns from. It is suggested to be mindful of this when considering these patterns.
In this indicator, on the bar after the pattern is detected, the Narrow Range Bar will be highlighted with a zone, and lines displaying the range will extend from it. These ranges are helpful for providing levels to set limit orders and for managing risk.
Users are able to adjust which pattern they want visualized on their chart, please note;
All NR7s are NR4s but not all NR4s are NR7s.
Because of this, you will notice that when selecting "NR4" to display, the colors will change, but the detected ranges will not change.
🔹 Signals
When a Narrow Range Bar is detected, the script will wait for the price to close outside of the Range, then a signal will fire indicating the direction of exit. The signals are produced from the last NR4 or NR7 and will have the potential to fire from that range until a new NR4 or NR7 is detected.
After a signal fires, the logic goes into a "reset" period where it will wait for the price to reach the Range Mean before firing another signal.
These signals can be anticipated by considering the underlying logic and watching price approach the range extremities, and can be improved by utilizing other market information for confluence.
🔶 SETTINGS
Timeframe: Choose which timeframe to identify the NR4 and NR7 Pattern on. This must be Higher than the chart timeframe.
Pattern Type: Choose which (or all) patterns to display.

Trend Trading IndicatorThis trend trading indicator uses multiple different custom formulas to identify market trends as well as identify when the market is moving sideways. It has a master trend that will show you the trend using the color of the candles and then there are multiple different types of entry and confluence signals that will appear as different chart shapes above or below the candles to inform you about when to enter a trade and how strong the trend is so you know whether to hold a position longer or get out. There is also a panel at the bottom of the chart that shows you the trend strength for 5 different timeframes so you can easily identify the short and long term trends and scan through charts quickly to find markets with the strongest trends.
The indicator can be customized to fit your trading style by adjusting the timeframes for the master trend, which timeframes affect signals, turning on or off the various entry & confluence signals, turning on or off ranging market filters and more. It can be adjusted to react quickly for intraday trading or use long timeframes for swing trading or only trading when the market is in a strong long term trend.
The indicator also has a built in trend direction value that can be sent to other indicators to be used as a trend filter as well by setting the source value on an external indicator to use the trend direction value from this indicator. This is useful for preventing signals from coming in on other indicators when they go against the trend that this indicator has identified according to the settings it is configured with.
How To Use This Indicator Properly
This indicator is designed to only give signals when the market is trending and filter out the sideways price action for you. Due to this, depending on the timeframe settings you use, there may be extended periods where there are no signals because the market is going sideways. You can adjust your timeframe settings to react faster or slower by lowering the timeframes used and turning off some of the higher timeframes or use all of the timeframes available and only get signals when the market is in a strong long term trend for the safest trades.
The indicator uses a master trend that needs to show a trend before any other confluence signals can come in. The master trend will show up by coloring the candles blue when the trend is bullish or orange when the trend is bearish according to the settings you have chosen. When the market is not trending, the candles will be colored grey. This helps to keep you out of trades when the market is going sideways. You will only be able to see the master trend by using the colored candles though, so make sure to turn the chart’s candle coloring off so it doesn’t override the indicator candle coloring.
Once a trend has been established, then other signals will begin to show up if the trend is strong and various parameters are met. The indicator includes the following types of signals:
Master Trend Signals
Strong Trend Buy & Sell Signals
Pullback During Strong Trend Signals
Strong All Timeframe Trend Signals
Trend Strength Score Signals
The indicator also has multiple filters you can use to customize the master trend to allow more or less signals to come in. The more filters you have on, the better and more likely the signals are to be winners because it will only give signals when there are very strong trends on all timeframes. If you want a lot of signals for intraday scalping, you can turn off most of the filters and just use lower timeframes for the master trend settings. The following filters can be used to customize the trend parameters:
Signals Only Allowed In Direction Of Timeframes 4 & 5
Trend Of Timeframe #1 Used For Master Trend Signals
Trend Of Timeframe #2 Used For Master Trend Signals
Trend Of Timeframe #3 Used For Master Trend Signals
Trend Of Timeframe #4 Used For Master Trend Signals
Trend Of Timeframe #5 Used For Master Trend Signals
No Master Trend Signals If This Timeframe Is Ranging - #1
No Master Trend Signals If This Timeframe Is Ranging - #2
No Master Trend Signals If This Timeframe Is Ranging - #3
Make sure to keep all trend timeframes in order from 1-5 for best results, even if they are turned off. The indicator is programmed to compare each timeframe to the next one, so keeping the timeframes in order will give you proper calculations. For example: timeframes 1-5 should be 15, 60, 240, 1D, 1W or 240, 1D, 1W, 1M, 3M and so on.
The indicator has alerts for bullish and bearish versions of each type of signal so you can get notified when a chart is trending strongly.
Market Hours Available To Use The Indicator On
The indicator works on stocks, crypto, forex and futures markets and other markets that have the same hours, you just need to select the hours that the market you are trading has in the main indicator settings to get the correct signals. There are options for stock hours(6.5 hours a day, 5 days per week), futures/forex hours(23 hours a day, 5 days per week) and crypto hours(24 hours a day, 7 days per week). Just select the correct option in the dropdown menu and the indicator will calculate based on those hours.
Master Trend Settings
The master trend is calculated using Timeframes 1-5, the setting for whether to use timeframes 1-5 for signals, ranging market filters 1-3 and only allow signals in the direction of timeframes 4 & 5. These settings will affect how the overall trend is calculated, which has to be trending in order for any confluence signals to come in.
Set timeframe 1 to a higher timeframe than your chart is set to. For example if you trade the 1 minute or 5 minute chart, timeframe #1 needs to be set to something higher than your chart so 15, 60 or 240. Then set timeframes 2-5 to be one timeframe higher than the previous one. So if timeframe 1 is 60, then timeframe 2 should be 240 and so on. Make sure to do this even if you do not turn on each timeframe to be used for master trend signals as the higher timeframes will still affect the confluence signals.
Turn on or off the toggle for each timeframe if you want the master trend to use. Keeping just lower timeframes on will give more signals for short term trends and leaving all of the timeframes on will only give signals when all of the timeframes are trending. I recommend keeping timeframes 1 & 2 on at the very least and then turning on or off timeframes 3-5 based on how many signals you want and how strong you want the trend to be in order for signals to be given.
Ranging Market Filters
The indicator has parameters to detect if the market is ranging or moving sideways on each timeframe and will show this by coloring the trend strength score in the bottom panel grey for that timeframe. When the market is ranging, it is best to not trade because there is no established trend. Use these filters to increase the probability of the master trend and confluence trend signals being correct and moving in the direction of the trend.
If you turn on the ranging market filters, you will not get any signals if the market is detected as ranging on any of the timeframes you have turned on for the ranging market filters.
You can use 1, 2 or all 3 ranging market filters to dial in the indicator to your preference. Make sure to backtest it and look at historical data to see how this will affect the indicator and choose what settings work best for your style of trading.
Signals Only Allowed In Direction Of Timeframes 4 & 5
If you only want to make sure you are trading in the direction of the long term trend, turn this setting on. It will prevent the indicator from giving any signals that are not in the same direction as the long term trends and increase your probability for winning trades.
This setting allows you to quickly filter out any noise that you will get from lower timeframe trends that are not in the same direction as the long term trends and helps to ensure you stick to the overall trend. Markets will usually make much faster and larger moves in the direction of the overall trend and have high resistance, choppy moves when going in the opposite direction, so this will help you avoid getting into those trades even if you don’t have timeframes 4 & 5 turned on in the master trend timeframe settings.
Strong Buy & Sell Signals
When the master trend detects a trending market and the trend is strong on all 5 timeframes, the indicator will show crosses on the chart meaning these are great entry points to get into the market with positions in the direction of the trend. There are 3 levels of these signals and will show as small crosses, medium crosses and large crosses. The larger the cross is, the stronger the trend is and is more likely to continue the trend.
Use these strong buy & sell signal crosses as entry points and place your stop loss at the most recent major pivot. Then trail your stop loss with the trade to lock in profits.
Pullbacks During Strong Trend Signals
When there is a strong trend on timeframes 3-5 and a pullback on timeframes 1 & 2, then move back in the direction of the higher timeframe trend, this will fire a signal to enter a trade in the direction of the trend. These are excellent entries since the market has pulled back, allowing you to have a good entry with low potential drawdown.
These signals will appear as label tag or price tag looking signals. Use these for your entries and then place a stop loss just beyond the most recent major pivot and trail your stop loss as the trade moves in your favor to lock in profits.
Strong All Timeframe Trend Signals
When the trend is strong on all timeframes that you have set to use for master trend signals, the indicator will show circles/dots on the chart above or below the candles. There is also a second type of strong trend calculation that it uses that will detect a strong trend in a slightly different way and that formula will paint a background color on the chart as extra confluence. When the background color and dots show up at the same time, that means both formulas are showing strong trends.
Use these dots and background coloring to confirm your position and continue to hold it for more gains. Strong trends typically continue in the same direction so use these signals as extra confluence to hold your position and stay in the trade.
Trend Strength Score Signals
Each timeframe will have a trend strength score calculated. If you turn the visuals on in the master trend timeframe settings, they will show up as an oscillator in the bottom panel. It will show red for bearish trends and green for bullish trends and grey when the market is ranging. It will also show a label next to each timeframe telling you the score out of the maximum score for that timeframe.
Pay attention to these as they will give you a very quick way to read the long term and short term trends. When all timeframes are trending strongly, the background will paint red or green to notify you of strong trends that you can trade.
When the long term trends agree, but short term trends are going against the long term, look for the short term trends to reverse and use those areas as entry positions for longer trades in the direction of the overall trend. Doing this really helps to identify possible reversals and keep you from getting into those types of trades too early.
Timeframes The Indicator Can Be Used On
The indicator is setup to be used on the following chart timeframes: 15 seconds, 30 seconds, 1 minute, 2 minute, 3 minute, 5 minute, 10 minute, 15 minute, 30 minute, 1 hour, 2 hour, 4 hour, 6 hour, 8 hour, 12 hour and 1 day charts.
If your chart is set to a different timeframe than the ones listed above, it will not calculate properly, so make sure your chart is on the correct timeframe.
Markets The Indicator Can Be Used On
The indicator has 3 modes for various market hours. The type of market doesn’t matter, what matters is how many hours that market is open for. Almost all markets fall under 3 types of opening hours so we have provided the ability for the indicator to calculate correctly on all 3 types of market hours. The hours it can use are: stocks(6.5 hours per day, 5 days per week), crypto(24 hours per day, 7 days per week) and futures/forex(23 hours per day, 5 days per week).
You will need to update this setting from the dropdown at the top of the indicator settings to match the chart that you are on for it to calculate correctly.
Filtering Other Indicators Using The Trend Direction Of This Indicator
The indicator has a built in trend direction value that can be sent to other indicators and used as a filter. By setting an input.source() value on other indicators that are on the same chart as this indicator, you can set that indicator to do or not do whatever you want when this trend indicator shows a trend or not.
The name of the source you can use on your external indicator is called Trend Direction To Send To External Indicators. The values it sends are as follows: 0 when there is no master trend direction, 1 when the master trend is bullish and -1 when the master trend is bearish.
By using this source, you can prevent other indicators from giving sell signals during up trends, prevent other indicators from giving buy signals during down trends and prevent other indicators from giving any signals when the market is ranging or not showing an established trend.
Alerts Available To Use
The indicator has alerts for bullish versions as well as bearish versions of each type of signal available. Use these alerts to notify you of strong trends on markets that you may not have the charts up for at all times but still want to trade.

ORB - Futures and Stocks (Breakouts + Alerts + ORB Selector)This indicator shows the Opening Range Breakout (ORB) based on the time range you choose.
Important:
It only works for intraday trading on time frames less than 1 day (like 1-minute, 5-minute, or hourly charts).
You can use it with any stock or futures, such as US500, NAS100, or GER40.
Inputs:
ORB Range - Your preference.
Session Start
Time Zone Offset
Examples:
for EU Frankfurt, DAX (GER40):
Set your ORB range
Session Start 0900
Time Zone Offset +1
For US Stock Market and US500, NAS100:
Set your ORB range
Session Start 0930
Time Zone Offset -5
Created using ChatGPT

Closing Range BreakoutIndicator Description:
This tool tracks the closing price range of a trading session (like New York or London market hours) and highlights potential breakout opportunities. It shows:
Extended Range Lines: Drawn after the session closes, marking the high/low of the session's final hour.
Breakout Arrows: Appear when prices close above/below the range for a user-defined number of consecutive bars.
Session Background: Gray highlight during the selected market's closing hour.
It helps traders spot momentum shifts by focusing on price behavior relative to the closing range, with customizable alerts for confirmed breakouts.
How to Use:
Select Session: Choose your market's closing hour (e.g., New York/London).
Set Confirmation: Adjust how many closes are needed to confirm a breakout.
Watch Visuals:
Gray background = Active closing session
Blue range = Extended high/low from last session
Arrows = First breakout signal
Trade Signals: Price closing outside the range triggers alerts (labels update automatically).
Focus on breakouts with momentum, using the range as support/resistance.

Time-Weighted Price Action IndicatorThe Time-Weighted Price Action Indicator is a simple yet effective tool designed to detect consolidation zones based on time duration and highlight potential reversal points using a contrarian breakout logic. Instead of following traditional breakout strategies, this indicator aims to capitalize on false breakouts and reversal entries.
How It Works
• The indicator identifies a price range (zone) using a configurable lookback period.
• If the price remains within this range for a specified number of bars (threshold), a consolidation zone is confirmed.
• Once a breakout or breakdown from this zone occurs, the indicator triggers a reversed signal — suggesting a potential reversal instead of a trend-following entry.
• Support and resistance levels are marked visually, and BUY/SELL labels are plotted when price re-enters the zone, indicating potential exhaustion or traps.
Key Features
• ✅ Time-based consolidation detection
• ✅ Contrarian signal logic (Buy at breakdowns, Sell at breakouts)
• ✅ Dynamic zone plotting with support/resistance visualization
• ✅ Auto-reset after each breakout for fresh zone detection
• ✅ Visual labels and alerts for BUY/SELL signals
How to Use
• Ideal for range-bound markets or identifying trap zones around support/resistance.
• Use in conjunction with volume, momentum, or trend filters to refine entries.
• Can complement mean reversion strategies or be used as a signal confirmation tool.
Why This Combination?
This approach blends time-based consolidation logic with a contrarian price action perspective, offering traders a different lens to analyze markets. Instead of blindly following breakouts, it highlights areas where price rejections and false breakouts often occur — common in algorithm-driven markets.
Why It’s Worth Using
This indicator helps you stay ahead of trap zones, identify reversal spots, and understand price behavior in consolidation zones — a critical edge, especially in sideways or choppy markets. It adds context to price movement, helping traders avoid common breakout failures.
Note:
• No performance guarantees or exaggerated claims.
• No solicitation or promotional language used.
• This is a free, open-source educational tool meant to aid price action understanding.

Custom Previous High/Low + Breakout AlertsThis indicator plots the previous high and low of the selected timeframe and alerts you when the price breaks either level.
To prevent spam, it triggers only once per period. If both the high and low break within the same period, you will receive an alert for each, but no duplicates if price hovers around these levels.
How to Set Up Alerts
1. Choose Your Timeframe
- In the indicator settings, select the timeframe for the high/low reference.
- Example: If you select 1 hour, the indicator will plot the previous 1-hour high and low and alert you when either level is broken
2. Create an Alert
- Condition → High/Low Break Alerts
- Function → Any alert() function call
Optional:
- If you want alerts only for high breakouts or low breakouts, select High Breakout or Low Breakout and use "Once Per Bar" as the trigger. (It will still alert only once per period.)
3. Setting Alerts for Multiple Timeframes
- If you want to create another alert for a different timeframe, first select the new timeframe in the indicator settings, then create a new alert
- Note: Previous alerts will continue to notify you based on the timeframe they were originally set for, even if you change the timeframe in the indicator settings.

Breakouts with timefilter [LuciTech]Here's the updated description with "colors" replaced by "colours" throughout, maintaining the original structure and content:
Breaking Point 2.0
This is a technical analysis overlay indicator designed to identify breakout levels based on pivot highs and lows, with a focus on price action during customizable time windows using London time (UK). It draws horizontal lines at pivot points and plots signals when price breaks above or below these levels, offering traders a tool to monitor potential bullish or bearish movements. The indicator includes options for time filtering and displaying only the most recent breakout.
Features
The Pivot Breakout Lines display horizontal lines at detected pivot highs (bullish) and pivot lows (bearish), coloured green and red by default. These lines extend from the pivot point to the breakout bar and can be set to show only the latest breakout.
The Breakout Signals mark bullish breakouts with an upward triangle below the bar and bearish breakouts with a downward triangle above the bar, using customizable colours.
The Time Filter restricts signals and lines to a specific window (default: 14:30–15:00 UK), which can be toggled on or off. A shaded background highlights this period when enabled.
How It Works
The indicator calculates pivot highs and lows using a user-defined lookback period (default: 5 bars). When price closes above a pivot high, it triggers a bullish signal and draws a line from the pivot to the breakout bar. When price closes below a pivot low, it triggers a bearish signal with a corresponding line.
If the time filter is active, signals and lines only appear within the specified window. Outside this period—or if the filter is disabled—they appear based solely on price action. The indicator maintains up to three recent pivots in memory, removing older ones as new pivots form.
Alerts are available for both bullish and bearish breakouts, triggered when signals occur.
Settings
Length controls the lookback period for pivot detection (default: 5).
Colours Bull/Bear sets the colours for bullish (default: green) and bearish (default: red) lines and signals.
Show Last Breakout toggles whether only the most recent breakout line and signal are displayed (default: false).
Time Filter enables or disables the time restriction (default: true).
Fill Background toggles a shaded area during the time window (default: true), with a customizable colour.
Time Settings define the start hour/minute and end hour/minute for the filter (default: 14:30–15:00).
Interpretation
The Pivot Breakout Lines highlight levels where price has previously reversed, potentially acting as support or resistance. A breakout above a pivot high may suggest bullish momentum, while a breakout below a pivot low may indicate bearish pressure.
The Breakout Signals provide visual cues for these events, useful for timing entries or exits. When "Show Last Breakout" is enabled, the chart focuses on the most recent signal, reducing clutter.
The Time Filter and background shading help traders concentrate on specific trading sessions, such as high-volatility periods. When disabled, the indicator tracks breakouts across all times.

RSI Volatility Suppression Zones [BigBeluga]RSI Volatility Suppression Zones is an advanced indicator that identifies periods of suppressed RSI volatility and visualizes these suppression zones on the main chart. It also highlights breakout dynamics, giving traders actionable insights into potential market momentum.
🔵 Key Features:
Detection of Suppression Zones:
Identifies periods where RSI volatility is suppressed and marks these zones on the main price chart.
Breakout Visualization:
When the price breaks above the suppression zone, the box turns aqua, and an upward label is drawn to indicate a bullish breakout.
If the price breaks below the zone, the box turns purple, and a downward label is drawn for a bearish breakout.
Breakouts accompanied by a "+" label represent strong moves caused by short-lived, tight zones, signaling significant momentum.
Wave Labels for Consolidation:
If the suppression zone remains unbroken, a "wave" label is displayed within the gray box, signifying continued price stability within the range.
Gradient Intensity Below RSI:
A gradient strip below the RSI line increases in intensity based on the duration of the suppressed RSI volatility period.
This visual aid helps traders gauge how extended the low volatility phase is.
🔵 Usage:
Identify Breakouts: Use color-coded boxes and labels to detect breakouts and their direction, confirming potential trend continuation or reversals.
Evaluate Market Momentum: Leverage "+" labels for strong breakout signals caused by short suppression phases, indicating significant market moves.
Monitor Price Consolidation: Observe gray boxes and wave labels to understand ongoing consolidation phases.
Analyze RSI Behavior: Utilize the gradient strip to measure the longevity of suppressed volatility phases and anticipate breakout potential.
RSI Volatility Suppression Zones provides a powerful visual representation of RSI volatility suppression, breakout signals, and price consolidation, making it a must-have tool for traders seeking to anticipate market movements effectively.

The Curved Market Structure [BigBeluga]Curved Market Structure
The Curved Market Structure indicator offers an innovative twist on traditional market structure tools by using curved lines instead of horizontal ones, enabling faster breakout detection for traders.
🔵Key Features:
Curved Market Structure Levels: The indicator identifies high and low pivots and plots curved lines connecting these points, adapting to market dynamics and providing a more intuitive view of potential breakout zones.
Breakout Detection: Breakouts above or below the curved levels are marked with triangle symbols (▲ or ▼), making it easy to spot critical price movements.
Dynamic Target Levels: After a breakout, the indicator plots three target levels, which serve as potential price objectives. Each target is marked with a number and a star (e.g., 1★) upon being reached.
Customizable Line Length and Angle: Users can adjust the length and angle of the curved lines to fit their trading style and timeframe, making the tool versatile and adaptable.
Market Structure Trend Filtering: To maintain a clean chart, the indicator plots curved levels only from high pivots during uptrends and low pivots during downtrends.
🔵How It Works:
The indicator identifies high and low pivots using user-defined parameters (left and right bars).
Curved lines are drawn from these pivot points, showing the structure of the market and potential breakout zones.
When a breakout occurs, the indicator highlights the direction with triangle symbols and dynamically plots three price targets.
Upon reaching these targets, the level is marked with its respective number and a star, helping traders track price progression effectively.
The lines and targets are adjusted based on market conditions, ensuring real-time relevance and accuracy.
🔵Use Cases:
Spotting key breakout zones to identify entry and exit points more effectively.
Setting dynamic target levels for take-profit or stop-loss planning.
Filtering market noise and maintaining a cleaner chart while analyzing trends.
Enhancing traditional market structure analysis with an intuitive curved visualization.
This indicator is ideal for traders who want a modern, dynamic, and visually appealing way to track market structure and breakouts while maintaining chart clarity.

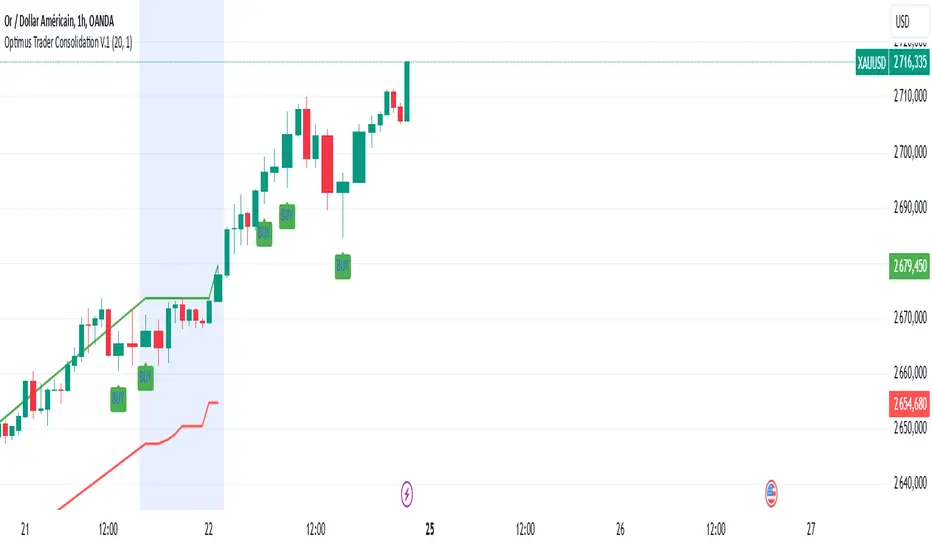
Optimus Trader Consolidation V.1 Indicator Description: "Optimus Trader Consolidation V.1"
This Pine Script indicator is designed to assist traders by identifying key market conditions, including **trend direction**, **volume dynamics**, **liquidity zones**, and **consolidation periods**, alongside candlestick patterns like **Pin Bars** and **Inside Bars**. It provides clear buy and sell signals based on a confluence of these factors. Here’s a detailed breakdown of its functionality:
---
Key Features:
1. **Moving Average (MA) and VWAP Integration**:
- The indicator uses a 50-period Simple Moving Average (SMA) and VWAP (Volume Weighted Average Price) to identify the market trend.
- **Uptrend**: Price is above both the MA and VWAP.
- **Downtrend**: Price is below both the MA and VWAP.
2. **Volume Threshold**:
- A dynamic volume threshold is calculated based on the 20-period SMA of volume, multiplied by a factor of 1.2.
- This ensures signals are filtered to consider only significant volume spikes, avoiding noise from low-volume periods.
3. **Pin Bar Detection**:
- Identifies bullish and bearish Pin Bars based on candlestick characteristics:
- **Bullish Pin Bar**: Large wick above the body, small lower wick, and a green body.
- **Bearish Pin Bar**: Large wick below the body, small upper wick, and a red body.
4. **Inside Bar Detection**:
- Detects Inside Bars, where the current candle’s high and low are fully contained within the previous candle’s range.
- Indicates a period of indecision or potential breakout zones.
5. **Liquidity Zone Identification**:
- Uses recent 20-period highs and lows to approximate liquidity zones.
- Highlights areas where price is near these zones, indicating potential support or resistance.
6. **Buy and Sell Signal Generation**:
- **Buy Signal**: Triggered when a bullish Pin Bar or Inside Bar occurs in an uptrend, with high volume, and near liquidity zones.
- **Sell Signal**: Triggered when a bearish Pin Bar or Inside Bar occurs in a downtrend, with high volume, and near liquidity zones.
- Signals are visually plotted with green (BUY) and red (SELL) markers.
7. **Consolidation Zone Detection**:
- Identifies periods of low price range volatility using a user-defined period (`length`) and range threshold (`range_threshold` in %).
- Highlights periods where the price range is less than the threshold, visually marking consolidation zones.
- Upper and lower boundaries of consolidation zones are plotted with green and red lines, respectively.
8. **Visual Enhancements**:
- Consolidation zones are shaded with a blue background to make them easily recognizable.
- Clear markers for buy and sell signals help traders quickly spot opportunities.
---
Use Cases:
- **Trend Confirmation**: By integrating MA, VWAP, and volume analysis, this indicator helps confirm trends before entering trades.
- **Liquidity Zone Trading**: Identifies price areas where support or resistance may lead to significant price movement.
- **Consolidation Breakouts**: Highlights consolidation zones, which often precede explosive moves, allowing traders to anticipate breakouts.
- **Candlestick Reversal Patterns**: Pin Bars and Inside Bars are powerful patterns that provide early indications of potential reversals or continuation setups.
---
Customizable Parameters:
- **MA Period**: Length of the moving average (default: 50).
- **Volume Threshold**: Sensitivity to volume spikes (default: 20-period SMA × 1.2).
- **Consolidation Period**: Lookback period for identifying consolidation (default: 20).
- **Consolidation Range Threshold**: Maximum percentage range considered as consolidation (default: 1%).
---
Visualization:
- **Green BUY Signals**: Bullish opportunities based on confluence of patterns, trends, and volume.
- **Red SELL Signals**: Bearish opportunities under similar conditions.
- **Consolidation Zones**: Marked by shaded blue backgrounds and clear horizontal lines for high and low boundaries.
- **Dynamic Levels**: Liquidity zones (highs and lows) plotted for added context.
---
Advantages:
- **Confluence of Factors**: Combines trend, volume, and candlestick analysis for robust signal generation.
- **Market State Detection**: Effectively identifies consolidation and breakout conditions.
- **Customizable**: Users can fine-tune parameters for different instruments or trading styles.
---
This indicator is ideal for traders seeking a comprehensive tool to navigate market conditions with precision, leveraging multiple layers of analysis in a single, easy-to-use overlay.
TrendLines MTF [Cometreon]TrendLines MTF is a next-generation indicator designed to automatically detect and plot all relevant trendlines across any symbol and timeframe—including higher ones. Using advanced algorithms, it constantly scans price action and updates the chart in real-time, offering a fast, precise, and dynamic view of market structure.
This tool streamlines market analysis and boosts decision-making by eliminating the need for manual trendline drawing.
🔷 Key Features
🟩 Automatic Plotting
The indicator automatically draws and updates trendlines, providing a real-time overview of market trends.
🟩 Breakout and Bounce Signaling
Provides immediate notifications when a trendline is broken or the price bounces off it, allowing traders to react promptly to market changes.
🟩 Customization
Offers the ability to modify length, touches, colors, and line style to suit individual preferences.
🟩 Information Table
Includes a detailed table showing the values of all active trendlines, facilitating the monitoring of key market points.
🟩 Configurable Alerts
Allows setting custom alerts for breakouts, bounces, or creation of new trendlines.
🔷 Technical Details and Customizable Inputs
Trendline offers a range of customizable inputs that allow adapting the indicator to specific needs:
1️⃣ Trendline Type - Select between active trendlines, broken ones, both, or none.
2️⃣ Left and Right Length - Defines the extension of maximum and minimum points to identify Trendlines.
3️⃣ Timeframe - You can also modify the timeframe of Trendlines to display a higher timeframe.
4️⃣ Confirm at Timeframe - Allows you to confirm the Trendlines using the chart's timeframe instead of the selected one. This checks whether a candle has already broken the line previously.
5️⃣ Delete at Timeframe - Input to remove trendlines based on breakouts with chart candles, instead of using candles of a higher timeframe.
6️⃣ Touch Need - Sets the number of touches needed to confirm a Trendline.
7️⃣ Max Trend Line for Level - Limits the maximum number of Trendlines in a single level.
8️⃣ Extended Line After Break - Option to extend broken Trendlines by a specific value.
9️⃣ Session Range - The "Session Range" offers two options: select a specific date or a period relative to the last candle. The input allows choosing between "Choose" and "Pick Up".
With "Choose", you select a relative period, with two modes:
Last : shows the trendlines of the selected period, compatible with Replay.
Real Time : displays all TrendLines, searching from the last selected period.
Example: "1 Month" with "Last" shows the TrendLines from the previous month, while "Real Time" searches without time limits but uses the values from the last month. This allows defining the search depth of the indicator, crucial for computing power. In case of issues, use "Auto".
1️⃣0️⃣ Trendlines Style - Modify the style for each type of Trendlines (Valid, Break) including color, style, and line thickness.
1️⃣1️⃣ Trends Trendlines - Enable/disable two different trends:
Trend Bar Color : based on TrendLines breakouts. Breaking a bearish TrendLine results in a bullish trend, vice versa for breaking a bullish TrendLine.
Trend Background : based on the number of active TrendLines. For example, if the number of bullish TrendLines is greater than the "Strength", the trend will be bullish.
1️⃣2️⃣ Signal Style - You can enable or disable breakout and bounce signals, with customizable colors for each signal type.
1️⃣3️⃣ Alert - Set notifications for breakouts, bounces, or formation of new Trendlines.
1️⃣4️⃣ Table - Customize the table showing the values of all active trendlines, facilitating the monitoring of key market points. You can modify the appearance of the table, changing the color of cells and text.
These options allow you to optimize the indicator for different trading styles and market conditions, ensuring precise and personalized technical analysis.
🔍 How to Use Trendlines MTF
📌 Market Analysis
Use the displayed Trendlines as critical indicators of market dynamics to make informed trading decisions.
📈 Signal Interpretation
Leverage Trendline breakouts and bounces to identify potential trend changes and trading opportunities.
🛠 Strategy Integration
Use Trendlines and generated signals as a basis for creating personalized and innovative trading strategies.
☄️ With Trendlines, you can simplify your market analysis, saving time and improving the accuracy of your decisions with clearly visualized and customizable Trendlines.
Don't waste any more time and visit the link to get access to all Cometreon indicators.
