PORTFOLIO TABLE Full [Titans_Invest]PORTFOLIO TABLE Full
This is a complete table for monitoring your assets or cryptocurrencies in your SPOT wallet without needing to access your broker’s website or app.
⯁ HOW TO USE THIS TABLE❓
Simply select the asset and enter the amount you hold.
The table will display the value of each asset and the total value of your portfolio.
You can monitor up to 19 assets in real time.
⯁ CONVERT VALUES
You can also enable and select a currency for conversion.
For example, cryptocurrencies are calculated in US dollars by default, but you can choose euros as the conversion currency.
The values originally in dollars will then be displayed in euros.
⯁ TRACK THE DAILY VARIATION OF YOUR PORTFOLIO
You’ll be able to monitor your portfolio’s raw daily variation in real time.
🔶 Track your Portfolio in real time:
🔶 Add your local Currency to Convert Values:
🔶 Follow your Portfolio Live:
___________________________________________________________
📜 SCRIPT : PORTFOLIO TABLE Full
🎴 Art by : @Titans_Invest & @DiFlip
👨💻 Dev by : @Titans_Invest & @DiFlip
🎑 Titans Invest — The Wizards Without Gloves 🧤
✨ Enjoy!
___________________________________________________________
o Mission 🗺
• Inspire Traders to manifest Magic in the Market.
o Vision 𐓏
• To elevate collective Energy 𐓷𐓏
BTCUSDT

PORTFOLIO TABLE Simple [Titans_Invest]PORTFOLIO TABLE Simple
This is a simple table for you to monitor your assets or cryptocurrencies in your SPOT wallet without needing to access your broker’s website or wallet app.
⯁ HOW TO USE THIS TABLE❓
You only need to select the asset and enter the amount of each one.
The table will show how much you have of each asset and the total value of your portfolio.
You’ll be able to monitor up to 39 assets in real time.
⯁ CONVERT VALUES
You can also activate and select a currency for conversion.
For example, cryptocurrency assets are calculated in US dollars, but you can select euros as the conversion currency.
The values originally in dollars will then be displayed in euros.
⯁ Track your Portfolio in real time:
⯁ Add your local Currency to Convert Values:
⯁ Follow your Portfolio Live:
___________________________________________________________
📜 SCRIPT : PORTFOLIO TABLE Simple
🎴 Art by : @Titans_Invest & @DiFlip
👨💻 Dev by : @Titans_Invest & @DiFlip
🎑 Titans Invest — The Wizards Without Gloves 🧤
✨ Enjoy!
___________________________________________________________
o Mission 🗺
• Inspire Traders to manifest Magic in the Market.
o Vision 𐓏
• To elevate collective Energy 𐓷𐓏

ADX Forecast [Titans_Invest]ADX Forecast
This isn’t just another ADX indicator — it’s the most powerful and complete ADX tool ever created, and without question the best ADX indicator on TradingView, possibly even the best in the world.
ADX Forecast represents a revolutionary leap in trend strength analysis, blending the timeless principles of the classic ADX with cutting-edge predictive modeling. For the first time on TradingView, you can anticipate future ADX movements using scientifically validated linear regression — a true game-changer for traders looking to stay ahead of trend shifts.
1. Real-Time ADX Forecasting
By applying least squares linear regression, ADX Forecast projects the future trajectory of the ADX with exceptional accuracy. This forecasting power enables traders to anticipate changes in trend strength before they fully unfold — a vital edge in fast-moving markets.
2. Unmatched Customization & Precision
With 26 long entry conditions and 26 short entry conditions, this indicator accounts for every possible ADX scenario. Every parameter is fully customizable, making it adaptable to any trading strategy — from scalping to swing trading to long-term investing.
3. Transparency & Advanced Visualization
Visualize internal ADX dynamics in real time with interactive tags, smart flags, and fully adjustable threshold levels. Every signal is transparent, logic-based, and engineered to fit seamlessly into professional-grade trading systems.
4. Scientific Foundation, Elite Execution
Grounded in statistical precision and machine learning principles, ADX Forecast upgrades the classic ADX from a reactive lagging tool into a forward-looking trend prediction engine. This isn’t just an indicator — it’s a scientific evolution in trend analysis.
⯁ SCIENTIFIC BASIS LINEAR REGRESSION
Linear Regression is a fundamental method of statistics and machine learning, used to model the relationship between a dependent variable y and one or more independent variables 𝑥.
The general formula for a simple linear regression is given by:
y = β₀ + β₁x + ε
β₁ = Σ((xᵢ - x̄)(yᵢ - ȳ)) / Σ((xᵢ - x̄)²)
β₀ = ȳ - β₁x̄
Where:
y = is the predicted variable (e.g. future value of RSI)
x = is the explanatory variable (e.g. time or bar index)
β0 = is the intercept (value of 𝑦 when 𝑥 = 0)
𝛽1 = is the slope of the line (rate of change)
ε = is the random error term
The goal is to estimate the coefficients 𝛽0 and 𝛽1 so as to minimize the sum of the squared errors — the so-called Random Error Method Least Squares.
⯁ LEAST SQUARES ESTIMATION
To minimize the error between predicted and observed values, we use the following formulas:
β₁ = /
β₀ = ȳ - β₁x̄
Where:
∑ = sum
x̄ = mean of x
ȳ = mean of y
x_i, y_i = individual values of the variables.
Where:
x_i and y_i are the means of the independent and dependent variables, respectively.
i ranges from 1 to n, the number of observations.
These equations guarantee the best linear unbiased estimator, according to the Gauss-Markov theorem, assuming homoscedasticity and linearity.
⯁ LINEAR REGRESSION IN MACHINE LEARNING
Linear regression is one of the cornerstones of supervised learning. Its simplicity and ability to generate accurate quantitative predictions make it essential in AI systems, predictive algorithms, time series analysis, and automated trading strategies.
By applying this model to the ADX, you are literally putting artificial intelligence at the heart of a classic indicator, bringing a new dimension to technical analysis.
⯁ VISUAL INTERPRETATION
Imagine an ADX time series like this:
Time →
ADX →
The regression line will smooth these values and extend them n periods into the future, creating a predicted trajectory based on the historical moment. This line becomes the predicted ADX, which can be crossed with the actual ADX to generate more intelligent signals.
⯁ SUMMARY OF SCIENTIFIC CONCEPTS USED
Linear Regression Models the relationship between variables using a straight line.
Least Squares Minimizes the sum of squared errors between prediction and reality.
Time Series Forecasting Estimates future values based on historical data.
Supervised Learning Trains models to predict outputs from known inputs.
Statistical Smoothing Reduces noise and reveals underlying trends.
⯁ WHY THIS INDICATOR IS REVOLUTIONARY
Scientifically-based: Based on statistical theory and mathematical inference.
Unprecedented: First public ADX with least squares predictive modeling.
Intelligent: Built with machine learning logic.
Practical: Generates forward-thinking signals.
Customizable: Flexible for any trading strategy.
⯁ CONCLUSION
By combining ADX with linear regression, this indicator allows a trader to predict market momentum, not just follow it.
ADX Forecast is not just an indicator — it is a scientific breakthrough in technical analysis technology.
⯁ Example of simple linear regression, which has one independent variable:
⯁ In linear regression, observations ( red ) are considered to be the result of random deviations ( green ) from an underlying relationship ( blue ) between a dependent variable ( y ) and an independent variable ( x ).
⯁ Visualizing heteroscedasticity in a scatterplot against 100 random fitted values using Matlab:
⯁ The data sets in the Anscombe's quartet are designed to have approximately the same linear regression line (as well as nearly identical means, standard deviations, and correlations) but are graphically very different. This illustrates the pitfalls of relying solely on a fitted model to understand the relationship between variables.
⯁ The result of fitting a set of data points with a quadratic function:
_______________________________________________________________________
🥇 This is the world’s first ADX indicator with: Linear Regression for Forecasting 🥇_______________________________________________________________________
_________________________________________________
🔮 Linear Regression: PineScript Technical Parameters 🔮
_________________________________________________
Forecast Types:
• Flat: Assumes prices will remain the same.
• Linreg: Makes a 'Linear Regression' forecast for n periods.
Technical Information:
ta.linreg (built-in function)
Linear regression curve. A line that best fits the specified prices over a user-defined time period. It is calculated using the least squares method. The result of this function is calculated using the formula: linreg = intercept + slope * (length - 1 - offset), where intercept and slope are the values calculated using the least squares method on the source series.
Syntax:
• Function: ta.linreg()
Parameters:
• source: Source price series.
• length: Number of bars (period).
• offset: Offset.
• return: Linear regression curve.
This function has been cleverly applied to the RSI, making it capable of projecting future values based on past statistical trends.
______________________________________________________
______________________________________________________
⯁ WHAT IS THE ADX❓
The Average Directional Index (ADX) is a technical analysis indicator developed by J. Welles Wilder. It measures the strength of a trend in a market, regardless of whether the trend is up or down.
The ADX is an integral part of the Directional Movement System, which also includes the Plus Directional Indicator (+DI) and the Minus Directional Indicator (-DI). By combining these components, the ADX provides a comprehensive view of market trend strength.
⯁ HOW TO USE THE ADX❓
The ADX is calculated based on the moving average of the price range expansion over a specified period (usually 14 periods). It is plotted on a scale from 0 to 100 and has three main zones:
• Strong Trend: When the ADX is above 25, indicating a strong trend.
• Weak Trend: When the ADX is below 20, indicating a weak or non-existent trend.
• Neutral Zone: Between 20 and 25, where the trend strength is unclear.
______________________________________________________
______________________________________________________
⯁ ENTRY CONDITIONS
The conditions below are fully flexible and allow for complete customization of the signal.
______________________________________________________
______________________________________________________
🔹 CONDITIONS TO BUY 📈
______________________________________________________
• Signal Validity: The signal will remain valid for X bars .
• Signal Sequence: Configurable as AND or OR .
🔹 +DI > -DI
🔹 +DI < -DI
🔹 +DI > ADX
🔹 +DI < ADX
🔹 -DI > ADX
🔹 -DI < ADX
🔹 ADX > Threshold
🔹 ADX < Threshold
🔹 +DI > Threshold
🔹 +DI < Threshold
🔹 -DI > Threshold
🔹 -DI < Threshold
🔹 +DI (Crossover) -DI
🔹 +DI (Crossunder) -DI
🔹 +DI (Crossover) ADX
🔹 +DI (Crossunder) ADX
🔹 +DI (Crossover) Threshold
🔹 +DI (Crossunder) Threshold
🔹 -DI (Crossover) ADX
🔹 -DI (Crossunder) ADX
🔹 -DI (Crossover) Threshold
🔹 -DI (Crossunder) Threshold
🔮 +DI (Crossover) -DI Forecast
🔮 +DI (Crossunder) -DI Forecast
🔮 ADX (Crossover) +DI Forecast
🔮 ADX (Crossunder) +DI Forecast
______________________________________________________
______________________________________________________
🔸 CONDITIONS TO SELL 📉
______________________________________________________
• Signal Validity: The signal will remain valid for X bars .
• Signal Sequence: Configurable as AND or OR .
🔸 +DI > -DI
🔸 +DI < -DI
🔸 +DI > ADX
🔸 +DI < ADX
🔸 -DI > ADX
🔸 -DI < ADX
🔸 ADX > Threshold
🔸 ADX < Threshold
🔸 +DI > Threshold
🔸 +DI < Threshold
🔸 -DI > Threshold
🔸 -DI < Threshold
🔸 +DI (Crossover) -DI
🔸 +DI (Crossunder) -DI
🔸 +DI (Crossover) ADX
🔸 +DI (Crossunder) ADX
🔸 +DI (Crossover) Threshold
🔸 +DI (Crossunder) Threshold
🔸 -DI (Crossover) ADX
🔸 -DI (Crossunder) ADX
🔸 -DI (Crossover) Threshold
🔸 -DI (Crossunder) Threshold
🔮 +DI (Crossover) -DI Forecast
🔮 +DI (Crossunder) -DI Forecast
🔮 ADX (Crossover) +DI Forecast
🔮 ADX (Crossunder) +DI Forecast
______________________________________________________
______________________________________________________
🤖 AUTOMATION 🤖
• You can automate the BUY and SELL signals of this indicator.
______________________________________________________
______________________________________________________
⯁ UNIQUE FEATURES
______________________________________________________
Linear Regression: (Forecast)
Signal Validity: The signal will remain valid for X bars
Signal Sequence: Configurable as AND/OR
Condition Table: BUY/SELL
Condition Labels: BUY/SELL
Plot Labels in the Graph Above: BUY/SELL
Automate and Monitor Signals/Alerts: BUY/SELL
Linear Regression (Forecast)
Signal Validity: The signal will remain valid for X bars
Signal Sequence: Configurable as AND/OR
Table of Conditions: BUY/SELL
Conditions Label: BUY/SELL
Plot Labels in the graph above: BUY/SELL
Automate & Monitor Signals/Alerts: BUY/SELL
______________________________________________________
📜 SCRIPT : ADX Forecast
🎴 Art by : @Titans_Invest & @DiFlip
👨💻 Dev by : @Titans_Invest & @DiFlip
🎑 Titans Invest — The Wizards Without Gloves 🧤
✨ Enjoy!
______________________________________________________
o Mission 🗺
• Inspire Traders to manifest Magic in the Market.
o Vision 𐓏
• To elevate collective Energy 𐓷𐓏

ADX Full [Titans_Invest]ADX Full
This is, without a doubt, the most complete ADX indicator available on TradingView — and quite possibly the most advanced in the world. We took the classic ADX structure and fully optimized it, preserving its essence while elevating its functionality to a whole new level. Every aspect has been enhanced — from internal logic to full visual customization. Now you can see exactly what’s happening inside the indicator in real time, with tags, flags, and informative levels. This indicator includes over 22 long entry conditions and 22 short entry conditions , covering absolutely every possibility the ADX can offer. Everything is transparent, adjustable, and ready to fit seamlessly into any professional trading strategy. This isn’t just another ADX — it’s the definitive ADX, built for traders who take the market seriously.
⯁ WHAT IS THE ADX❓
The Average Directional Index (ADX) is a technical analysis indicator developed by J. Welles Wilder. It measures the strength of a trend in a market, regardless of whether the trend is up or down.
The ADX is an integral part of the Directional Movement System, which also includes the Plus Directional Indicator (+DI) and the Minus Directional Indicator (-DI). By combining these components, the ADX provides a comprehensive view of market trend strength.
⯁ HOW TO USE THE ADX❓
The ADX is calculated based on the moving average of the price range expansion over a specified period (usually 14 periods). It is plotted on a scale from 0 to 100 and has three main zones:
Strong Trend: When the ADX is above 25, indicating a strong trend.
Weak Trend: When the ADX is below 20, indicating a weak or non-existent trend.
Neutral Zone: Between 20 and 25, where the trend strength is unclear.
⯁ ENTRY CONDITIONS
The conditions below are fully flexible and allow for complete customization of the signal.
______________________________________________________
🔹 CONDITIONS TO BUY 📈
______________________________________________________
• Signal Validity: The signal will remain valid for X bars .
• Signal Sequence: Configurable as AND or OR .
🔹 +DI > -DI
🔹 +DI < -DI
🔹 +DI > ADX
🔹 +DI < ADX
🔹 -DI > ADX
🔹 -DI < ADX
🔹 ADX > Threshold
🔹 ADX < Threshold
🔹 +DI > Threshold
🔹 +DI < Threshold
🔹 -DI > Threshold
🔹 -DI < Threshold
🔹 +DI (Crossover) -DI
🔹 +DI (Crossunder) -DI
🔹 +DI (Crossover) ADX
🔹 +DI (Crossunder) ADX
🔹 +DI (Crossover) Threshold
🔹 +DI (Crossunder) Threshold
🔹 -DI (Crossover) ADX
🔹 -DI (Crossunder) ADX
🔹 -DI (Crossover) Threshold
🔹 -DI (Crossunder) Threshold
______________________________________________________
______________________________________________________
🔸 CONDITIONS TO SELL 📉
______________________________________________________
• Signal Validity: The signal will remain valid for X bars .
• Signal Sequence: Configurable as AND or OR .
🔸 +DI > -DI
🔸 +DI < -DI
🔸 +DI > ADX
🔸 +DI < ADX
🔸 -DI > ADX
🔸 -DI < ADX
🔸 ADX > Threshold
🔸 ADX < Threshold
🔸 +DI > Threshold
🔸 +DI < Threshold
🔸 -DI > Threshold
🔸 -DI < Threshold
🔸 +DI (Crossover) -DI
🔸 +DI (Crossunder) -DI
🔸 +DI (Crossover) ADX
🔸 +DI (Crossunder) ADX
🔸 +DI (Crossover) Threshold
🔸 +DI (Crossunder) Threshold
🔸 -DI (Crossover) ADX
🔸 -DI (Crossunder) ADX
🔸 -DI (Crossover) Threshold
🔸 -DI (Crossunder) Threshold
______________________________________________________
______________________________________________________
🤖 AUTOMATION 🤖
• You can automate the BUY and SELL signals of this indicator.
______________________________________________________
______________________________________________________
⯁ UNIQUE FEATURES
______________________________________________________
Signal Validity: The signal will remain valid for X bars
Signal Sequence: Configurable as AND/OR
Condition Table: BUY/SELL
Condition Labels: BUY/SELL
Plot Labels in the Graph Above: BUY/SELL
Automate and Monitor Signals/Alerts: BUY/SELL
Signal Validity: The signal will remain valid for X bars
Signal Sequence: Configurable as AND/OR
Table of Conditions: BUY/SELL
Conditions Label: BUY/SELL
Plot Labels in the graph above: BUY/SELL
Automate & Monitor Signals/Alerts: BUY/SELL
______________________________________________________
📜 SCRIPT : ADX Full
🎴 Art by : @Titans_Invest & @DiFlip
👨💻 Dev by : @Titans_Invest & @DiFlip
🎑 Titans Invest — The Wizards Without Gloves 🧤
✨ Enjoy!
______________________________________________________
o Mission 🗺
• Inspire Traders to manifest Magic in the Market.
o Vision 𐓏
• To elevate collective Energy 𐓷𐓏

RTB - Momentum Breakout Strategy V3
📈 RTB - Momentum Breakout Strategy V3 is a directional breakout strategy based on momentum. It combines exponential moving averages (EMAs), RSI, and recent support/resistance levels to detect breakout entries with trend confirmation. The system includes dynamic risk management using ATR-based stop-loss and trailing stop levels. Webhook alerts are supported for external automated trading integrations.
🔎 The strategy was backtested using default parameters on BTCUSDT Futures (Bybit) with 4-hour timeframe and a 0.05% commission per trade.
⚠️ This script is for educational purposes only and does not constitute financial advice. Always do your own research before trading.

Scalping Strategy Signal v2 by [INFINITYTRADER]Overview
This Pine Script (v6) implements a scalping strategy that uses higher timeframe data (default: 4H) to generate entry and exit signals, originally designed for the 15-minute timeframe with an option for 30-minute charts. The "Scalping Strategy Signal v2 by " integrates moving averages, RSI, volume, ATR, and candlestick patterns to identify trading opportunities. It features adjustable risk management with ATR-based stop-loss, take-profit, and trailing stops, plus dynamic position sizing based on user-set capital. Trades trigger only on the higher timeframe candle close (e.g., 4H) to limit activity within the same period. This closed-source script offers a structured scalping approach, blending multiple entry methods and risk controls for adaptability across market conditions.
What Makes It Unique
Unlike typical scalping scripts relying on single-indicator triggers (e.g., RSI alone or basic MA crossovers), this strategy combines four distinct entry methods—standard MA crossovers, RSI-based momentum shifts, trend-following shorts, and candlestick pattern logic—evaluated on a 4H timeframe for confirmation. This multi-layered design, paired with re-entry logic after losses and a mix of manual, ATR-based, and trailing exits, aims to balance trade frequency and reliability. The higher timeframe filter adds precision not commonly found in simpler scalping tools, while the 30-minute option enhances consistency by reducing noise.
How It Works
Timeframe Logic
Runs on a base timeframe (designed for 15-minute charts, with a 30-minute option) while pulling data from a user-chosen higher timeframe (default: 4H) for signal accuracy.
Limits entries to the close of each 4H candle, ensuring one trade per period to avoid over-trading in volatile conditions.
Indicators and Data
Moving Averages : Employs 21-period and 50-period simple moving averages on the higher timeframe to detect trends and signal entries/exits.
Volume : Requires volume to exceed 70% of its 20-period average on the higher timeframe for momentum confirmation.
RSI : Uses a 14-period RSI for overbought/oversold filtering and a 6-period RSI for precise entry timing.
ATR : Applies a 14-period Average True Range on the higher timeframe to set adaptive stop-loss and take-profit levels.
Candlestick Patterns : Analyzes consecutive green or red 4H bars for trend continuation signals.
Why These Indicators
The blend of moving averages, RSI, volume, ATR, and candlestick patterns forms a robust scalping framework. Moving averages establish trend context, RSI filters momentum and avoids extremes, volume confirms market activity, ATR adjusts risk to volatility, and candlestick patterns enhance entry timing with price action insights. Together, they target small, frequent moves in flat or trending markets, with the 4H filter reducing false signals common in lower-timeframe scalping.
Entry Conditions
Four entry methods are evaluated at the 4H candle close:
Standard Long Entry: Price crosses above the 21-period moving average, volume exceeds 70% of its 20-period average, and the 1H 14-period RSI is below 70—confirms uptrend momentum.
Special Long Entry: The 6-period RSI crosses above 23, price is more than 1.5 times the ATR from the 21-period moving average, and price exceeds its prior close—targets oversold bounces with a stop-loss at the 4H candle’s low.
Short Entries:
- RSI-Based: The 6-period RSI crosses below 68 with volume support—catches overbought pullbacks.
- Trend-Based: Price crosses below the 21-period moving average, volume is above 70% of its average, and the 1H 14-period RSI is above 30—confirms downtrends.
Red/Green Bar Logic: Two consecutive green 4H bars for longs or red 4H bars for shorts—uses candlestick patterns for continuation, with a tight stop-loss from the base timeframe candle.
Re-Entry Logic
Long : After a losing special long, triggers when the 6-period RSI crosses 27 and price crosses the 21-period moving average.
Short : After a losing short, triggers when the 6-period RSI crosses 50 and price crosses below the 21-period moving average.
Purpose: Offers recovery opportunities with stricter conditions.
Exit Conditions
Manual Exits: Longs close if the 21-period MA crosses below the 50-period MA or the 1H 14-period RSI exceeds 68; shorts close if the 21-period MA crosses above the 50-period MA or RSI drops below 25.
ATR-Based TP/SL: Stop-loss is entry price ± ATR × 1.5 (default); take-profit is ± ATR × 4 (default), checked at 4H close.
Trailing Stop: Adjusts ±6x ATR from peak/trough, closing if price retraces within 1x ATR.
Special/Tight SL: Special longs exit if price opens below the 4H candle’s low; 4th method entries use the base timeframe candle’s low/high, checked every bar.
Position Sizing
Bases trade value on user-set capital (default: 100 USDT), dividing by the higher timeframe close price for dynamic sizing.
Visualization
Displays a table at the bottom-right with current/previous signals, TP/SL levels, equity, trading pair, and trade size—color-coded for clarity (green for buy, red for sell).
Inputs
Initial Capital (USDT): Sets trade value (default: 100, min: 1).
ATR Stop-Loss Multiplier: Adjusts SL distance (default: 1.5, min: 1).
ATR Take-Profit Multiplier: Adjusts TP distance (default: 4, min: 1).
Higher Timeframe: Selects analysis timeframe (options: 1m, 5m, 15m, 30m, 1H, 4H, D, W; default: 4H).
Usage Notes
Intended Timeframe: Designed for 15-minute charts with 4H confirmation for precision and frequency; 30-minute charts improve consistency by reducing noise.
Backtesting: Adjust ATR multipliers and capital to match your asset’s volatility and risk tolerance.
Risk Management: Combines manual, ATR, and trailing exits—monitor to avoid overexposure.
Limitations: 4H candle-close dependency may delay entries in fast markets; RSI/volume filters can reduce trades in low-momentum periods.
Backtest Observations
Tested on BTC/USDT (4H higher timeframe, default settings: Initial Capital: 100 USDT, ATR SL: 1.5x, ATR TP: 4x) across market conditions, comparing 15-minute and 30-minute charts:
Bull Market (Jul 2023 - Dec 2023):
15-Minute: 277 long, 219 short; Win Rate: 42.74%; P&L: 108%; Drawdown: 1.99%; Profit Factor: 3.074.
30-Minute: 257 long, 215 short; Win Rate: 49.58%; P&L: 116.85%; Drawdown: 2.34%; Profit Factor: 3.14.
Notes: Moving average crossovers and green bar patterns suited this bullish phase; 30-minute improved win rate and P&L by filtering weaker signals.
Bear Market (Jan 2022 - Jun 2022):
15-Minute: 262 long, 211 short; Win Rate: 44.4%; P&L: 239.80%; Drawdown: 3.74%; Profit Factor: 3.419.
30-Minute: 250 long, 200 short; Win Rate: 52.22%; P&L: 258.77%; Drawdown: 5.34%; Profit Factor: 3.461.
Notes: Red bar patterns and RSI shorts thrived in the downtrend; 30-minute cut choppy reversals for better consistency.
Flat Market (Jan 2021 - Jun 2021):
15-Minute: 280 long, 208 short; Win Rate: 51.84%; P&L: 340.33%; Drawdown: 9.59%; Profit Factor: 2.924.
30-Minute: 270 long, 209 short; Win Rate: 55.11%; P&L: 315.42%; Drawdown: 7.21%; Profit Factor: 2.598.
Notes: High trade frequency and P&L showed strength in ranges; 30-minute lowered drawdown for better risk control.
Results reflect historical performance on BTC/USDT with default settings—users should test on their assets and timeframes. Past performance does not guarantee future results and is shared only to illustrate the strategy’s behavior.
Why It Works Well in Flat Markets
A "flat market" lacks strong directional trends, with price oscillating around moving averages, as in Jan 2021 - Jun 2021 for BTC/USDT. This strategy excels here because its crossover-based entries trigger frequently in tight ranges. In trending markets, an exit might not be followed by a new entry without a pullback, but flat markets produce multiple crossovers, enabling more trades. ATR-based TP/SL and trailing stops capture these small swings, while RSI and volume filters ensure momentum, driving high P&L and win rates.
Technical Details
Built in Pine Script v6 for TradingView compatibility.
Prevents overlapping trades with long/short checks.
Handles edge cases like zero division and auto-detects the trading pair’s base currency (e.g., BTC from BTCUSDT).
This strategy suits scalpers seeking structured entries and risk management. Test on 15-minute or 30-minute charts to match your style and market conditions.

Simple APF Strategy Backtesting [The Quant Science]Simple backtesting strategy for the quantitative indicator Autocorrelation Price Forecasting. This is a Buy & Sell strategy that operates exclusively with long orders. It opens long positions and generates profit based on the future price forecast provided by the indicator. It's particularly suitable for trend-following trading strategies or directional markets with an established trend.
Main functions
1. Cycle Detection: Utilize autocorrelation to identify repetitive market behaviors and cycles.
2. Forecasting for Backtesting: Simulate trades and assess the profitability of various strategies based on future price predictions.
Logic
The strategy works as follow:
Entry Condition: Go long if the hypothetical gain exceeds the threshold gain (configurable by user interface).
Position Management: Sets a take-profit level based on the future price.
Position Sizing: Automatically calculates the order size as a percentage of the equity.
No Stop-Loss: this strategy doesn't includes any stop loss.
Example Use Case
A trader analyzes a dayli period using 7 historical bars for autocorrelation.
Sets a threshold gain of 20 points using a 5% of the equity for each trade.
Evaluates the effectiveness of a long-only strategy in this period to assess its profitability and risk-adjusted performance.
User Interface
Length: Set the length of the data used in the autocorrelation price forecasting model.
Thresold Gain: Minimum value to be considered for opening trades based on future price forecast.
Order Size: percentage size of the equity used for each single trade.
Strategy Limit
This strategy does not use a stop loss. If the price continues to drop and the future price forecast is incorrect, the trader may incur a loss or have their capital locked in the losing trade.
Disclaimer!
This is a simple template. Use the code as a starting point rather than a finished solution. The script does not include important parameters, so use it solely for educational purposes or as a boilerplate.

BTC-USDT Liquidity Trend [Ajit Pandit]his script helps traders visualize trend direction and identify liquidity zones where price might react due to past pivot levels. The color-coded candles and extended pivot lines make it easier to spot support/resistance levels and potential breakout points.
Key Features:
1. Trend Detection Using EMA
Uses two EMA calculations to determine the trend:
emaValue: Standard EMA based on length1
correction: Adjusted price movement relative to EMA
Trend: Another EMA of the corrected value
Determines bullish (signalUp) and bearish (signalDn) signals when Trend crosses emaValue.
2. Candlestick Coloring Based on Trend
Candlesticks are colored:
Uptrend → Blue (up color)
Downtrend → Pink (dn color)
Neutral → No color
3. Liquidity Zones (Pivot Highs & Lows)
Identifies pivot highs and lows using a customizable pivot length.
Draws liquidity lines:
High pivot lines (Blue, adjustable width)
Low pivot lines (Pink, adjustable width)
Extends lines indefinitely until price breaks above/below the level.
Removes broken pivot levels dynamically.

Ultimate Volatility Scanner by NHBprod - Requested by Client!Hey Everyone!
I created another script to add to my growing library of strategies and indicators that I use for automated crypto and stock trading! This strategy is for BITCOIN but can be used on any stock or crypto. This was requested by a client so I thought I should create it and hopefully build off of it and build variants!
This script gets and compares the 14-day volatility using the ATR percentage for a list of cryptocurrencies and stocks. Cryptocurrencies are preloaded into the script, and the script will show you the TOP 5 coins in terms of volatility, and then compares it to the Bitcoin volatility as a reference. It updates these values once per day using daily timeframe data from TradingView. The coins are then sorted in descending order by their volatility.
If you don't want to use the preloaded set of coins, you have the option of inputting your own coins AND/OR stocks!
Let me know your thoughts.

NexTrade
Overview of NexTrade: The Future of Crypto Trading
Introduction
NexTrade is a cutting-edge algorithmic trading platform designed to optimize cryptocurrency trading strategies. Developed by myself, a software engineer with a passion for quantitative development. Over the past year, I have focused on learning and applying quantitative techniques to the crypto space, ultimately crafting a platform that leverages advanced market analysis, automation, and robust risk management to help investors maximize returns while minimizing risk. NexTrade is engineered to help you capitalize on market movements in a fast-paced and highly competitive space, that is Cryptocurrency.
Key Features and Advantages
Sophisticated Market Analysis: NexTrade uses a comprehensive market analysis framework that examines historical trends, price movements, and market conditions across multiple cryptocurrency exchanges. The algorithm identifies trading opportunities by chart analysis on higher timeframes in order to follow trends, allowing it to execute trades at optimal moments.
Multi-Exchange Integration: NexTrade connects to multiple leading cryptocurrency exchanges, such as Binance, Kraken, and Coinbase Pro, to ensure access to diverse liquidity pools. This multi-exchange connectivity allows the platform to execute trades at the most favorable prices, optimizing profitability and minimizing slippage across various platforms. However, we suggest using the exchange with lowest fees possible.
Risk Management: NexTrade’s risk management features such as Stop Losses, ATR Trailing SL, and ADX chop indicator allows us to ensure we are effectively managing our risk.
Backtesting and Optimization: Before going live, NexTrade’s trading strategies undergo rigorous backtesting using historical market data. This enables users to see how strategies would have performed under various conditions, providing transparency and confidence in the platform’s potential for generating consistent returns. Ongoing optimization ensures that strategies evolve in response to market changes.
Real-Time Performance Monitoring: Users have access to detailed, real-time performance reports, tracking key metrics such as trades executed, profits, losses, and overall portfolio performance. This transparency allows investors to make informed decisions and monitor their investments closely at any time.
Market Opportunity
The cryptocurrency market continues to experience rapid growth, with trillions of dollars in trading volume annually. However, it is also notoriously volatile, creating both risk and reward opportunities for traders. To successfully navigate this market, investors need sophisticated tools that can automate the trading process and optimize decisions based on accurate market analysis.
NexTrade was developed to address this need. With its combination of data-driven market analysis, automated execution, and risk management, NexTrade is positioned to help investors gain an edge in a market that is often unpredictable and challenging. The platform offers a reliable, scalable solution to crypto trading, designed for both beginners and seasoned professionals.
Why Invest in NexTrade?
Scalable and Flexible: Whether you’re trading small amounts or large volumes, NexTrade can scale to accommodate your needs. The platform supports multiple exchanges, giving users the flexibility to diversify and grow their investments. Users can start with as low as $100!
Risk-Adjusted Returns: By focusing on risk management, NexTrade aims to deliver returns that are balanced with the level of risk the investor is willing to accept. The algorithm continuously adjusts trading strategies to align with market conditions, maximizing the potential for profits while minimizing the likelihood of significant losses.
24/7 Trading: The cryptocurrency market operates around the clock, and NexTrade is designed to take advantage of this. Its automated nature means that it can execute trades at any time, without the need for human intervention.
Conclusion
NexTrade offers a sophisticated yet accessible solution for investors looking to capitalize on the growth of the cryptocurrency market. With its focus on data-driven analysis, automated trade execution, and advanced risk management, NexTrade empowers investors to achieve optimal returns while managing risk effectively. Whether you are new to crypto or an experienced trader, NexTrade provides the tools needed to stay competitive and succeed in a fast-moving market.
By investing in NexTrade, you are gaining access to a proven algorithmic trading platform that has the potential to enhance your crypto trading strategy and deliver consistent results. The future of cryptocurrency trading is automated, risk-managed, and optimized—and NexTrade is leading the way.
If users wish the enable the chop detector on the bot, which uses ADX, they can turn it on in the settings after the strategu is added to the chart. By default, it is set to false.

MACD Buy/Sell Labels + Barcolor👉 MACD Buy/Sell Labels + Barcolor
This advanced indicator combines the functionality of the MACD (Moving Average Convergence Divergence) with intuitive and customizable visual features, making it ideal for traders looking for an efficient tool to confirm buy and sell signals across any market.
It is based on the logical interpretation of a modified oscillator to improve its performance and simplify its usage. The indicator integrates seamlessly into the chart, offering an intuitive and easy-to-understand experience.
📍 Labels (Buy/Sell):
The signals are generated automatically by crossovers between the Fast EMA and Slow EMA of the Gaussian MACD. It comes with a default configuration designed to favor clean crossovers while avoiding false signals.
🧪 Barcolor:
The color of the candles dynamically changes according to the range of the Gaussian MACD histogram. This allows for a clear visualization of the MACD's status without needing to display the full oscillator. This feature integrates with the labels, as explained in the "Interpretation" section, to significantly increase their probability of success. Both the ranges and colors are fully customizable through the settings panel.
⚙️ Settings:
All aspects of the indicator can be customized:
1-MACD: Like a standard MACD, you can adjust the EMA lengths and the signal smoothing to adapt it to your trading style and the markets you trade.
2-Barcolor: The predefined values highlight extreme levels for proper interpretation, as explained in the "Interpretation" section. However, intermediate levels are also included in case you want to implement them in your strategy. You can adjust these values based on what you consider "overbought" or "oversold." This flexibility allows adaptation to various assets, as oscillator behavior varies across different instruments.
3-Buy/Sell Filter:
The filter settings allow you to further refine the signals. The default values of -70 (Buy Filter) and 80 (Sell Filter) work best for me, but you can adjust them as you see fit. Keep in mind:
-Higher distance from zero: More filtered signals (fewer, but higher quality).
-Closer to zero: Less filtered signals (more frequent, but with increased risk of false signals).
🤔 Interpretation:
As mentioned earlier, this follows the classic interpretation of a MACD oscillator: overbought/oversold levels combined with crossovers. However, the barcolor variable is what makes this indicator truly unique.
With barcolor, you can detect potential divergences and confirm them using the labels. When the oscillator reaches an extreme zone, barcolor provides a visual alert. Once the oscillator exits this zone, the candles revert to their normal color. This signals that the oscillator is dropping. If the price continues rising, this divergence can indicate an anomaly in the market. Waiting for confirmation from the label increases the probability of successful trades while detecting unusual market deviations without even looking at the oscillator.
Purpose:
This indicator is designed to help traders simplify the interpretation of the MACD. It can be used on any timeframe, but it was primarily tested using technical analysis concepts and basic liquidity principles. Its effectiveness improves significantly if you understand broader market dynamics.
Disclaimer:
This is purely an analytical tool and should NOT be considered as trading signals. Perform your own research and make decisions based solely on your responsibility. Thank you!

Cabal Dev IndicatorThis is a TradingView Pine Script (version 6) that creates a technical analysis indicator called the "Cabal Dev Indicator." Here's what it does:
1. Core Functionality:
- It calculates a modified version of the Stochastic Momentum Index (SMI), which is a momentum indicator that shows where the current close is relative to the high/low range over a period
- The indicator combines elements of stochastic oscillator calculations with exponential moving averages (EMA)
2. Key Components:
- Uses configurable input parameters for:
- Percent K Length (default 15)
- Percent D Length (default 3)
- EMA Signal Length (default 15)
- Smoothing Period (default 5)
- Overbought level (default 40)
- Oversold level (default -40)
3. Calculation Method:
- Calculates the highest high and lowest low over the specified period
- Finds the difference between current close and the midpoint of the high-low range
- Applies EMA smoothing to both the range and relative differences
- Generates an SMI value and further smooths it using a simple moving average (SMA)
- Creates an EMA signal line based on the smoothed SMI
4. Visual Output:
- Plots the smoothed SMI line in green
- Plots an EMA signal line in red
- Shows overbought and oversold levels as gray horizontal lines
- Fills the areas above the overbought level with light red
- Fills the areas below the oversold level with light green
This indicator appears designed to help traders identify potential overbought and oversold conditions in the market, as well as momentum shifts, which could be used for trading decisions.
Would you like me to explain any specific part of the indicator in more detail?

Simple Moving Average with Regime Detection by iGrey.TradingThis indicator helps traders identify market regimes using the powerful combination of 50 and 200 SMAs. It provides clear visual signals and detailed metrics for trend-following strategies.
Key Features:
- Dual SMA System (50/200) for regime identification
- Colour-coded candles for easy trend visualisation
- Metrics dashboard
Core Signals:
- Bullish Regime: Price < 200 SMA
- Bearish Regime: Price > 200 SMA
- Additional confirmation: 50 SMA Cross-over or Cross-under (golden cross or death cross)
Metrics Dashboard:
- Current Regime Status (Bull/Bear)
- SMA Distance (% from price to 50 SMA)
- Regime Distance (% from price to 200 SMA)
- Regime Duration (bars in current regime)
Usage Instructions:
1. Apply the indicator to your chart
2. Configure the SMA lengths if desired (default: 50/200)
3. Monitor the color-coded candles:
- Green: Bullish regime
- Red: Bearish regime
4. Use the metrics dashboard for detailed analysis
Settings Guide:
- Length: Short-term SMA period (default: 50)
- Source: Price calculation source (default: close)
- Regime Filter Length: Long-term SMA period (default: 200)
- Regime Filter Source: Price source for regime calculation (default: close)
Trading Tips:
- Use bullish regimes for long positions
- Use bearish regimes for capital preservation or short positions
- Consider regime duration for trend strength
- Monitor distance metrics for potential reversals
- Combine with other systems for confluence
#trend-following #moving average #regime #sma #momentum
Risk Management:
- Not a standalone trading system
- Should be used with proper position sizing
- Consider market conditions and volatility
- Always use stop losses
Best Practices:
- Monitor multiple timeframes
- Use with other confirmation tools
- Consider fundamental factors
Version: 1.0
Created by: iGREY.Trading
Release Notes
// v1.1 Allows table overlay customisation
// v1.2 Update to v6 pinescript

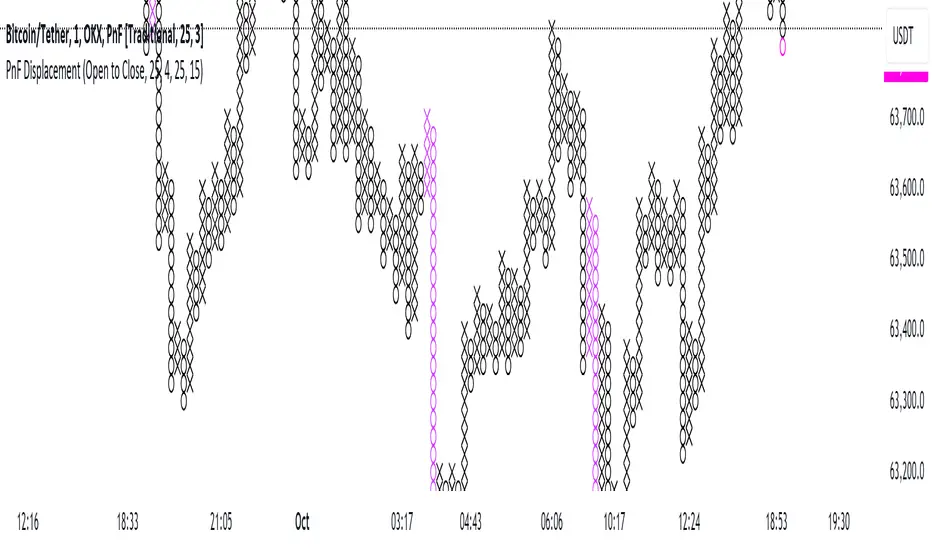
Point and Figure Displacement IndicatorThe PnF Displacement indicator is my custom script for TradingView, designed to analyze Point and Figure (PnF) charts with displacement features.
Key components of the script include:
User Inputs:
Require FVG: A boolean input to determine if a Fair Value Gap (FVG) is required for displacement calculations.
Displacement Type: Allows users to choose between "Open to Close" and "High to Low" for column range calculations.
Displacement Length: Defines how far back to look for calculating the standard deviation of the column range.
Displacement Strength: Multiplier for the standard deviation to adjust sensitivity.
Box Size: Sets the size of each box in the PnF chart.
Number of Boxes for Minimum Displacement: Specifies how many boxes to consider for calculating the minimum displacement.
Displacement Logic:
The script calculates the column range based on the selected displacement type.
It computes a standard deviation of the candle range and determines a minimum displacement based on user-defined box size and count.
The displacement condition combines the FVG check and the column range against the calculated minimum.
Visual Representation:
The bars are colored based on displacement conditions, enhancing visual analysis on the chart.
This indicator aids traders in identifying significant price movements in PnF charts while incorporating user customization options for better analysis.
Volatility with Power VariationVolatility Analysis using Power Variation
The "Volatility with Power Variation" indicator is designed to measure market volatility. It focuses on providing traders with a clear understanding of how much the market is moving and how this movement changes over time.. This indicator helps in identifying potential periods of market expansion or contraction, based on volatility.
What the indicator does:
This indicator analyzes volatility which refers to the degree of variation in the returns of a financial instrument over time. It's an important measure to understand how much the price and returns of a asset fluctuates. High volatility means large price swings, meanwhile low volatility indicates smaller and consolidating movements. Realized (Historical) Volatility refers to volatility based on past price data.
Power Variation
Power Variation is an extension of the traditional methods used to calculate realized volatility. Instead of simply summing up squared returns (as done in calculating variance), Power Variation raises the magnitude of returns to a power p . This allows the indicator to capture different types of market behavior depending on the chosen value of p .
When P = 2, the Power variation behaves like a traditional variance measure. Lower values of p (e.g., p=1) make the indicator more sensitive to smaller price changes, meanwhile higher values make it more responsive to large jumps, but smaller price moves wont affect the measure that much or won't most likely.
Bipower Variation
Bipower variation is another method used to analyze the changes in price. It specifically isolates the continuous part of price movements from the jumps, which can help by understanding whether volatility is coming from regular market activity or from sharp, sudden moves.
How to Use the Indicator.
Understand Realized and Historical Volatility. Volatility after periods of low volatility you can eventually expect a expansion or an increase in volatility. Conversely, after periods of high volatility, the market often contracts and volatility decreases. If the variation plot is really low and you start seeing it increasing, shown by the standard deviation channels and moving average and you see it trending and increasing then that means you can expect for volatility to increase which means more price moves and expansions. Also if the scaling seems messed up, then use the logarithmic chart scale.

Rsi Long-Term Strategy [15min]Hello, I would like to present to you The "RSI Long-Term Strategy" for 15min tf
The "RSI Long-Term Strategy " is designed for traders who prefer a combination of momentum and trend-following techniques. The strategy focuses on entering long positions during significant market corrections within an overall uptrend, confirmed by both RSI and volume. The use of long-term SMAs ensures that trades are made in line with the broader market trend. The stop-loss feature provides risk management by limiting losses on trades that do not perform as expected. This strategy is particularly well-suited for longer-term traders who monitor 15-minute charts but look for substantial trend reversals or continuations.
Indicators and Parameters:
Relative Strength Index (RSI):
- The RSI is calculated using a 10-period length. It measures the magnitude of recent price changes to evaluate overbought or oversold conditions. The script defines oversold conditions when the RSI is at or below 30 and overbought conditions when the RSI is at or above 70.
Volume Condition:
-The strategy incorporates a volume condition where the current volume must be greater than 2.5 times the 20-period moving average of volume. This is used to confirm the strength of the price movement.
Simple Moving Averages (SMA):
- The strategy uses two SMAs: SMA1 with a length of 250 periods and SMA2 with a length of 500 periods. These SMAs help identify long-term trends and generate signals based on their crossover.
Strategy Logic:
Entry Logic:
A long position is initiated when all the following conditions are met:
The RSI indicates an oversold condition (RSI ≤ 30).
SMA1 is above SMA2, indicating an uptrend.
The volume condition is satisfied, confirming the strength of the signal.
Exit Logic:
The strategy closes the long position when SMA1 crosses under SMA2, signaling a potential end of the uptrend (a "Death Cross").
Stop-Loss:
A stop-loss is set at 5% below the entry price to manage risk and limit potential losses.
Buy and sell signals are highlighted with circles below or above bars:
Green Circle : Buy signal when RSI is oversold, SMA1 > SMA2, and the volume condition is met.
Red Circle : Sell signal when RSI is overbought, SMA1 < SMA2, and the volume condition is met.
Black Cross: "Death Cross" when SMA1 crosses under SMA2, indicating a potential bearish signal.
to determine the level of stop loss and target point I used a piece of code by RafaelZioni, here is the script from which a piece of code was taken
I hope the strategy will be helpful, as always, best regards and safe trades
;)

BTC Coinbase PremiumThis script is designed to compare the price of Bitcoin on two major exchanges: Coinbase and Binance. It helps you see if there’s a difference in the price of Bitcoin between these two exchanges, which is known as a “premium” or “discount.”
Here’s how it works in simple terms:
Getting the Prices:
The script first fetches the current price of Bitcoin from Coinbase and Binance. It looks at the closing price, which is the price at the end of the selected time period on your chart.
Calculating the Difference:
It then calculates the difference between these two prices. If Bitcoin is more expensive on Coinbase than on Binance, this difference will be positive, indicating a “premium.” If it’s cheaper on Coinbase, the difference will be negative, indicating a “discount.”
Visualizing the Difference:
The script creates a visual chart that shows this price difference over time. It uses green bars to show when there’s a premium (Coinbase is more expensive) and red bars to show when there’s a discount (Coinbase is cheaper).
Optional Table Display:
If you choose to, the script can also show this price difference in a small table at the top right corner of your chart. The table displays the words “Coinbase Premium” and the exact dollar amount of the premium or discount.
Why does it matter?
Traders and investors have spotted a correlation between bullish strength on BTC and a strong Coinbase premium along with the inverse of a strong Coinbase discount and BTC price weakness.

SOL & BTC EMA with BTC/SOL Price Difference % and BTC Dom EMAThis script is designed to provide traders with a comprehensive analysis of Solana (SOL) and Bitcoin (BTC) by incorporating Exponential Moving Averages (EMAs) and price difference percentages. It also includes the BTC Dominance EMA to offer insights into the overall market dominance of Bitcoin.
Features:
SOL EMA: Plots the Exponential Moving Average (EMA) for Solana (SOL) based on a customizable period length.
BTC EMA: Plots the Exponential Moving Average (EMA) for Bitcoin (BTC) based on a customizable period length.
BTC Dominance EMA: Plots the Exponential Moving Average (EMA) for BTC Dominance, which helps in understanding Bitcoin's market share relative to other cryptocurrencies.
BTC/SOL Price Difference %: Calculates and plots the percentage difference between BTC and SOL prices, adjusted for their respective EMAs. This helps in identifying relative strength or weakness between the two assets.
Background Highlight: Colors the background to visually indicate whether the BTC/SOL price difference percentage is positive (green) or negative (red), aiding in quick decision-making.
Inputs:
SOL Ticker: Symbol for Solana (default: BINANCE
).
BTC Ticker: Symbol for Bitcoin (default: BINANCE
).
BTC Dominance Ticker: Symbol for Bitcoin Dominance (default: CRYPTOCAP
.D).
EMA Length: The length of the EMA (default: 20 periods).
Usage:
This script is intended for traders looking to analyze the relationship between SOL and BTC, using EMAs to smooth out price data and highlight trends. The BTC/SOL price difference percentage can help traders identify potential trading opportunities based on the relative movements of SOL and BTC.
Note: Leverage trading involves significant risk and may not be suitable for all investors. Ensure you have a good understanding of the market conditions and employ proper risk management techniques.

Coinbase Premium ($) Absolute Dollar Amount # Coinbase Dollar Premium Indicator
## Description
The Coinbase Dollar Premium Indicator is a powerful tool for cryptocurrency traders and analysts, providing real-time insight into the price differences between major exchanges. This indicator calculates and visualizes the dollar amount premium or discount of Bitcoin on Coinbase compared to the average price on Binance and Kraken.
## Key Features
1. **Dollar Value**: Unlike percentage-based indicators, this tool shows the actual dollar amount difference, giving traders a clear understanding of the magnitude of price disparities.
2. **Multi-Exchange Comparison**: By averaging the prices from Binance and Kraken, the indicator provides a more robust baseline for comparison, reducing the impact of single-exchange anomalies.
3. **Clear Visual Representation**: The indicator uses a color-coded histogram for easy interpretation:
- Green bars indicate a premium on Coinbase (Coinbase price is higher)
- Red bars indicate a discount on Coinbase (Coinbase price is lower)
- The height of each bar represents the dollar amount of the premium or discount
4. **Zero Line Reference**: A horizontal line at zero helps quickly distinguish between premium and discount states.
## Use Cases
- **Arbitrage Opportunities**: Identify potential arbitrage opportunities between exchanges.
- **Market Sentiment**: Gauge institutional and retail investor sentiment, as Coinbase is often associated with US institutional activity.
- **Price Prediction**: Use divergences between exchanges as a potential indicator of short-term price movements.
- **Risk Management**: Understand the pricing landscape across major exchanges to make more informed trading decisions.
This indicator is valuable for both short-term traders looking for quick opportunities and long-term investors wanting to understand market dynamics. By providing a clear, dollar-based view of inter-exchange price differences, the Coinbase Dollar Premium Indicator offers unique insights into the cryptocurrency market's microstructure.
*Note: This indicator is for informational purposes only and should not be considered financial advice. Always conduct your own research and consider your risk tolerance before trading.*

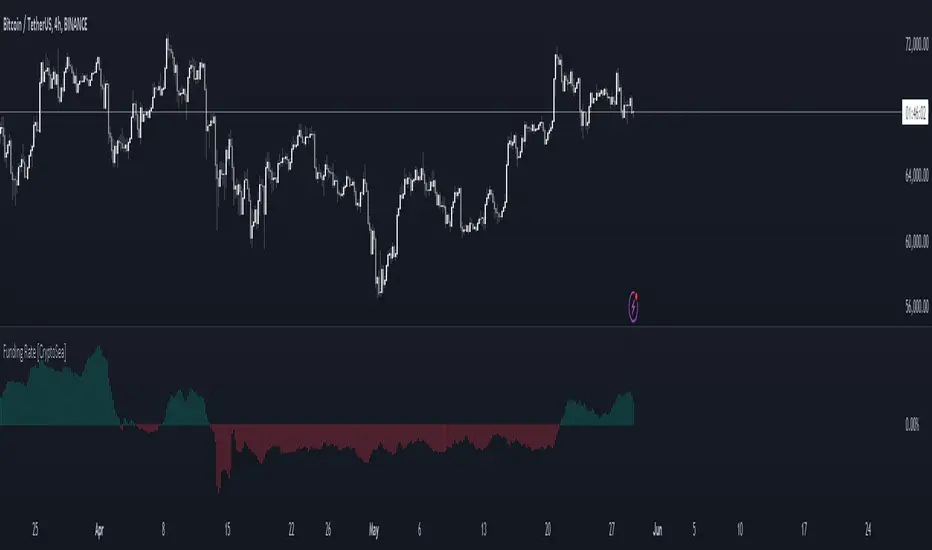
Funding Rate [CryptoSea]The Funding Rate Indicator by is a comprehensive tool designed to analyze funding rates across multiple cryptocurrency exchanges. This indicator is essential for traders who want to monitor funding rates and their impact on market trends.
Key Features
Exchange Coverage: Includes data from major exchanges such as Binance, Bitmex, Bybit, HTX, Kraken, OKX, Bitstamp, and Coinbase.
Perpetual Futures and Spot Markets: Fetches and analyzes pricing data from both perpetual futures and spot markets to provide a holistic view.
Smoothing and Customization: Allows users to smooth funding rates using a moving average, with customizable MA lengths for tailored analysis.
Dynamic Candle Coloring: Option to color candles based on trading conditions, enhancing visual analysis.
In the example below, the indicator shows how the funding rate shifts with market conditions, providing clear visual cues for bullish and bearish trends.
How it Works
Data Integration: Uses a secure security fetching function to retrieve pricing data while preventing look-ahead bias, ensuring accurate and reliable information.
TWAP Calculation: Computes Time-Weighted Average Prices (TWAP) for both perpetual futures and spot prices, forming the basis for funding rate calculations.
Funding Rate Calculation: Determines the raw funding rate by comparing TWAPs of perpetual futures and spot prices, then applies smoothing to highlight significant trends.
Color Coding: Highlights the funding rate with distinct colors (bullish and bearish), making it easier to interpret market conditions at a glance.
In the example below, the indicator effectively differentiates between bullish and bearish funding rates, aiding traders in making informed decisions based on current market dynamics.
Application
Market Analysis: Enables traders to analyze the impact of funding rates on market trends, facilitating more strategic decision-making.
Trend Identification: Assists in identifying potential market reversals by monitoring shifts in funding rates.
Customizable Settings: Provides extensive input settings for exchange selection, MA length, and candle coloring, allowing for personalized analysis.
The Funding Rate Indicator by is a powerful addition to any trader's toolkit, offering detailed insights into funding rates across multiple exchanges to navigate the cryptocurrency market effectively.
CME Gap Oscillator [CryptoSea]Introducing the CME Gap Oscillator , a pioneering tool designed to illuminate the significance of market gaps through the lens of the Chicago Mercantile Exchange (CME). By leveraging gap sizes in relation to the Average True Range (ATR), this indicator offers a unique perspective on market dynamics, particularly around the critical weekly close periods.
Key Features
Gap Measurement : At its core, the CME Oscillator quantifies the size of weekend gaps in the context of the market's volatility, using the ATR to standardize this measurement.
Dynamic Levels : Incorporating a dynamic extreme level calculation, the tool adapts to current market conditions, providing real-time insights into significant gap sizes and their implications.
Band Analysis : Through the introduction of upper and lower bands, based on standard deviations, traders can visually assess the oscillator's position relative to typical market ranges.
Enhanced Insights : A built-in table tracks the frequency of the oscillator's breaches beyond these bands within the latest CME week, offering a snapshot of recent market extremities.
Settings & Customisation
ATR-Based Measurement : Choose to measure gap sizes directly or in terms of ATR for a volatility-adjusted view.
Band Period Adjustability : Tailor the oscillator's sensitivity by modifying the band calculation period.
Dynamic Level Multipliers : Adjust the multiplier for dynamic levels to suit your analysis needs.
Visual Preferences : Customise the oscillator, bands, and table visuals, including color schemes and line styles.
In the example below, it demonstrates that the CME will want to return to the 0 value, this would be considered a reset or gap fill.
Application & Strategy
Deploy the CME Oscillator to enhance your market analysis
Market Sentiment : Gauge weekend market sentiment shifts through gap analysis, refining your strategy for the week ahead.
Volatility Insights : Use the oscillator's ATR-based measurements to understand the volatility context of gaps, aiding in risk management.
Trend Identification : Identify potential trend continuations or reversals based on the frequency and magnitude of gaps exceeding dynamic levels.
The CME Oscillator stands out as a strategic tool for traders focusing on gap analysis and volatility assessment. By offering a detailed breakdown of market gaps in relation to volatility, it empowers users with actionable insights, enabling more informed trading decisions across a range of markets and timeframes.

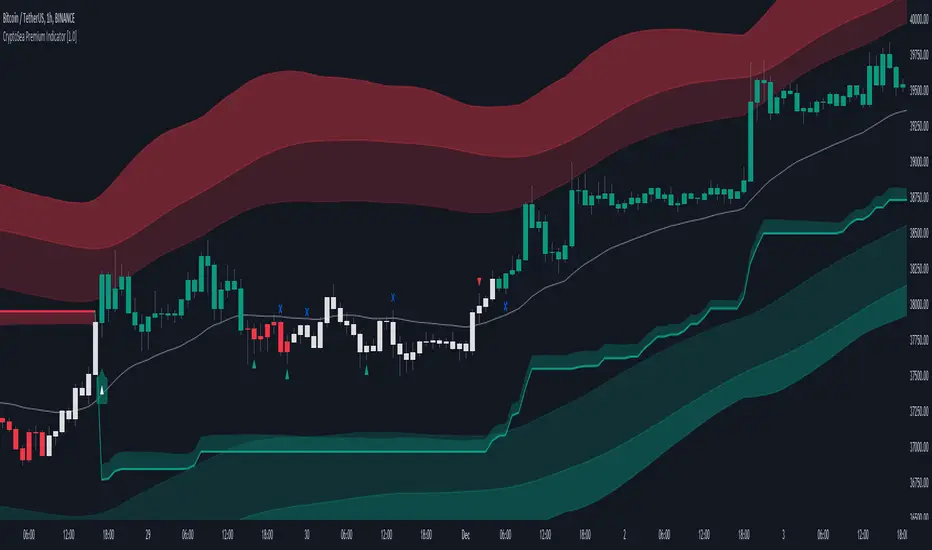
CryptoSea Premium IndicatorCryptoSea Premium Indicator: Enhanced Trading Precision through Advanced Integration
The CryptoSea Premium Indicator is designed to equip traders with a sophisticated tool that synthesizes traditional and modern analytical methods. By integrating proven technical tools with custom enhancements, it aims to provide a deeper, more actionable insight into market dynamics, enhancing the analysis and decision-making process for traders.
Integration and Unique Features:
Support and Resistance Dynamics: Leveraging a blend of standard deviation and moving averages akin to the methodology of Bollinger Bands, this feature dynamically identifies potential market pivot points. It calculates these points based on historical price volatility, which serves as a probabilistic guide to potential price movements, rather than a definitive prediction.
Trend Reversals and Continuations: This function integrates the Relative Strength Index (RSI) with a custom-tailored trend filter that employs shorter cycle moving averages to refine the traditional use of RSI. This enhancement is designed to pinpoint more accurate entry and exit points during trend phases by filtering out market noise and focusing on significant movements, though it does not ensure the avoidance of all false signals.
Smart Trail Closure and New Trends: Utilizing the Average True Range (ATR), this advanced feature dynamically adjusts stop-loss settings according to changes in market volatility. This adaptation seeks to better align stop-loss orders with current market realities, helping to protect against sudden market shifts while allowing traders to capitalize on new trends as they emerge.
Ranging Signals: By employing dual moving averages that calculate the upper and lower bounds of price movements, this feature refines the approach to range-bound trading. It uses statistical measures to adjust these bands in real-time based on the latest market data, enhancing traders' ability to make informed decisions during lateral market movements.
Dynamic Candles: This feature colors candles based on a complex algorithm that assesses immediate price action within the context of longer-term trends. This visual tool aims to simplify market sentiment analysis by providing intuitive color-coded feedback on the prevailing market conditions, thereby assisting traders in quickly assessing the market environment.
Scalping Signals: Generated by a high-frequency trading algorithm that scrutinizes short-term price fluctuations, these signals are designed to aid traders in making swift, informed trading decisions in fast-paced market conditions. They optimize the identification of micro-trends and potential reversal points essential for scalping strategies, though they do not guarantee success in every trade.
Originality and Practical Application:
Each component of the CryptoSea Premium Indicator is carefully selected and integrated to offer a tool that enhances more than the sum of its parts. This integration provides a comprehensive and nuanced view of the market, aiding traders in navigating complex market dynamics more effectively than traditional, single-function indicators.
Disclaimer and Usage Tips:
Trading involves risks. The CryptoSea Premium Indicator should be used as one of several tools in a comprehensive trading strategy. It is intended to supplement, not replace, thorough market analysis and personal due diligence. Past performance is not indicative of future results, and no claims are made regarding the guaranteed accuracy of provided signals.
Bitcoin 5A Strategy@LilibtcIn our long-term strategy, we have deeply explored the key factors influencing the price of Bitcoin. By precisely calculating the correlation between these factors and the price of Bitcoin, we found that they are closely linked to the value of Bitcoin. To more effectively predict the fair price of Bitcoin, we have built a predictive model and adjusted our investment strategy accordingly based on this model. In practice, the prediction results of this model correspond quite high with actual values, fully demonstrating its reliability in predicting price fluctuations.
When the future is uncertain and the outlook is unclear, people often choose to hold back and avoid risks, or even abandon their original plans. However, the prediction of Bitcoin is full of challenges, but we have taken the first step in exploring.
Table of contents:
Usage Guide
Step 1: Identify the factors that have the greatest impact on Bitcoin price
Step 2: Build a Bitcoin price prediction model
Step 3: Find indicators for warning of bear market bottoms and bull market tops
Step 4: Predict Bitcoin Price in 2025
Step 5: Develop a Bitcoin 5A strategy
Step 6: Verify the performance of the Bitcoin 5A strategy
Usage Restrictions
🦮Usage Guide:
1. On the main interface, modify the code, find the BTCUSD trading pair, and select the BITSTAMP exchange for trading.
2. Set the time period to the daily chart.
3. Select a logarithmic chart in the chart type to better identify price trends.
4. In the strategy settings, adjust the options according to personal needs, including language, display indicators, display strategies, display performance, display optimizations, sell alerts, buy prompts, opening days, backtesting start year, backtesting start month, and backtesting start date.
🏃Step 1: Identify the factors that have the greatest impact on Bitcoin price
📖Correlation Coefficient: A mathematical concept for measuring influence
In order to predict the price trend of Bitcoin, we need to delve into the factors that have the greatest impact on its price. These factors or variables can be expressed in mathematical or statistical correlation coefficients. The correlation coefficient is an indicator of the degree of association between two variables, ranging from -1 to 1. A value of 1 indicates a perfect positive correlation, while a value of -1 indicates a perfect negative correlation.
For example, if the price of corn rises, the price of live pigs usually rises accordingly, because corn is the main feed source for pig breeding. In this case, the correlation coefficient between corn and live pig prices is approximately 0.3. This means that corn is a factor affecting the price of live pigs. On the other hand, if a shooter's performance improves while another shooter's performance deteriorates due to increased psychological pressure, we can say that the former is a factor affecting the latter's performance.
Therefore, in order to identify the factors that have the greatest impact on the price of Bitcoin, we need to find the factors with the highest correlation coefficients with the price of Bitcoin. If, through the analysis of the correlation between the price of Bitcoin and the data on the chain, we find that a certain data factor on the chain has the highest correlation coefficient with the price of Bitcoin, then this data factor on the chain can be identified as the factor that has the greatest impact on the price of Bitcoin. Through calculation, we found that the 🔵number of Bitcoin blocks is one of the factors that has the greatest impact on the price of Bitcoin. From historical data, it can be clearly seen that the growth rate of the 🔵number of Bitcoin blocks is basically consistent with the movement direction of the price of Bitcoin. By analyzing the past ten years of data, we obtained a daily correlation coefficient of 0.93 between the number of Bitcoin blocks and the price of Bitcoin.
🏃Step 2: Build a Bitcoin price prediction model
📖Predictive Model: What formula is used to predict the price of Bitcoin?
Among various prediction models, the linear function is the preferred model due to its high accuracy. Take the standard weight as an example, its linear function graph is a straight line, which is why we choose the linear function model. However, the growth rate of the price of Bitcoin and the number of blocks is extremely fast, which does not conform to the characteristics of the linear function. Therefore, in order to make them more in line with the characteristics of the linear function, we first take the logarithm of both. By observing the logarithmic graph of the price of Bitcoin and the number of blocks, we can find that after the logarithm transformation, the two are more in line with the characteristics of the linear function. Based on this feature, we choose the linear regression model to establish the prediction model.
From the graph below, we can see that the actual red and green K-line fluctuates around the predicted blue and 🟢green line. These predicted values are based on fundamental factors of Bitcoin, which support its value and reflect its reasonable value. This picture is consistent with the theory proposed by Marx in "Das Kapital" that "prices fluctuate around values."
The predicted logarithm of the market cap of Bitcoin is calculated through the model. The specific calculation formula of the Bitcoin price prediction value is as follows:
btc_predicted_marketcap = math.exp(btc_predicted_marketcap_log)
btc_predicted_price = btc_predicted_marketcap / btc_supply
🏃Step 3: Find indicators for early warning of bear market bottoms and bull market tops
📖Warning Indicator: How to Determine Whether the Bitcoin Price has Reached the Bear Market Bottom or the Bull Market Top?
By observing the Bitcoin price logarithmic prediction chart mentioned above, we notice that the actual price often falls below the predicted value at the bottom of a bear market; during the peak of a bull market, the actual price exceeds the predicted price. This pattern indicates that the deviation between the actual price and the predicted price can serve as an early warning signal. When the 🔴 Bitcoin price deviation is very low, as shown by the chart with 🟩green background, it usually means that we are at the bottom of the bear market; Conversely, when the 🔴 Bitcoin price deviation is very high, the chart with a 🟥red background indicates that we are at the peak of the bull market.
This pattern has been validated through six bull and bear markets, and the deviation value indeed serves as an early warning signal, which can be used as an important reference for us to judge market trends.
🏃Step 4:Predict Bitcoin Price in 2025
📖Price Upper Limit
According to the data calculated on February 25, 2024, the 🟠upper limit of the Bitcoin price is $194,287, which is the price ceiling of this bull market. The peak of the last bull market was on November 9, 2021, at $68,664. The bull-bear market cycle is 4 years, so the highest point of this bull market is expected in 2025. That is where you should sell the Bitcoin. and the upper limit of the Bitcoin price will exceed $190,000. The closing price of Bitcoin on February 25, 2024, was $51,729, with an expected increase of 2.7 times.
🏃Step 5: Bitcoin 5A Strategy Formulation
📖Strategy: When to buy or sell, and how many to choose?
We introduce the Bitcoin 5A strategy. This strategy requires us to generate trading signals based on the critical values of the warning indicators, simulate the trades, and collect performance data for evaluation. In the Bitcoin 5A strategy, there are three key parameters: buying warning indicator, batch trading days, and selling warning indicator. Batch trading days are set to ensure that we can make purchases in batches after the trading signal is sent, thus buying at a lower price, selling at a higher price, and reducing the trading impact cost.
In order to find the optimal warning indicator critical value and batch trading days, we need to adjust these parameters repeatedly and perform backtesting. Backtesting is a method established by observing historical data, which can help us better understand market trends and trading opportunities.
Specifically, we can find the key trading points by watching the Bitcoin price log and the Bitcoin price deviation chart. For example, on August 25, 2015, the 🔴 Bitcoin price deviation was at its lowest value of -1.11; on December 17, 2017, the 🔴 Bitcoin price deviation was at its highest value at the time, 1.69; on March 16, 2020, the 🔴 Bitcoin price deviation was at its lowest value at the time, -0.91; on March 13, 2021, the 🔴 Bitcoin price deviation was at its highest value at the time, 1.1; on December 31, 2022, the 🔴 Bitcoin price deviation was at its lowest value at the time, -1.
To ensure that all five key trading points generate trading signals, we set the warning indicator Bitcoin price deviation to the larger of the three lowest values, -0.9, and the smallest of the two highest values, 1. Then, we buy when the warning indicator Bitcoin price deviation is below -0.9, and sell when it is above 1.
In addition, we set the batch trading days as 25 days to implement a strategy that averages purchases and sales. Within these 25 days, we will invest all funds into the market evenly, buying once a day. At the same time, we also sell positions at the same pace, selling once a day.
📖Adjusting the threshold: a key step to optimizing trading strategy
Adjusting the threshold is an indispensable step for better performance. Here are some suggestions for adjusting the batch trading days and critical values of warning indicators:
• Batch trading days: Try different days like 25 to see how it affects overall performance.
• Buy and sell critical values for warning indicators: iteratively fine-tune the buy threshold value of -0.9 and the sell threshold value of 1 exhaustively to find the best combination of threshold values.
Through such careful adjustments, we may find an optimized approach with a lower maximum drawdown rate (e.g., 11%) and a higher cumulative return rate for closed trades (e.g., 474 times). The chart below is a backtest optimization chart for the Bitcoin 5A strategy, providing an intuitive display of strategy adjustments and optimizations.
In this way, we can better grasp market trends and trading opportunities, thereby achieving a more robust and efficient trading strategy.
🏃Step 6: Validating the performance of the Bitcoin 5A Strategy
📖Model interpretability validation: How to explain the Bitcoin price model?
The interpretability of the model is represented by the coefficient of determination R squared, which reflects the degree of match between the predicted value and the actual value. I divided all the historical data from August 18, 2015 into two groups, and used the data from August 18, 2011 to August 18, 2015 as training data to generate the model. The calculation result shows that the coefficient of determination R squared during the 2011-2015 training period is as high as 0.81, which shows that the interpretability of this model is quite high. From the Bitcoin price logarithmic prediction chart in the figure below, we can see that the deviation between the predicted value and the actual value is not far, which means that most of the predicted values can explain the actual value well.
The calculation formula for the coefficient of determination R squared is as follows:
residual = btc_close_log - btc_predicted_price_log
residual_square = residual * residual
train_residual_square_sum = math.sum(residual_square, train_days)
train_mse = train_residual_square_sum / train_days
train_r2 = 1 - train_mse / ta.variance(btc_close_log, train_days)
📖Model stability verification: How to affirm the stability of the Bitcoin price model when new data is available?
Model stability is achieved through model verification. I set the last day of the training period to February 2, 2024 as the "verification group" and used it as verification data to verify the stability of the model. This means that after generating the model if there is new data, I will use these new data together with the model for prediction, and then evaluate the interpretability of the model. If the coefficient of determination when using verification data is close to the previous training one and both remain at a high level, then we can consider this model as stability. The coefficient of determination calculated from the validation period data and model prediction results is as high as 0.83, which is close to the previous 0.81, further proving the stability of this model.
📖Performance evaluation: How to accurately evaluate historical backtesting results?
After detailed strategy testing, to ensure the accuracy and reliability of the results, we need to carry out a detailed performance evaluation on the backtest results. The key evaluation indices include:
• Net value curve: As shown in the rose line, it intuitively reflects the growth of the account net value. By observing the net value curve, we can understand the overall performance and profitability of the strategy.
The basic attributes of this strategy are as follows:
Trading range: 2015-8-19 to 2024-2-18, backtest range: 2011-8-18 to 2024-2-18
Initial capital: 1000USD, order size: 1 contract, pyramid: 50 orders, commission rate: 0.2%, slippage: 20 markers.
In the strategy tester overview chart, we also obtained the following key data:
• Net profit rate of closed trades: as high as 474 times, far exceeding the benchmark, as shown in the strategy tester performance summary chart, Bitcoin buys and holds 210 times.
• Number of closed trades and winning percentage: 100 trades were all profitable, showing the stability and reliability of the strategy.
• Drawdown rate & win-loose ratio: The maximum drawdown rate is only 11%, far lower than Bitcoin's 78%. Profit factor, or win-loose ratio, reached 500, further proving the advantage of the strategy.
Through these detailed evaluations, we can see clearly the excellent balance between risk and return of the Bitcoin 5A strategy.
⚠️Usage Restrictions: Strategy Application in Specific Situations
Please note that this strategy is designed specifically for Bitcoin and should not be applied to other assets or markets without authorization. In actual operations, we should make careful decisions according to our risk tolerance and investment goals.
