Turtle Soup ICT Strategy [TradingFinder] FVG + CHoCH/CSD🔵 Introduction
The ICT Turtle Soup trading setup, designed in the ICT style, operates by hunting or sweeping liquidity zones to exploit false breakouts and failed breakouts in key liquidity Zones, such as recent highs, lows, or major support and resistance levels.
This setup identifies moments when the price breaches these liquidity zones, triggering stop orders placed (Stop Hunt) by other traders, and then quickly reverses direction. These movements are often associated with liquidity sweeps that create temporary market imbalances.
The reversal is typically confirmed by one of three structural shifts : a Market Structure Shift (MSS), a Change of Character (CHoCH), or a break of the Change in State of Delivery (CISD). Each of these structural shifts provides a reliable signal to interpret market intent and align trading decisions with the expected price movement. After the structural shift, the price frequently pullback to a Fair Value Gap (FVG), offering a precise entry point for trades.
By integrating key concepts such as liquidity, liquidity sweeps, stop order activation, structural shifts (MSS, CHoCH, CISD), and price imbalances, the ICT Turtle Soup setup enables traders to identify reversal points and key entry zones with high accuracy.
This strategy is highly versatile, making it applicable across markets such as forex, stocks, cryptocurrencies, and futures. It offers traders a robust and systematic approach to understanding price movements and optimizing their trading strategies
🟣 Bullish and Bearish Setups
Bullish Setup : The price first sweeps below a Sell-Side Liquidity (SSL) zone, then reverses upward after forming an MSS or CHoCH, and finally pulls back to an FVG, creating a buying opportunity.
Bearish Setup : The price first sweeps above a Buy-Side Liquidity (BSL) zone, then reverses downward after forming an MSS or CHoCH, and finally pulls back to an FVG, creating a selling opportunity.
🔵 How to Use
To effectively utilize the ICT Turtle Soup trading setup, begin by identifying key liquidity zones, such as recent highs, lows, or support and resistance levels, in higher timeframes.
Then, monitor lower timeframes for a Liquidity Sweep and confirmation of a Market Structure Shift (MSS) or Change of Character (CHoCH).
After the structural shift, the price typically pulls back to an FVG, offering an optimal trade entry point. Below, the bullish and bearish setups are explained in detail.
🟣 Bullish Turtle Soup Setup
Identify Sell-Side Liquidity (SSL) : In a higher timeframe (e.g., 1-hour or 4-hour), identify recent price lows or support levels that serve as SSL zones, typically the location of stop-loss orders for traders.
Observe a Liquidity Sweep : On a lower timeframe (e.g., 15-minute or 30-minute), the price must move below one of these liquidity zones and then reverse. This movement indicates a liquidity sweep.
Confirm Market Structure Shift : After the price reversal, look for a structural shift (MSS or CHoCH) indicated by the formation of a Higher Low (HL) and Higher High (HH).
Enter the Trade : Once the structural shift is confirmed, the price typically pulls back to an FVG. Enter a buy trade in this zone, set a stop-loss slightly below the recent low, and target Buy-Side Liquidity (BSL) in the higher timeframe for profit.
🟣 Bearish Turtle Soup Setup
Identify Buy-Side Liquidity (BSL) : In a higher timeframe, identify recent price highs or resistance levels that serve as BSL zones, typically the location of stop-loss orders for traders.
Observe a Liquidity Sweep : On a lower timeframe, the price must move above one of these liquidity zones and then reverse. This movement indicates a liquidity sweep.
Confirm Market Structure Shift : After the price reversal, look for a structural shift (MSS or CHoCH) indicated by the formation of a Lower High (LH) and Lower Low (LL).
Enter the Trade : Once the structural shift is confirmed, the price typically pulls back to an FVG. Enter a sell trade in this zone, set a stop-loss slightly above the recent high, and target Sell-Side Liquidity (SSL) in the higher timeframe for profit.
🔵 Settings
Higher TimeFrame Levels : This setting allows you to specify the higher timeframe (e.g., 1-hour, 4-hour, or daily) for identifying key liquidity zones.
Swing period : You can set the swing detection period.
Max Swing Back Method : It is in two modes "All" and "Custom". If it is in "All" mode, it will check all swings, and if it is in "Custom" mode, it will check the swings to the extent you determine.
Max Swing Back : You can set the number of swings that will go back for checking.
FVG Length : Default is 120 Bar.
MSS Length : Default is 80 Bar.
FVG Filter : This refines the number of identified FVG areas based on a specified algorithm to focus on higher quality signals and reduce noise.
Types of FVG filter s:
Very Aggressive Filter: Adds a condition where, for an upward FVG, the last candle's highest price must exceed the middle candle's highest price, and for a downward FVG, the last candle's lowest price must be lower than the middle candle's lowest price. This minimally filters out FVGs.
Aggressive Filter: Builds on the Very Aggressive mode by ensuring the middle candle is not too small, filtering out more FVGs.
Defensive Filter: Adds criteria regarding the size and structure of the middle candle, requiring it to have a substantial body and specific polarity conditions, filtering out a significant number of FVGs.
Very Defensive Filter: Further refines filtering by ensuring the first and third candles are not small-bodied doji candles, retaining only the highest quality signals.
In the indicator settings, you can customize the visibility of various elements, including MSS, FVG, and HTF Levels. Additionally, the color of each element can be adjusted to match your preferences. This feature allows traders to tailor the chart display to their specific needs, enhancing focus on the key data relevant to their strategy.
🔵 Conclusion
The ICT Turtle Soup trading setup is a powerful tool in the ICT style, enabling traders to exploit false breakouts in key liquidity zones. By combining concepts of liquidity, liquidity sweeps, market structure shifts (MSS and CHoCH), and pullbacks to FVG, this setup helps traders identify precise reversal points and execute trades with reduced risk and increased accuracy.
With applications across various markets, including forex, stocks, crypto, and futures, and its customizable indicator settings, the ICT Turtle Soup setup is ideal for both beginner and advanced traders. By accurately identifying liquidity zones in higher timeframes and confirming structure shifts in lower timeframes, this setup provides a reliable strategy for navigating volatile market conditions.
Ultimately, success with this setup requires consistent practice, precise market analysis, and proper risk management, empowering traders to make smarter decisions and achieve their trading goals.
Buysellsignal

MACD Buy/Sell Labels + Barcolor👉 MACD Buy/Sell Labels + Barcolor
This advanced indicator combines the functionality of the MACD (Moving Average Convergence Divergence) with intuitive and customizable visual features, making it ideal for traders looking for an efficient tool to confirm buy and sell signals across any market.
It is based on the logical interpretation of a modified oscillator to improve its performance and simplify its usage. The indicator integrates seamlessly into the chart, offering an intuitive and easy-to-understand experience.
📍 Labels (Buy/Sell):
The signals are generated automatically by crossovers between the Fast EMA and Slow EMA of the Gaussian MACD. It comes with a default configuration designed to favor clean crossovers while avoiding false signals.
🧪 Barcolor:
The color of the candles dynamically changes according to the range of the Gaussian MACD histogram. This allows for a clear visualization of the MACD's status without needing to display the full oscillator. This feature integrates with the labels, as explained in the "Interpretation" section, to significantly increase their probability of success. Both the ranges and colors are fully customizable through the settings panel.
⚙️ Settings:
All aspects of the indicator can be customized:
1-MACD: Like a standard MACD, you can adjust the EMA lengths and the signal smoothing to adapt it to your trading style and the markets you trade.
2-Barcolor: The predefined values highlight extreme levels for proper interpretation, as explained in the "Interpretation" section. However, intermediate levels are also included in case you want to implement them in your strategy. You can adjust these values based on what you consider "overbought" or "oversold." This flexibility allows adaptation to various assets, as oscillator behavior varies across different instruments.
3-Buy/Sell Filter:
The filter settings allow you to further refine the signals. The default values of -70 (Buy Filter) and 80 (Sell Filter) work best for me, but you can adjust them as you see fit. Keep in mind:
-Higher distance from zero: More filtered signals (fewer, but higher quality).
-Closer to zero: Less filtered signals (more frequent, but with increased risk of false signals).
🤔 Interpretation:
As mentioned earlier, this follows the classic interpretation of a MACD oscillator: overbought/oversold levels combined with crossovers. However, the barcolor variable is what makes this indicator truly unique.
With barcolor, you can detect potential divergences and confirm them using the labels. When the oscillator reaches an extreme zone, barcolor provides a visual alert. Once the oscillator exits this zone, the candles revert to their normal color. This signals that the oscillator is dropping. If the price continues rising, this divergence can indicate an anomaly in the market. Waiting for confirmation from the label increases the probability of successful trades while detecting unusual market deviations without even looking at the oscillator.
Purpose:
This indicator is designed to help traders simplify the interpretation of the MACD. It can be used on any timeframe, but it was primarily tested using technical analysis concepts and basic liquidity principles. Its effectiveness improves significantly if you understand broader market dynamics.
Disclaimer:
This is purely an analytical tool and should NOT be considered as trading signals. Perform your own research and make decisions based solely on your responsibility. Thank you!

Up and Downwhat is "Up and Down"?
It is an indicator designed to show you in detail on the chart and warn you when there is an increase or decrease in the market at a level that you consider important.
what it does?
When the price difference between a top and bottom is greater than the level you selected (the default input is 10 percent), it indicates this along with the percentage value on the chart. Then, it indicates the start and end points with lines so that you can see the change from where to where. It shows the price's current percentage distance from the last bottom or top in the upper right corner.
it also colors the candles so you can better understand how fast the price is moving. The greener the candles, the stronger the rise, and conversely, the greater the decline, the redder the candles. Of course, if you set an alarm, it will tell you in which trading pair, in which time period, at what percentage and in which direction there is a movement.
how it does it?
It uses a moving average with a short length to find bottoms and tops. It then measures the distance from the last peak to the bottom and expresses it as a percentage. It uses momentum using the moving average as a source to paint the candles. To compress this momentum between the values 255 and 0, I used a formula that I also used in my limited fisher transform work (because the inputs in the color.rgb function take values between 0 and 255). It was a bit challenging to use the lines correctly, but with the "ta.valuewhen" function and a little experimenting, they were I made sure they were drawn correctly.
how to use it?
It is quite simple to use. First, select the minimum interval you want to receive alarms. If you make this value too high, you will not receive any alarms; if you make it too low, you will receive too many alarms. Choose the range that will benefit you most for the trading pair you are using. Then all you have to do is set an alarm. When you set an alarm, leave the note section blank and the indicator will send you the necessary information.

Dynamic RSI with Overbought/Oversold LinesDynamic RSI with Overbought/Oversold Lines
This indicator enhances the traditional RSI (Relative Strength Index) by dynamically adjusting the overbought and oversold levels based on the highest and lowest RSI values over a user-defined period. The indicator plots these levels as horizontal lines, allowing traders to visually identify when the market is "overbought" or "oversold."
Features:
Dynamic Overbought/Oversold Levels: Automatically adjusts the overbought and oversold levels based on the highest and lowest RSI values within the defined period, ensuring more accurate signals tailored to the current market conditions.
Customizable RSI Period: Choose your preferred RSI period to suit your trading strategy.
Signal Alerts: Visual signals are displayed when the RSI crosses into the overbought or oversold zone, indicating potential reversal points.
Background Color Alerts: The background changes color when the RSI exceeds overbought or oversold levels, making it easier to spot these important zones at a glance.
Clean and Simple: A minimalist design focusing on the key elements, making it suitable for all traders.
How to Use:
Overbought Zone: When the RSI moves above the overbought line (red), it may indicate that the asset is overbought, signaling a potential price reversal or pullback.
Oversold Zone: When the RSI moves below the oversold line (green), it may indicate that the asset is oversold, signaling a potential price bounce or reversal.
This dynamic RSI indicator is perfect for those looking to capture market extremes and improve their trading decisions. It's especially useful for timeframes like 30-minute and 1-hour charts, where market conditions tend to shift more rapidly.

Samih Signal AV V2The Samih Signal VA indicator is built for traders who prioritize technical analysis to determine market entry and exit points. It combines signals based on volume, moving averages, the Volume Weighted Average Price (VWAP), and identifies specific candlestick patterns, such as the Pin Bar and Inside Bar. This indicator assists in spotting optimal moments to buy or sell by analyzing trends, volume activity, and nearby liquidity zones.
Parameters and Features:
Simple Moving Average (MA) and VWAP:
Samih Signal VA uses a 50-period simple moving average for trend identification, paired with VWAP to refine price analysis with volume-weighted data.
Together, these components reveal whether the market is trending upward or downward, strengthening the reliability of entry and exit signals.
Volume Threshold:
A volume filter is applied by calculating a 20-period moving average, then setting a threshold at 1.2 times this average volume. This filter helps prevent false signals, focusing only on periods of increased market interest.
Candlestick Pattern Recognition:
Pin Bar: Detects this popular reversal/continuation pattern in both bullish and bearish scenarios, indicating potential entry or exit points.
Inside Bar: Identifies this pattern, which represents a moment of price compression and indecision, often preceding a breakout.
Trend Identification:
The indicator defines an uptrend when the price remains above both the MA and VWAP. A downtrend is confirmed when the price stays below these indicators.
Liquidity Zone Detection:
Samih Signal VA includes a feature to approximate liquidity zones, identifying recent support and resistance levels. Recognizing when prices approach these areas enhances the accuracy of buy or sell signals.
Buy and Sell Signal Logic:
Buy Signal: Triggered when a bullish Pin Bar or Inside Bar appears in an uptrend with high volume and proximity to a liquidity zone.
Sell Signal: Generated when a bearish Pin Bar or Inside Bar is detected in a downtrend with high volume, near a liquidity zone.
Signal Display on the Chart:
The indicator marks buy signals with a green “BUY” label below the bar, and sell signals with a red “SELL” label above the bar, directly on the chart for immediate clarity.
Summary:
The Samih Signal VA is suited for traders focused on precise entries and exits, integrating trend analysis, volume metrics, and candlestick patterns. By identifying liquidity zones, this indicator reduces the likelihood of false signals and provides clear buy and sell alerts.
This description can be easily added to TradingView to help users understand the features and decision-making logic of the Samih Signal VA indicator. Let me know if you’d like any additional adjustments!
Enhanced Pressure MTF ScreenerEnhanced Pressure Multi-Timeframe (MTF) Screener Indicator
Overview
The Enhanced Pressure MTF Screener is an add-on that extends the capabilities of the Enhanced Buy/Sell Pressure, Volume, and Trend Bar Analysis . It provides a clear and consolidated view of buy/sell pressure across multiple timeframes. This indicator allows traders to determine when different timeframes are synchronized in the same trend direction, which is particularly useful for making high-confidence trading decisions.
Image below: is the Enhanced Buy/Sell Pressure, Volume, and Trend Bar Analysis with the Enhanced Pressure MTF Screener indicator both active together.
Key Features
1.Multi-Timeframe Analysis
The indicator screens various predefined timeframes (from 1 week down to 10 minutes).
It offers a table view that shows buy or sell ratings for each timeframe, making it easy to see which timeframes are aligned.
Traders can choose which timeframes to include based on their trading strategies (e.g., higher timeframes for position trading, lower timeframes for scalping).
2.Pressure and Trend Calculation
Uses Buy and Sell Pressure calculations from the Enhanced Buy/Sell Pressure indicator to determine whether buying or selling is dominant in each timeframe.
By analyzing pressures on multiple timeframes, the indicator gives a comprehensive perspective of the current market sentiment.
The indicator calculates whether a move is strong based on user-defined thresholds, which are displayed in the form of additional signals.
3.Heikin Ashi Option
The Heikin Ashi candle type can be toggled on or off. Using Heikin Ashi helps smooth out market noise and provides a clearer indication of trend direction.
This is particularly helpful for traders who want to filter out market noise and focus on the primary trend.
4.Table Customization
Table Positioning: The table showing timeframe data can be positioned at different locations on the chart—top, middle, or bottom.
Text and Alignment: The alignment and text size of the table can be customized for better visual clarity.
Color Settings: Users can choose specific colors to indicate buying and selling pressure across timeframes, making it easy to interpret.
5.Strong Movement Indicators
The screener provides an additional visual cue (🔥) for timeframes where the movement is deemed strong, based on a user-defined threshold.
This helps highlight timeframes where significant buying or selling pressure is present, which could signal potential trading opportunities.
How the Screener Works
1.Pressure Calculation
For each selected timeframe, the indicator retrieves the Open, High, Low, and Close (OHLC) values.
It calculates buy pressure (the range between high and low when the closing price is higher than the opening) and sell pressure (the range between high and low when the closing price is equal to or lower than the opening).
The screener computes the pressure ratio, which represents the difference between buying and selling pressure, to determine which side is dominant.
2.Trend Rating and Signal Generation
Based on the calculated pressure, the screener determines a trend rating for each timeframe: "Buy," "Sell," or "Neutral." (▲ ,▼ or •)
Additionally, it generates a signal (▲ or ▼) to indicate the current trend direction and whether the move is strong (based on the user-defined threshold).
If the movement is strong, a fire icon (🔥) is added to indicate that there is significant pressure on that timeframe, signaling a higher confidence in the trend.
3.Customizable Strong Move Thresholds
Strong Move Threshold: The screener uses this value to decide whether a trend is significantly strong. A higher value makes it more selective in determining strong moves.
Strong Movement Threshold: Helps determine when an additional strong signal should be displayed, offering further insight into the strength of market movement.
Inputs and Customization
The Enhanced Pressure MTF Screener is highly customizable to fit the needs of individual traders:
General Settings:
Use Heikin Ashi: Toggle this setting to use Heikin Ashi for a smoother trend representation.
Strong Move Threshold: Defines how strong a move should be to be considered significant.
Strong Movement Threshold: Specifies the level of pressure required to highlight a move with the fire icon.
Table Settings:
Position: Choose the vertical position of the screener table (top, middle, or bottom of the chart).
Alignment: Align the table (left, center, or right) to best suit your chart layout.
Text Size: Adjust the text size in the table for better readability.
Table Color Settings:
Users can set different colors to represent buying and selling signals for better visual clarity, particularly when scanning multiple timeframes.
Timeframe Settings:
The screener provides options to include up to ten different timeframes. Traders can select and customize each timeframe to match their strategy.
Examples of available timeframes include 1 Week, 1 Day, 12 Hours, down to 10 Minutes, allowing for both broad and detailed analysis.
Practical Use Case
Identifying Trend Alignment Across Timeframes:
Imagine you are about to take a long trade but want to make sure that the trend direction is aligned across multiple timeframes.
The screener displays "Buy" ratings across the 4H, 1H, 30M, and 10M timeframes, while higher timeframes (like 1W and 1D) also show "Buy" with strong signals (🔥). This indicates that buying pressure is strong across the board, adding confidence to your trade.
Spotting Reversal Opportunities:
If a downtrend is evident across most timeframes but suddenly a higher timeframe, such as 12H, changes to "Buy" while showing a strong move (🔥), this could indicate a potential reversal.
The screener allows you to spot these discrepancies and consider taking early action.
Benefits for Traders
1.Synchronization Across Timeframes:
One of the main strengths of this screener is its ability to show synchronized buy/sell signals across different timeframes. This makes it easy to confirm the strength and consistency of a trend.
For example, if you see that all the selected timeframes display "Buy," this implies that both short-term and long-term traders are favoring the upside, giving additional confidence to go long.
2.Quick and Visual Trend Overview:
The table offers an at-a-glance summary, reducing the time required to manually inspect each timeframe.
This makes it particularly useful for traders who want to make quick decisions, such as day traders or scalpers.
3.Strong Move Indicator:
The use of fire icons (🔥) provides an easy way to identify significant movements. This is particularly helpful for traders looking for breakouts or strong market conditions that could lead to high probability trades.
To put it short or to summarize
The Enhanced Pressure MTF Screener is a powerful add-on for traders looking to understand how buy and sell pressure aligns across multiple timeframes. It offers:
A clear summary of buying or selling pressure across different timeframes.
Heikin Ashi smoothing, providing an option to reduce market noise.
Strong movement signals to highlight significant trading opportunities.
Customizable settings to fit any trading strategy or style.
The screener and the main indicator are best used together, as the screener provides the multi-timeframe overview, while the main indicator provides an in-depth look at each individual bar and trend.
I hope my indicator helps with your trading, if you guys have any ideas or questions there is the comment section :D

Stoch RSI and RSI Buy/Sell Signals with MACD Trend FilterDescription of the Indicator
This Pine Script is designed to provide traders with buy and sell signals based on the combination of Stochastic RSI, RSI, and MACD indicators, enhanced by the confirmation of candle colors. The primary goal is to facilitate informed trading decisions in various market conditions by utilizing different indicators and their interactions. The script allows customization of various parameters, providing flexibility for traders to adapt it to their specific trading styles.
Usefulness
This indicator is not just a mashup of existing indicators; it integrates the functionality of multiple momentum and trend-detection methods into a cohesive trading tool. The combination of Stochastic RSI, RSI, and MACD offers a well-rounded approach to analyzing market conditions, allowing traders to identify entry and exit points effectively. The inclusion of color-coded signals (strong vs. weak) further enhances its utility by providing visual cues about the strength of the signals.
How to Use This Indicator
Input Settings: Adjust the parameters for the Stochastic RSI, RSI, and MACD to fit your trading style. Set the overbought/oversold levels according to your risk tolerance.
Signal Colors:
Strong Buy Signal: Indicated by a green label and confirmed by a green candle (close > open).
Weak Buy Signal: Indicated by a blue label and confirmed by a green candle (close > open).
Strong Sell Signal: Indicated by a red label and confirmed by a red candle (close < open).
Weak Sell Signal: Indicated by an orange label and confirmed by a red candle (close < open).
Example Trading Strategy Using This Indicator
To effectively use this indicator as part of your trading strategy, follow these detailed steps:
Setup:
Timeframe : Select a timeframe that aligns with your trading style (e.g., 15-minute for intraday, 1-hour for swing trading, or daily for longer-term positions).
Indicator Settings : Customize the Stochastic RSI, RSI, and MACD parameters to suit your trading approach. Adjust overbought/oversold levels to match your risk tolerance.
Strategy:
1. Strong Buy Entry Criteria :
Wait for a strong buy signal (green label) when the RSI is at or below the oversold level (e.g., ≤ 35), indicating a deeply oversold market. Confirm that the MACD shows a decreasing trend (bearish momentum weakening) to validate a potential reversal. Ensure the current candle is green (close > open) if candle color confirmation is enabled.
Example Use : On a 1-hour chart, if the RSI drops below 35, MACD shows three consecutive bars of decreasing negative momentum, and a green candle forms, enter a buy position. This setup signals a robust entry with strong momentum backing it.
2. Weak Buy Entry Criteria :
Monitor for weak buy signals (blue label) when RSI is above the oversold level but still below the neutral (e.g., between 36 and 50). This indicates a market recovering from an oversold state but not fully reversing yet. These signals can be used for early entries with additional confirmations, such as support levels or higher timeframe trends.
Example Use : On the same 1-hour chart, if RSI is at 45, the MACD shows momentum stabilizing (not necessarily negative), and a green candle appears, consider a partial or cautious entry. Use this as an early warning for a potential bullish move, especially when higher timeframe indicators align.
3. Strong Sell Entry Criteria :
Look for a strong sell signal (red label) when RSI is at or above the overbought level (e.g., ≥ 65), signaling a strong overbought condition. The MACD should show three consecutive bars of increasing positive momentum to indicate that the bullish trend is weakening. Ensure the current candle is red (close < open) if candle color confirmation is enabled.
Example Use : If RSI reaches 70, MACD shows increasing momentum that starts to level off, and a red candle forms on a 1-hour chart, initiate a short position with a stop loss set above recent resistance. This is a high-confidence signal for potential price reversal or pullback.
4. Weak Sell Entry Criteria :
Use weak sell signals (orange label) when RSI is between the neutral and overbought levels (e.g., between 50 and 64). These can indicate potential short opportunities that might not yet be fully mature but are worth monitoring. Look for other confirmations like resistance levels or trendline touches to strengthen the signal.
Example Use : If RSI reads 60 on a 1-hour chart, and the MACD shows slight positive momentum with signs of slowing down, place a cautious sell position or scale out of existing long positions. This setup allows you to prepare for a possible downtrend.
Trade Management:
Stop Loss : For buy trades, place stop losses below recent swing lows. For sell trades, set stops above recent swing highs to manage risk effectively.
Take Profit : Target nearby resistance or support levels, apply risk-to-reward ratios (e.g., 1:2), or use trailing stops to lock in profits as price moves in your favor.
Confirmation : Align these signals with broader trends on higher timeframes. For example, if you receive a weak buy signal on a 15-minute chart, check the 1-hour or daily chart to ensure the overall trend is not bearish.
Real-World Example: Imagine trading on a 15-minute chart :
For a buy:
A strong buy signal (green) appears when the RSI dips to 32, MACD shows declining bearish momentum, and a green candle forms. Enter a buy position with a stop loss below the most recent support level.
Alternatively, a weak buy signal (blue) appears when RSI is at 47. Use this as a signal to start monitoring the market closely or enter a smaller position if other indicators (like support and volume analysis) align.
For a sell:
A strong sell signal (red) with RSI at 72 and a red candle signals to short with conviction. Place your stop loss just above the last peak.
A weak sell signal (orange) with RSI at 62 might prompt caution but can still be acted on if confirmed by declining volume or touching a resistance level.
These strategies show how to blend both strong and weak signals into your trading for more nuanced decision-making.
Technical Analysis of the Code
1. Stochastic RSI Calculation:
The script calculates the Stochastic RSI (stochRsiK) using the RSI as input and smooths it with a moving average (stochRsiD).
Code Explanation : ta.stoch(rsi, rsi, rsi, stochLength) computes the Stochastic RSI, and ta.sma(stochRsiK, stochSmoothing) applies smoothing.
2. RSI Calculation :
The RSI is computed over a user-defined period and checks for overbought or oversold conditions.
Code Explanation : rsi = ta.rsi(close, rsiLength) calculates RSI values.
3. MACD Trend Filter :
MACD is calculated with fast, slow, and signal lengths, identifying trends via three consecutive bars moving in the same direction.
Code Explanation : = ta.macd(close, macdLengthFast, macdLengthSlow, macdSignalLength) sets MACD values. Conditions like macdLine < macdLine confirm trends.
4. Buy and Sell Conditions :
The script checks Stochastic RSI, RSI, and MACD values to set buy/sell flags. Candle color filters further confirm valid entries.
Code Explanation : buyConditionMet and sellConditionMet logically check all conditions and toggles (enableStochCondition, enableRSICondition, etc.).
5. Signal Flags and Confirmation :
Flags track when conditions are met and ensure signals only appear on appropriate candle colors.
Code Explanation : Conditional blocks (if statements) update buyFlag and sellFlag.
6. Labels and Alerts :
The indicator plots "BUY" or "SELL" labels with the RSI value when signals trigger and sets alerts through alertcondition().
Code Explanation : label.new() displays the signal, color-coded for strength based on RSI.
NOTE : All strategies can be enabled or disabled in the settings, allowing traders to customize the indicator to their preferences and trading styles.

Weekly RSI Buy/Sell SignalsWeekly RSI Buy/Sell Signal Indicator
This indicator is designed to help traders identify high-probability buy and sell opportunities on the weekly chart by using the Relative Strength Index (RSI). By utilizing weekly RSI values, this indicator ensures signals align with broader market trends, providing a clearer view of potential price reversals and continuation.
How It Works:
Weekly RSI Calculation: This script calculates the RSI using a 14-period setting, focusing on the weekly timeframe regardless of the user’s current chart view. The weekly RSI is derived using request.security, allowing for consistent signals even on intraday charts.
Signal Conditions:
Buy Signal: A buy signal appears when the RSI crosses above the oversold threshold of 30, suggesting that price may be gaining momentum after a potential bottom.
Sell Signal: A sell signal triggers when the RSI crosses below the overbought threshold of 70, indicating a possible momentum shift downwards.
Visual Cues:
Buy/Sell Markers: Clear green "BUY" and red "SELL" markers are displayed on the chart when buy or sell conditions are met, making it easy to identify entry and exit points.
RSI Line and Thresholds: The weekly RSI value is plotted in real time with color-coded horizontal lines at 30 (oversold) and 70 (overbought), providing a visual reference for key levels.
This indicator is ideal for traders looking for reliable, trend-based signals on higher timeframes and can be a helpful tool for filtering out shorter-term market noise.

Hermes Reg FIBONACCI V.4Hermes Reg Fibonacci V.4 Indicator User Guide
Overview
The Hermes Reg Fibonacci V.4 indicator is a versatile tool used for identifying market trends and channels. This indicator analyzes price movements using logarithmic regression and Fibonacci levels, helping users determine the direction of the trend and identify support/resistance levels.
Parameters and Inputs
Source: The price data to be used in the calculations of the indicator. The default is the close price.
Length: The period length for the calculations of the indicator. The default is 262 and the minimum value is 10.
Deviation Multiplier (devlen): Set to 1.6.
Extend Lines: Determines whether the lines should be extended to the right of the chart.
Show Fibonacci Levels: Determines whether Fibonacci levels should be displayed.
Show Broken Channel: Determines whether to display the broken channel lines.
Up Trend Color (upcol): The color of the uptrend line.
Down Trend Color (dncol): The color of the downtrend line.
Fibonacci Up Trend Color (fibupcol): The color of the Fibonacci uptrend line.
Fibonacci Down Trend Color (fibdncol): The color of the Fibonacci downtrend line.
Channel Line Width (widt): The width of the channel line.
Fibonacci Line Width (fibwidt): The width of the Fibonacci line.
Working Mechanism of the Indicator
Logarithmic Source and Regression Channel Calculations:
The indicator takes the logarithm of the price data and calculates the logarithmic regression channel.
It calculates the middle line of the channel, slope, and the starting and ending points.
The standard deviation and the upper/lower boundaries of the channel are determined.
Channel and Fibonacci Levels:
Depending on user preferences, channel lines and Fibonacci levels are drawn on the chart.
Channel lines and Fibonacci levels are dynamically updated based on the slope and price movement.
When the channel is broken, it is displayed with the specified color and style.
Trend Direction and Alert Conditions:
The direction of the trend is determined based on whether the slope is positive or negative.
Alert conditions are defined for trend changes and channel breaks.
Symbols indicating the trend direction are displayed on the chart.
Usage Recommendations
Trend Following: The Hermes Reg Fibonacci V.4 indicator can be used to determine the current trend direction and identify potential trend reversal points.
Support and Resistance Levels: The indicator helps identify support and resistance levels by observing how the price moves within the channel.
Fibonacci Analysis: Fibonacci levels can be used to identify potential retracement and extension points.
Alerts and Notifications: Set alerts for trend changes and channel breaks to avoid missing important price movements.
The Hermes Reg Fibonacci V.4 indicator, with its user-friendly interface and flexible parameters, can be effectively used in different market conditions. By customizing the indicator, you can tailor it to suit your trading strategy.

Memecoin TrackerMemecoin Z-Score Tracker with Buy/Sell Table - Technical Explanation
How it Works:
This indicator calculates the Z-scores of various memecoins based on their price movements, using historical funding rates across multiple exchanges. A Z-score measures the deviation of the current price from its moving average, expressed in standard deviations. This provides insight into whether a coin is overbought (positive Z-score) or oversold (negative Z-score) relative to its recent history.
Key Components:
- Z-Score Calculation
- The lookback period is dynamically adjusted based on the chart’s timeframe to ensure consistency across different time intervals:
- For lower timeframes (e.g., minutes), the base lookback period is scaled to match approximately 240 minutes.
- For daily and higher timeframes, the base lookback period is fixed (e.g., 14 bars).
Memecoin Selection:
The indicator tracks several popular memecoins, including DOGE, SHIB, PEPE, FLOKI, and others.
Funding rates are fetched from exchanges like Binance, Bybit, and MEXC using the request.security() function, ensuring accurate real-time price data.
Thresholds for Buy/Sell Signals:
Users can set custom Z-score thresholds for buy (oversold) and sell (overbought) signals:
Default upper threshold: 2.5 (indicates overbought condition).
Default lower threshold: -2.5 (indicates oversold condition).
When a memecoin’s Z-score crosses above or below these thresholds, it signals potential buy or sell conditions.
Buy/Sell Table:
A table with two columns (BUY and SELL) is dynamically populated with memecoins that are currently oversold (buy signal) or overbought (sell signal).
Each column can hold up to 20 entries, providing a clear overview of current market opportunities.
Visual Feedback:
The Z-scores of each memecoin are plotted as a line on the chart, with color-coded feedback:
Red for overbought (Z-score > upper threshold),
Green for oversold (Z-score < lower threshold),
Other colors indicate neutral conditions.
Horizontal lines representing the upper and lower thresholds are plotted for reference.
How to Use It:
Adjust Thresholds:
You can modify the upper and lower Z-score thresholds in the settings to customize sensitivity. Lower thresholds will increase the likelihood of triggering buy/sell signals for smaller price deviations, while higher thresholds will focus on more extreme conditions.
View Real-Time Signals:
The table shows which memecoins are currently oversold (buy column) or overbought (sell column), updating dynamically as price data changes. Traders can monitor this table to identify trading opportunities quickly.
Use with Different Timeframes:
The Z-score lookback period adjusts automatically based on the chart's timeframe, making this indicator suitable for intraday and long-term traders.
Use shorter timeframes (e.g., 1-minute, 5-minute charts) for faster signals, while longer timeframes (e.g., daily, weekly) may yield more stable, trend-based signals.
Who It Is For:
Short-Term Traders: Those looking to capitalize on short-term price imbalances (e.g., day traders, scalpers) can use this indicator to identify quick buy/sell opportunities as memecoins oscillate around their moving averages.
Swing Traders: Swing traders can use the Z-score tracker to identify overbought or oversold conditions across multiple memecoins and ride the reversals back toward equilibrium.
Crypto Enthusiasts and Memecoin Investors: Anyone involved in the volatile memecoin market can use this tool to better time entries and exits based on market extremes.
This indicator is for traders seeking quantitative analysis of price extremes in memecoins. By tracking the Z-scores across multiple coins and dynamically updating buy/sell opportunities in a table, it provides a systematic approach to identifying trade setups.

Cumulative Volume Delta Strategy | Flux Charts💎 GENERAL OVERVIEW
Introducing the Cumulative Volume Delta Strategy (CVDS) Indicator, an advanced tool designed to enhance trading strategies by identifying potential trend reversals through volume dynamics. This script features integrated order block detection, Fair Value Gaps (FVGs), and a dynamic take-profit (TP) and stop-loss (SL) system. For an in-depth understanding of the strategy, refer to the "HOW DOES IT WORK?" section below.
Features of the new Cumulative Volume Delta Strategy (CVDS) Indicator :
Cumulative Volume Delta-based Strategy
Order Block and Fair Value Gap (FVG) Entry Methods
Dynamic TP/SL System
Customizable Risk Management Settings
Alerts for Buy, Sell, TP, and SL Signals
📌 HOW DOES IT WORK ?
The CVDS indicator operates by tracking the net volume difference between buyers and sellers to identify divergences that could indicate potential trend reversals. A cumulative volume delta (CVD) calculation is employed to measure the intensity of these divergences in relation to price movements. The net volume sum is reset every trading day (can be changed from the settings using the anchor period option), and divergences are detected when the cumulative volume crosses the 0-line over or under.
Once a significant divergence is detected, the indicator identifies breakout points, confirmed by either Fair Value Gaps (FVGs) or Order Blocks (OBs). Depending on your chosen entry mode, the indicator will trigger a buy or sell entry when the confirmation signal aligns with the breakout direction. Alerts for Buy, Sell, Take-Profit, and Stop-Loss are available.
Note that the indicator cannot run on 1-minute and 1-second charts, as it needs to get data from a lower timeframe. 1-minutes & 1-second timeframes are the minimum timeframes in their ranges respectively.
🚩 UNIQUENESS
What sets this indicator apart is the combination of volume divergence analysis with advanced price action tools like Fair Value Gaps (FVGs) and Order Blocks (OBs). The ability to choose between these methods, along with a dynamic TP/SL system that adapts based on volatility, provides flexibility for traders in any market condition. The backtesting dashboard provides metrics about the performance of the indicator. You can use it to tune the settings for best use in the current ticker. The CVD-based strategy ensures that trades are initiated only when meaningful divergences between volume and price occur, filtering out noise and increasing the likelihood of profitable trades.
⚙️ SETTINGS
1. General Configuration
Anchor Period: Time anchor period used in CVD calculation. This is essentially the period that the volume delta sum will be reset. Lower timeframes may result in more entries at the cost of less reliable results.
Entry Mode: Choose between FVGs or OBs to trigger your entries based on the confirmation signals.
Retracement Requirement: Enable to confirm the entry after a retracement toward the FVG or OB.
2. Fair Value Gaps
FVG Sensitivity: Modify the sensitivity of FVG detection, allowing for more or fewer gaps to be considered valid.
3. Order Blocks (OB)
Swing Length: Define the swing length to identify OB formations. Shorter lengths find smaller OBs, while longer lengths detect larger structures.
4. TP / SL
TP / SL Method:
a) Dynamic: The TP / SL zones will be auto-determined by the algorithm based on the Average True Range (ATR) of the current ticker.
b) Fixed : You can adjust the exact TP / SL ratios from the settings below.
Dynamic Risk: The risk you're willing to take if "Dynamic" TP / SL Method is selected. Higher risk usually means a better winrate at the cost of losing more if the strategy fails. This setting is has a crucial effect on the performance of the indicator, as different tickers may have different volatility so the indicator may have increased performance when this setting is correctly adjusted.

RSI & Volume Impact Analyzer Ver.1.00Description:
The RSI VOL Score indicator combines the Relative Strength Index (RSI) and volume data through a mathematical calculation to assist traders in identifying and confirming potential trend reversals and continuations. By leveraging both momentum (RSI) and volume data, this indicator provides a more comprehensive view of market strength compared to using RSI or volume alone.
How It Works:
This indicator calculates a score by comparing the RSI against its moving average, adjusted by the volume data. The resulting score quantifies market momentum and strength. When the score crosses its signal line, it may indicate key moments where the market shifts between bullish and bearish trends, potentially helping traders spot these changes earlier.
Calculation Methods:
The RSI VOL Score allows users to select between several calculation methods to suit their strategy:
SMA (Simple Moving Average): Provides a balanced smoothing approach.
EMA (Exponential Moving Average): Reacts more quickly to recent price changes, offering faster signals.
VWMA (Volume Weighted Moving Average): Emphasizes high-volume periods, focusing on stronger market moves.
WMA (Weighted Moving Average): Applies greater weight to recent data for a more responsive signal.
What the Indicator Plots:
Score Line: Represents a combined metric based on RSI and volume, helping traders gauge the overall strength of the trend.
Signal Line: A smoothed version of the score that helps traders identify potential trend changes. Bullish signals occur when the score crosses above the signal line, while bearish signals occur when the score drops below.
Key Features:
Trend Identification: The score and signal line crossovers can help confirm emerging bullish or bearish trends, allowing traders to act on upward or downward momentum.
Customizable Settings: Traders can adjust the lengths of the RSI and signal line and choose between different moving averages (SMA, EMA, VWMA, WMA) to tailor the indicator to their trading style.
Timeframe-Specific: The indicator works within the selected timeframe, ensuring accurate trend analysis based on the current market context.
Practical Use Cases:
Trending Markets: In trending markets, this indicator helps confirm bullish or bearish signals by validating price moves with volume. Traders can use the crossover of the score and signal line as a guide for entering or exiting trades based on trend strength.
Ranging Markets: In ranging markets, the indicator helps filter out false signals by confirming if price movements are backed by volume, making it a useful tool for traders looking to avoid entering during weak or uncertain market conditions.
Interpreting the Score and Signal Lines:
Bullish Signal: A bullish signal occurs when the score crosses above the signal line, indicating a potential upward trend in momentum and price.
Bearish Signal: A bearish signal is generated when the score crosses below the signal line, suggesting a potential downward trend or weakening market momentum.
By mathematically combining RSI and volume data into a single trend score, the RSI VOL Score indicator provides traders with a powerful tool for identifying trend shifts early and making more confident trading decisions.
Important Note:
The signals generated by this indicator should be interpreted in conjunction with other analysis tools. It is always advisable to confirm signals before making any trading decisions.
Disclaimer:
This indicator is designed to assist traders in their decision-making process and does not provide financial advice. The creators of this tool are not responsible for any financial losses or trading decisions made based on its signals. Trading involves significant risk, and users should seek professional advice or conduct their own research before making any trading decisions.

Buy/Sell IndicatorBuy/Sell Indicator
Overview
The Buy/Sell Indicator is designed to help traders identify potential entry and exit points in the market using a combination of Simple Moving Averages (SMA) and the Relative Strength Index (RSI). This indicator plots buy and sell signals directly on the chart, making it easier to make informed trading decisions.
Inputs
Fast MA Length: The period for the fast-moving average. Default is 9.
Slow MA Length: The period for the slow-moving average. Default is 21.
RSI Length: The period for the RSI calculation. Default is 14.
RSI Overbought Level: The RSI level considered overbought. Default is 70.
RSI Oversold Level: The RSI level considered oversold. Default is 30.
How It Works
Moving Averages:
The indicator calculates two SMAs: a fast-moving average (fastMA) and a slow-moving average (slowMA).
The fast MA reacts more quickly to price changes, while the slow MA reacts more slowly.
RSI:
The RSI is calculated to measure the momentum of price movements.
It helps identify overbought and oversold conditions in the market.
Buy and Sell Conditions:
Buy Signal: A buy signal is generated when the fast MA crosses above the slow MA and the RSI is below the overbought level.
Sell Signal: A sell signal is generated when the fast MA crosses below the slow MA and the RSI is above the oversold level.
Plotting
Buy Signals: Displayed as green labels below the bars where the buy condition is met.
Sell Signals: Displayed as red labels above the bars where the sell condition is met.
Moving Averages: The fast MA is plotted in blue, and the slow MA is plotted in orange.

Volumatic Variable Index Dynamic Average [BigBeluga]The Volumatic VIDYA (Variable Index Dynamic Average) indicator is a trend-following tool that calculates and visualizes both the current trend and the corresponding buy and sell pressure within each trend phase. Using the Variable Index Dynamic Average as the core smoothing technique, this indicator also plots volume levels of lows and highs based on market structure pivot points, providing traders with key insights into price and volume dynamics.
Additionally, it generates delta volume values to help traders evaluate buy-sell pressure balance during each trend, making it a powerful tool for understanding market sentiment shifts.
BTC:
TSLA:
🔵 IDEA
The Volumatic VIDYA indicator's core idea is to provide a dynamic, adaptive smoothing tool that identifies trends while simultaneously calculating the volume pressure behind them. The VIDYA line, based on the Variable Index Dynamic Average, adjusts according to the strength of the price movements, offering a more adaptive response to the market compared to standard moving averages.
By calculating and displaying the buy and sell volume pressure throughout each trend, the indicator provides traders with key insights into market participation. The horizontal lines drawn from the highs and lows of market structure pivots give additional clarity on support and resistance levels, backed by average volume at these points. This dual analysis of trend and volume allows traders to evaluate the strength and potential of market movements more effectively.
🔵 KEY FEATURES & USAGE
VIDYA Calculation:
The Variable Index Dynamic Average (VIDYA) is a special type of moving average that adjusts dynamically to the market’s volatility and momentum. Unlike traditional moving averages that use fixed periods, VIDYA adjusts its smoothing factor based on the relative strength of the price movements, using the Chande Momentum Oscillator (CMO) to capture the magnitude of price changes. When momentum is strong, VIDYA adapts and smooths out price movements quicker, making it more responsive to rapid price changes. This makes VIDYA more adaptable to volatile markets compared to traditional moving averages such as the Simple Moving Average (SMA) or the Exponential Moving Average (EMA), which are less flexible.
// VIDYA (Variable Index Dynamic Average) function
vidya_calc(src, vidya_length, vidya_momentum) =>
float momentum = ta.change(src)
float sum_pos_momentum = math.sum((momentum >= 0) ? momentum : 0.0, vidya_momentum)
float sum_neg_momentum = math.sum((momentum >= 0) ? 0.0 : -momentum, vidya_momentum)
float abs_cmo = math.abs(100 * (sum_pos_momentum - sum_neg_momentum) / (sum_pos_momentum + sum_neg_momentum))
float alpha = 2 / (vidya_length + 1)
var float vidya_value = 0.0
vidya_value := alpha * abs_cmo / 100 * src + (1 - alpha * abs_cmo / 100) * nz(vidya_value )
ta.sma(vidya_value, 15)
When momentum is strong, VIDYA adapts and smooths out price movements quicker, making it more responsive to rapid price changes. This makes VIDYA more adaptable to volatile markets compared to traditional moving averages
Triangle Trend Shift Signals:
The indicator marks trend shifts with up and down triangles, signaling a potential change in direction. These signals appear when the price crosses above a VIDYA during an uptrend or crosses below during a downtrend.
Volume Pressure Calculation:
The Volumatic VIDYA tracks the buy and sell pressure during each trend, calculating the cumulative volume for up and down bars. Positive delta volume occurs during uptrends due to higher buy pressure, while negative delta volume reflects higher sell pressure during downtrends. The delta is displayed in real-time on the chart, offering a quick view of volume imbalances.
Market Structure Pivot Lines with Volume Labels:
The indicator draws horizontal lines based on market structure pivots, which are calculated using the highs and lows of price action. These lines are extended on the chart until price crosses them. The indicator also plots the average volume over a 6-bar range to provide a clearer understanding of volume dynamics at critical points.
🔵 CUSTOMIZATION
VIDYA Length & Momentum: Control the sensitivity of the VIDYA line by adjusting the length and momentum settings, allowing traders to customize the smoothing effect to match their trading style.
Volume Pivot Detection: Set the number of bars to consider for identifying pivots, which influences the calculation of the average volume at key levels.
Band Distance: Adjust the band distance multiplier for controlling how far the upper and lower bands extend from the VIDYA line, based on the ATR (Average True Range).

Sigma 2.0 - Advanced Buy and Sell Signal IndicatorOverview:
Sigma 2.0 is a sophisticated trading indicator designed to help traders identify potential buy and sell opportunities across various financial markets. By leveraging advanced mathematical calculations and incorporating multiple analytical tools, Sigma 2.0 aims to enhance trading strategies by providing precise entry and exit signals.
Key Features:
Advanced Sigma Calculations:
Utilizes a combination of Exponential Moving Averages (EMAs) and price deviations to calculate the Sigma lines (sigma1 and sigma2).
Detects potential trend reversals through the crossover of these Sigma lines.
Customizable Signal Filtering:
Offers the ability to filter buy and sell signals based on user-defined thresholds.
Helps reduce false signals in volatile markets by setting overbought and oversold levels.
Overbought and Oversold Detection:
Identifies extreme market conditions where price reversals are more likely.
Changes the background color of the chart to visually indicate overbought or oversold states.
Integration of Exponential Moving Averages (EMAs):
Includes EMAs of different lengths (10, 21, 55, 200) to assist in identifying market trends.
EMAs act as dynamic support and resistance levels.
Higher Timeframe Signal Incorporation:
Allows users to include signals from a higher timeframe to align trades with the broader market trend.
Enhances the reliability of signals by considering multiple timeframes.
Custom Alerts:
Provides alert conditions for both buy and sell signals.
Enables traders to receive notifications, ensuring timely decision-making.
How It Works:
Sigma Calculation Methodology:
The indicator calculates an average price (ap) and applies EMAs to derive the Sigma lines.
sigma1 represents the smoothed price deviation, while sigma2 is a moving average of sigma1.
A crossover of sigma1 above sigma2 generates a buy signal, indicating potential upward momentum.
Conversely, a crossover of sigma1 below sigma2 generates a sell signal.
Signal Filtering and Thresholds:
Users can enable filtering to only consider signals when sigma1 is below or above certain thresholds.
This helps in focusing on more significant market movements and reducing noise.
Overbought/Oversold Levels:
The indicator monitors sigma1 to detect when the market is in extreme conditions.
Background color changes provide a quick visual cue for these conditions.
EMA Analysis:
The plotted EMAs help in confirming the trend direction.
They can be used alongside Sigma signals to validate trade entries and exits.
Higher Timeframe Signals:
Incorporates signals from a user-selected higher timeframe.
Helps in aligning trades with the overall market trend, increasing the potential success rate.
How to Use:
Adding the Indicator to Your Chart:
Search for "Sigma 2.0" in the TradingView Indicators menu and add it to your chart.
Configuring the Settings:
Adjust the Sigma configurations (Channel Length, Average Length, Signal Line Length) to suit your trading style.
Set the overbought and oversold levels according to your risk tolerance.
Choose whether to filter signals by thresholds.
Select the higher timeframe for additional signal confirmation.
Interpreting the Signals:
Buy Signals:
Indicated by a green triangle below the price bar.
Occur when sigma1 crosses above sigma2 and other conditions are met.
Sell Signals:
Indicated by a red triangle above the price bar.
Occur when sigma1 crosses below sigma2 and other conditions are met.
Higher Timeframe Signals:
Plotted with lime (buy) and maroon (sell) triangles.
Help confirm signals in the current timeframe.
Utilizing EMAs:
Observe the EMAs to gauge the overall trend.
Consider aligning buy signals when the price is above key EMAs and sell signals when below.
Setting Up Alerts:
Use the built-in alert conditions to receive notifications for buy and sell signals.
Customize alert messages as needed.
Credits:
Original Concept Inspiration:
This indicator is inspired by the WaveTrend oscillator and other momentum-based indicators.
Special thanks to the original authors whose work laid the foundation for this enhanced version.
Disclaimer:
Trading involves significant risk, and past performance is not indicative of future results.
This indicator is a tool to assist in analysis and should not be the sole basis for any trading decision.
Always perform thorough analysis and consider multiple factors before entering a trade.
Note:
Ensure your chart is clean and only includes this indicator when publishing.
The script is open-source and can be modified to fit individual trading strategies.
For any questions or support, feel free to reach out or comment.

Market Structure Trailing Stop [BigBeluga]The Market Structure Trailing Stop indicator is an advanced tool for identifying market structure shifts, liquidity sweeps, and potential trend reversals using comprehensive volume analysis. This indicator combines the analysis of market structure pivots (CHoCH - Change of Character) with a sophisticated volume-based trailing stop logic. By evaluating delta volume at key structural points, it allows traders to identify high-probability trend continuations or reversals and manage their trades more effectively.
🔵 KEY FEATURES
● Market Structure Analysis
Pivot-Based Market Structure : The indicator identifies high and lows using user-defined periods, allowing traders to spot key market structure shifts.
Change of Character (CHoCH) : The first significant break of a market structure is marked as a CHoCH, indicating a potential trend reversal.
Break of Structure (BoS) : The indicator highlights subsequent breaks of structure after CHoCH, providing traders with crucial insights into trend strength.
● Advanced Volume Analysis
Delta Volume Evaluation : The indicator calculates delta volume (difference between up and down volume) at each ChoCh or BoS market structure point to assess the strength of the move. Identify Delta Volume from break point back to Pivot
● Trailing Stop Logic
Volume-Validated Trailing Stop : The indicator automatically plots a trailing stop if the delta volume at the UP CHoCH is positive and above the defined threshold and vice versa for Down CHoCH , allowing traders to protect their profits while riding the trend.
Trend Weakness Detection : If a subsequent BoS occurs with negative delta volume or lower volume than the input threshold, the trailing stop disappears, indicating potential trend exhaustion or reversal.
Dynamic Stop Placement : The trailing stop is dynamically adjusted based on market structure and volume, providing traders with a more adaptive stop-loss strategy.
Up Trend Trailing Stop:
Down Trend Trailing Stop:
● Liquidity Sweep Detection
Liquidity Sweep (X) Labels : The indicator identifies liquidity sweeps—points where the price temporarily reverses to sweep liquidity above or below a key level—marked with an “X” label.
Potential Reversal Zones : These liquidity sweeps are potential reversal zones, especially when accompanied by significant delta volume changes, providing traders with early warnings of potential trend reversals.
🔵 HOW TO USE
● Identifying Market Structure Shifts
Change of Character (CHoCH) : When a CHoCH occurs, the indicator calculates the total volume from the high point to the break point. If the delta volume is positive and exceeds the input threshold, a trailing stop is plotted, signaling potential trend continuation.
Break of Structure (BoS) : If BoS is enabled, subsequent breaks of structure are highlighted. If these BoS points show weaker volume or negative delta volume, the trailing stop will disappear, indicating that the trend may be losing strength.
● Using the Trailing Stop Feature
Protecting Profits : Once a CHoCH occurs and the delta volume validates the trend, the trailing stop will be plotted below (or above) the price to protect profits while allowing the trend to run.
Trend Reversal Signals : If the trailing stop disappears due to weak volume at subsequent BoS points, it may signal that the trend is losing momentum, and traders may consider closing their positions or tightening their stops manually.
● Liquidity Sweep Interpretation
Spotting Reversal Zones : Liquidity sweeps, marked with an “X” label, indicate zones where the price has swept liquidity. These areas can serve as potential reversal zones, especially when significant delta volume is observed at these points.
Early Reversal Warnings : Traders can use these liquidity sweep labels as early warnings for potential trend reversals, particularly in conjunction with other technical analysis methods.
🔵 CUSTOMIZATION
Highs and Lows Calculation : Customize the number of bars to the left and right for identifying pivots and market structure shifts.
Volume Threshold : Define the volume threshold to filter out weaker moves and focus on significant market structure shifts.
BoS and Liquidity Sweep Labels : Toggle on or off the BoS and Liquidity Sweep labels to tailor the indicator to your trading style.
Trend Color : Enable or disable trend coloring for candles to visually highlight uptrends and downtrends on the chart.
🔵 CONCLUSION
The Market Structure Trailing Stop indicator combines advanced volume analysis with market structure detection to provide traders with a powerful tool for identifying and managing trends. By leveraging delta volume at key structure points, it helps traders validate trend strength and manage their positions with a dynamic trailing stop strategy. The addition of liquidity sweep detection further enhances its utility, offering early warnings of potential trend reversals. This indicator is ideal for traders who want to gain a deeper understanding of market structure while incorporating volume-based insights into their trading strategies.

Ehlers Band-Pass FilterHeyo,
This indicator is an original translation from Ehlers' book "Cycle Analytics for Traders Advanced".
First, I describe the indicator as usual and later you can find a very insightful quote of the book.
Key Features
Signal Line: Represents the output of the band-pass filter, highlighting the dominant cycle in the data.
Trigger Line: A leading indicator derived from the signal line, providing early signals for potential market reversals.
Dominant Cycle: Measures the dominant cycle period by counting the number of bars between zero crossings of the band-pass filter output.
Calculation:
The band-pass filter is implemented using a combination of high-pass and low-pass filters.
The filter's parameters, such as period and bandwidth, can be adjusted to tune the filter to specific market cycles.
The signal line is normalized using an Automatic Gain Control (AGC) to provide consistent amplitude regardless of price swings.
The trigger line is derived by applying a high-pass filter to the signal line, creating a leading
waveform.
Usage
The indicator is effective in identifying peaks and valleys in the market data.
It works best in cyclic market conditions and may produce false signals during trending periods.
The dominant cycle measurement helps traders understand the prevailing market cycle length, aiding in better decision-making.
Quoted from the Book
Band-Pass Filters
“A little of the data narrowly passed,” said Tom broadly.
Perhaps the least appreciated and most underutilized filter in technical analysis is the band-pass filter. The band-pass filter simultaneously diminishes the amplitude at low frequencies, qualifying it as a detrender, and diminishes the amplitude at high frequencies, qualifying it as a data smoother.
It passes only those frequency components from input to output in which the trader is interested. The filtering produced by a band-pass filter is superior because the rejection in the stop bands is related to its bandwidth. The degree of rejection of undesired frequency components is called selectivity. The band-stop filter is the dual of the band-pass filter. It rejects a band of frequency components as a notch at the output and passes all other frequency components virtually unattenuated. Since the bandwidth of the deep rejection in the notch is relatively narrow and since the spectrum of market cycles is relatively broad due to systemic noise, the band-stop filter has little application in trading.
Measuring the Cycle Period
The band-pass filter can be used as a relatively simple measurement of the dominant cycle.
A cycle is complete when the waveform crosses zero two times from the last zero crossing. Therefore, each successive zero crossing of the indicator marks a half cycle period. We can establish the dominant cycle period as twice the spacing between successive zero crossings.
When we measure the dominant cycle period this way, it is best to widen the pass band of the band-pass filter to avoid distorting the measurement simply due to the selectivity of the filter. Using an input bandwidth of 0.7 produces an octave-wide pass band. For example, if the center period of the filter is 20 and the relative bandwidth is 0.7, the bandwidth is 14. That means the pass band of the filter extends from 13-bar periods to 27-bar periods.
That is, roughly an octave exists because the longest period is twice the shortest period of the pass band. It is imperative that a high-pass filter is tuned one octave below the half-bandwidth edge of the band-pass filter to ensure a nominal zero mean of the filtered output. Without a zero mean, the zero crossings can have a substantial error.
Since the measurement of the dominant cycle can vary dramatically from zero crossing to zero
crossing, the code limits the change between measurements to be no more than 25 percent.
While measuring the changing dominant cycle period via zero crossings of the band-pass waveform is easy, it is not necessarily the most accurate method.
Best regards,
simwai
Good Luck with your trading! 🙌

long&short signal Smart Money Concepts (SMC) with MACD Signals Smart Money Concepts (SMC) with MACD Signals
Advanced SMC and MACD Integration for Precision Trading
The "Smart Money Concepts (SMC) with MACD Signals" indicator is a powerful and versatile tool designed to enhance trading strategies by integrating two highly effective technical analysis methods into a single, cohesive indicator. This advanced script combines the Smart Money Concepts (SMC) methodology with the Moving Average Convergence Divergence (MACD) indicator to provide traders with a comprehensive trading solution that identifies key market trends and potential trading opportunities.
What It Does:
Smart Money Concepts (SMC):
The SMC component of this indicator identifies significant price levels and zones where market participants, particularly institutional investors, may be active. It calculates high and low anchor levels based on historical price data, creating zones that help traders understand where price action may encounter support or resistance. These anchor levels are used to plot background colors on the chart, highlighting critical areas of interest where price might react, and generating buy (long) and sell (short) signals based on price interactions with these levels.
MACD (Moving Average Convergence Divergence):
The MACD component provides insights into market momentum and trend strength. By calculating the difference between two moving averages and comparing it to a signal line, the MACD indicator helps traders identify potential changes in trend direction. The script plots the MACD line, signal line, and histogram, offering a clear visual representation of market momentum. Buy (long) and sell (short) signals are generated when the MACD line crosses above or below the signal line, providing timely alerts to potential trading opportunities.
Why It’s Special:
This indicator stands out for its dual functionality, combining the price level analysis of SMC with the momentum-based insights of MACD. The integration allows traders to benefit from both trend and price level analysis, offering a more robust and accurate trading tool. The SMC component highlights critical price zones and provides context for price action, while the MACD component confirms the strength and direction of market trends.
By using this combined approach, traders can make more informed decisions based on comprehensive market analysis. The indicator not only helps in identifying significant price levels and potential market reversals but also provides real-time signals to capitalize on these opportunities. Whether you are a day trader or a swing trader, the "Smart Money Concepts (SMC) with MACD Signals" indicator is designed to enhance your trading strategy with precision and clarity.
This unique combination of SMC and MACD offers a powerful toolset for traders looking to refine their trading strategies and improve their market analysis. With its user-friendly visualizations and signal generation, this indicator is an essential addition to any trader’s toolkit.

Uptrick: Adaptive Cloud Oscillator (ACO)### **Uptrick: Adaptive Cloud Oscillator (ACO)**
---
### Introduction
The **Uptrick: Adaptive Cloud Oscillator (ACO)** is an advanced technical analysis tool designed to empower traders with precise trend detection and visual clarity in dynamic market conditions. By seamlessly integrating adaptive trend analysis, volatility filtering, and cloud-based support and resistance levels, the ACO provides traders with the actionable insights needed to navigate complex markets with confidence.
This indicator is highly customizable, allowing traders to tailor its functionality to their specific trading style and preferences. Whether you're a trend follower, swing trader, or looking to identify key support and resistance zones, the **Uptrick: ACO** is an indispensable tool that can adapt to a variety of market conditions.
### Indicator Purpose and Functionality
#### 1. **Adaptive Trend Detection**
At the heart of the **Uptrick: ACO** lies its adaptive trend detection algorithm. Unlike traditional moving averages that may lag in volatile markets or react too slowly to rapid changes, this adaptive method uses a smoothing technique that dynamically adjusts based on market conditions. By doing so, it provides a more responsive trend line that captures meaningful price movements while filtering out minor fluctuations.
- **How It Works:** The trend line is calculated using an adaptive smoothing factor, making it responsive to recent price actions while maintaining a level of stability that prevents whipsaw signals. This ensures that traders are always in tune with the prevailing market trend, whether bullish, bearish, or neutral.
#### 2. **Dynamic Cloud Support and Resistance**
The **Uptrick: ACO** features a dynamic "cloud" that serves as a key element in its analysis. This cloud is constructed using a moving average combined with the Average True Range (ATR), which adjusts based on the market’s volatility. The cloud provides dynamic support and resistance levels, essential for identifying potential reversal zones or confirming trend continuations.
- **Cloud Displacement:** The cloud is displaced forward by a user-defined number of bars, offering a predictive view of where future support and resistance levels may lie. This forward-looking feature helps traders anticipate potential price movements, making the ACO a powerful tool for planning trades ahead of time.
#### 3. **Versatile Visualization Options**
The **Uptrick: ACO** is designed with flexibility in mind, allowing users to choose between two distinct display modes:
- **Buy/Sell Signals:** In this mode, the indicator generates clear buy and sell signals based on crossovers of the trend line and the cloud boundaries. These signals are visualized directly on the chart with up and down labels, making it easy for traders to identify potential entry and exit points.
- **Cloud Fill Only:** For traders who prefer a cleaner chart, this mode removes the buy/sell signals and instead focuses on coloring the area between the upper and lower cloud boundaries. The color of the cloud fill changes based on the trend direction, providing a visual representation of the market's momentum.
- **Optional EMA Line:** An Exponential Moving Average (EMA) line can be optionally displayed on the chart. The EMA serves as an additional trend filter, helping traders further refine their entries and exits. The length, color, and thickness of the EMA are fully customizable to fit individual trading strategies.
### Practical Applications
#### 1. **Trend Following and Reversals**
The **Uptrick: ACO** excels in identifying and following trends. By analyzing the relationship between the trend line and the cloud, traders can determine the strength and direction of the current market trend. The cloud’s dynamic nature means it can adapt to both trending and ranging markets, providing consistent insights regardless of market conditions.
- **Example:** If the trend line crosses above the upper cloud boundary, it signals a potential buy opportunity. Conversely, a cross below the lower cloud boundary suggests a sell opportunity. Traders can use these signals to enter trades aligned with the prevailing trend.
#### 2. **Support and Resistance Identification**
The forward-displaced cloud acts as a predictive support and resistance zone. Traders can use these zones to set stop-loss levels, determine take-profit targets, or identify potential reversal points.
- **Example:** When the price approaches the upper cloud boundary from below, the boundary may act as resistance, indicating a potential reversal or pullback. If the price breaks through this level, it may signal a continuation of the bullish trend.
#### 3. **Volatility-Based Analysis**
By incorporating ATR into its calculations, the **Uptrick: ACO** provides a built-in mechanism to adapt to varying levels of market volatility. This makes it particularly useful in markets prone to sudden spikes in volatility, such as during major economic announcements or geopolitical events.
- **Example:** In a high-volatility environment, the cloud widens, allowing for greater price fluctuations within the trend. Traders can use this information to adjust their risk management strategies, such as widening stop-loss levels during volatile periods to avoid being stopped out prematurely.
### Customization and Flexibility
The **Uptrick: ACO** is designed to be highly customizable, ensuring it can meet the needs of traders with different strategies and preferences. Key customization options include:
- **Cloud and Trend Settings:** Traders can adjust the length of the cloud, the smoothing factor for the trend line, and the displacement of the cloud to optimize the indicator for their specific market and timeframe.
- **Display Modes:** With a simple dropdown selection, traders can choose whether to display buy/sell signals or focus solely on the cloud fill, providing flexibility in how the indicator is visualized.
- **Color and Style Customization:** The colors for bullish and bearish trends, cloud fill, buy/sell signals, and the EMA line can all be customized, allowing traders to integrate the **Uptrick: ACO** seamlessly into their existing chart setups.
### Conclusion
The **Uptrick: Adaptive Cloud Oscillator (ACO)** is more than just a trend indicator—it's a comprehensive market analysis tool that provides traders with a deep understanding of market dynamics. Its combination of adaptive trend analysis, dynamic support and resistance levels, and versatile visualization options makes it an essential tool for traders looking to gain an edge in any market environment.
Whether you're a seasoned trader or just starting, the **Uptrick: ACO** offers the insights and flexibility needed to make informed trading decisions. By helping you identify trends, anticipate reversals, and adapt to changing market conditions, the **Uptrick: ACO** can significantly enhance your trading strategy and improve your overall trading performance.

Uptrick: Adaptive Trend Strength Index (ATSI)### **Adaptive Trend Strength Index (ATSI): Trend Detection Tool**
---
### Introduction
The **Adaptive Trend Strength Index (ATSI)** is a state-of-the-art indicator designed to offer traders an unparalleled view into market trends. By combining the principles of adaptive trend analysis with advanced volatility filtering, ATSI provides a powerful and visually intuitive method for identifying and following market trends. Its unique algorithm and customizable features make it an essential tool for traders across all markets—whether you're trading stocks, forex, commodities, or cryptocurrencies.
### The Purpose and Design Philosophy
At its core, the ATSI was built with the understanding that financial markets are dynamic, ever-changing entities influenced by a multitude of factors, including market sentiment, economic data, geopolitical events, and, critically, volatility. Traditional trend indicators often fall short by either over-smoothing price data (thus lagging behind the actual trend) or reacting too quickly to minor price fluctuations, resulting in false signals.
**ATSI solves this dilemma by adapting to market conditions in real-time.** It effectively filters out market noise while being sensitive enough to detect meaningful shifts in trend direction. The result is a trend line that is both responsive and smooth, providing traders with a clear, actionable view of the market's current trajectory.
### Key Features and Functionality
#### 1. **Adaptive Trend Calculation**
The heart of ATSI is its adaptive trend algorithm, which adjusts based on market conditions. It leverages a combination of price action analysis and volatility filtering to determine the strength and direction of the trend. Here’s how it works:
- **Volatility Sensitivity:** ATSI incorporates the Average True Range (ATR) to measure market volatility. This volatility measure is then adjusted by a user-defined sensitivity factor. This ensures that the indicator responds dynamically to different market environments—be it high-volatility breakouts or low-volatility consolidations.
- **Adaptive Smoothing:** The trend calculation is further enhanced by an exponential moving average (EMA) applied not just to the raw price data, but also to the resulting trend line itself. This dual-layer smoothing process helps to eliminate noise, resulting in a cleaner and more reliable trend line.
- **Real-Time Adaptation:** Unlike rigid indicators that require constant tweaking to stay relevant in changing market conditions, ATSI adapts in real-time. This adaptability makes it particularly valuable in fast-moving markets where conditions can change rapidly.
#### 2. **Visual Clarity**
In trading, visual clarity can make the difference between spotting a lucrative trend and missing out. ATSI excels in this regard by offering a clear, color-coded trend line that provides instant feedback on market conditions:
- **Thicker and Smoother Line:** ATSI’s trend line is designed to be visually prominent. By default, it is thicker than most standard indicators, making it easy to spot even in dense charts. Additionally, the smoothing applied to the line ensures that it flows smoothly, avoiding the jagged, noisy appearance that can plague other indicators.
- **Color-Coded Trends:** The trend line changes color based on the direction and strength of the trend:
- **Green Line**: Indicates a bullish trend, suggesting upward momentum in the market.
- **Red Line**: Indicates a bearish trend, signaling downward momentum.
- **Gold Line**: Represents a neutral or weak trend, where the market is consolidating or where there is no clear direction.
This color-coding is not just for aesthetics—it’s a critical feature that allows traders to quickly assess market conditions at a glance.
#### 3. **Customizable Parameters**
ATSI is built with the understanding that every trader’s strategy is unique. Whether you’re a day trader looking for short-term trends or a swing trader interested in catching longer moves, ATSI can be tailored to fit your needs:
- **Trend Length:** The length parameter controls how much historical data is considered in the trend calculation. A shorter length will make the indicator more sensitive to recent price changes, while a longer length will smooth out short-term fluctuations, focusing on the broader trend.
- **Smoothing Factor:** This parameter controls the level of smoothing applied to the trend line. A higher smoothing factor will result in a smoother, more stable trend line, while a lower factor will make the line more responsive to quick changes in price.
- **Volatility Sensitivity:** By adjusting the volatility sensitivity, you can control how reactive the indicator is to market volatility. A higher sensitivity makes the indicator more likely to detect trends in volatile markets, while a lower sensitivity helps to filter out noise in calmer markets.
- **Line Width:** ATSI allows you to adjust the thickness of the trend line, ensuring that it stands out on your chart. This is particularly useful when trading on charts with a lot of overlays or when you need a clear, bold line to guide your trading decisions.
- **Color Customization:** The colors for bullish, bearish, and neutral trends can be fully customized to match your personal preferences or to integrate seamlessly with your existing chart setup.
### Practical Applications
ATSI is a versatile indicator that can be applied to a wide range of trading strategies. Here’s how it can enhance your trading:
#### 1. **Trend Following**
For traders who thrive on catching and riding trends, ATSI is a game-changer. Its adaptive nature ensures that you stay in the trend for as long as possible without being shaken out by minor fluctuations. The clear color-coded line makes it easy to identify when a trend starts and ends, providing clear entry and exit signals.
#### 2. **Risk Management**
One of the biggest challenges in trading is managing risk, particularly in volatile markets. ATSI’s volatility sensitivity feature helps traders adjust their strategies based on current market conditions. For example, in a high-volatility environment, the indicator will become more sensitive, allowing you to tighten your stop losses or take profits earlier. Conversely, in a low-volatility market, the indicator will smooth out minor fluctuations, reducing the risk of being stopped out prematurely.
#### 3. **Trend Reversals and Consolidations**
ATSI is also highly effective in identifying trend reversals and periods of consolidation. The neutral (gold) line indicates periods where the market is undecided, which can often precede significant moves. Recognizing these periods can help you avoid getting caught in choppy markets and position yourself for the next big move.
#### 4. **Market Timing**
Timing the market is often seen as the holy grail of trading. While no indicator can predict the future with 100% accuracy, ATSI’s real-time adaptation gives you a significant edge. By responding to changes in market conditions as they happen, ATSI helps you make timely decisions, whether you’re entering a trade, exiting a position, or adjusting your risk parameters.
### Comparative Advantage
What sets ATSI apart from other trend indicators is its combination of adaptability, visual clarity, and ease of use:
- **Adaptability:** Most trend indicators are static—they apply the same calculations regardless of market conditions. ATSI, however, adapts to the market in real-time, ensuring that it remains relevant and reliable across different market environments.
- **Visual Clarity:** The thicker, smoother, color-coded line is not just aesthetically pleasing—it’s a functional design choice that helps you quickly interpret market conditions. Whether you’re glancing at your chart or conducting an in-depth analysis, the ATSI line stands out, providing immediate insight.
- **Ease of Use:** Despite its advanced features, ATSI is incredibly easy to use. The default settings are optimized for general use, but the indicator offers a high degree of customization for those who want to tailor it to their specific trading strategy.
### Conclusion
The **Adaptive Trend Strength Index (ATSI)** is more than just another trend indicator—it’s a comprehensive tool designed to give traders an edge in today’s fast-paced, volatile markets. By combining adaptive trend analysis with advanced volatility filtering, ATSI offers a unique blend of responsiveness and reliability. Its clear, color-coded visual representation of trends makes it easy to use, even for traders who are new to technical analysis, while its customizable parameters provide the flexibility that experienced traders demand.
Whether you’re looking to ride the next big trend, manage your risk more effectively, or simply get a clearer picture of the market’s current direction, ATSI is an invaluable addition to your trading toolkit. With its cutting-edge design and powerful functionality, ATSI is poised to become the go-to indicator for traders seeking to enhance their market analysis and improve their trading outcomes.

Gaussian Kernel Smoothing MomentumOverview:
The Gaussian Kernel Smoothing Momentum indicator analyzes and quantifies market momentum by applying statistical techniques to price and returns data. This indicator uses Gaussian kernel smoothing to filter noise and provide a more accurate representation of momentum. Additionally, it includes a option to evaluate the absolute score of the momentum to determine if the beginning of a "trend" is likely or if you can expect a "trend" to come to an end.
Kernels and Their Role In Time Series Analysis:
In statistical analysis, a kernel is a weighting function used to estimate the properties of a dataset. Kernels are particularly useful in non-parametric methods, where they serve to smooth data or estimate probability density functions without assuming a specific underlying distribution. The Gaussian kernel, one of the most commonly used, is characterized by its smooth, bell-shaped curve which provides a natural way to give more weight to data points closer to the target value and less weight to those further away.
Uses of Kernels in Time Series Analysis
Kernels play a significant role in time series analysis, especially in the context of smoothing and filtering. With kernel functions, you can reduce noise and extract the underlying systematic component or signal from the data. This process is essential for identifying long-term patterns in the data, which is often obscured by short-term fluctuations and random noise.
Kernel Smoothing
Kernel smoothing is a technique that applies a kernel function to a set of data points to create a smooth curve, effectively reducing the impact of random variations. In time series analysis, kernel smoothing helps to filter out short-term noise while retaining significant trends and "patterns". The Gaussian kernel, with its emphasis on nearby points, is particularly effective for this purpose, as it smooths the data in a way that highlights the underlying structure without overfitting to random fluctuations.
Additionally, kernels are used in non-parametric volatility estimation, option pricing models, and for detecting anomalies in financial data. Their flexibility and ability to handle complex, non-linear relationships make them well-suited for the often noisy data encountered in financial markets.
Momentum Component
The momentum component of the indicator is designed to quantify the directional movement of asset prices by applying the Gaussian kernel smoothing to the expected return of the price data. The data then has the variance stabilized and normalizes the distribution of price changes to be able to more efficiently analyze the momentum.
The Gaussian kernel smoothing function serves to filter out high-frequency noise, isolating the underlying systematic component of the momentum. This is achieved by weighting the data points based on their proximity to the current observation, with closer data points exerting a stronger influence. The resulting smoothed momentum provides a clearer of the directional bias in the market, devoid of short-term volatility.
Absolute Move Component
The absolute move component is a extension of the momentum analysis, focusing on the magnitude rather than the direction of the price movements. This component captures the absolute score of the smoothed momentum series, providing a measure of strength or intensity of the price movement, independent from its direction. The absolute move component also incorporates a Kalman filter to further smooth and refine the signal. The Kalman filter dynamically adjusts based on the observed variance in the data, to reduce the impact of outliers.
What to make of this indicator
The smoothed momentum line helps determine whether the market is experiencing upward and downward momentum. If the momentum line is above zero and rising, this suggest a positive expected returns. Conversely, if the momentum line is below zero and falling, it indicates negative expected returns.
You should also pay attention to changes in the slope of the momentum line and the moving average of the smoothed momentum(weighted with an optimal sampling size algorithm). A flattening or reversal of the slope may signal a potential shift in market direction. For example, if the momentum line and moving average transitions from rising to falling, it means that the expected return is going from positive to negative so you can see the "trend" as weakening or forming a trend of negative expected returns.
The absolute move component is designed to measure the intensity or strength of the current market movement. A low absolute move value, especially when they are negative or at the lower end of their band, indicates that the momentum and expected return is close to zero, which suggest that the market is experiencing minimal directional movement, which can be a sign of consolidation. High absolute values signal that the market is undergoing a significant price movement. When the absolute move is high and/or rising, it indicates that the movement of the momentum is strong, regardless of whether it is bullish or bearish.
If the absolute move reaches unusually high levels, it could indicate that the market is experiencing an exceptional price move, which might be unsustainable. Traders can anticipate potential reversals or profit taking targets. However, you should avoid trying to trade reversals as exceptionally high values in a time series do not guarantee an immediate reversal. This high values often occur during periods of strong trends or significant events, which can continue longer than expected, and you cant time when it will return to its mean. The mean-reverting nature of some statistical models can suggest a return to the mean, but this assumption can be misleading in financial markets, where trends can persist despite overextending conditions.

Pace ProOverview
The Pace Pro indicator is a robust trend-following tool designed for versatile application across various timeframes and markets, including stocks, forex, futures and cryptocurrencies. It provides traders with "bull" and "bear" signals, take profit (TP) signals, and volume spike indications. This indicator aims to help traders identify potential trading opportunities through trends, reversals and price exhaustion.
Key Features
Bull and Bear Signals: Pace Pro generates green "bull" and red "bear" signals based on a trend strength score derived from an aggregation of components.
Take Profit (TP) Signals: The indicator plots black "TP" signals at areas of price exhaustion.
Volume Spike Indicators: The indicator colors candles to signify high volume spikes—light green for high bullish volume and light red for high bearish volume.
Price Clouds: The indicator includes three types of Bollinger Band clouds. These clouds help visualize exhaustion and volatility, providing traders with multiple perspectives on market dynamics.
How it works:
Trend Strength: This score is calculated using a proprietary formula that assesses the magnitude and direction of market movement with standard deviation and regression analysis. Standard deviation computes the average price over a specified period and then calculates the standard deviation of prices from this average. A linear regression is performed on the closing prices over a specified period. The slope of the regression line is used to identify the trend direction, and the standard deviation is used to assess trend stability and filter out noise, working together to clearly identify direction and robustness. Bull/Bear signals are produced based on trend strength reaching specific thresholds, configurable in the settings.
Overbought/Oversold Strength: This strength identifies price exhaustion using a unique formula that aggregates values from several indicators such as RVI, RSI and CCI. RVI captures price trends, RSI measures momentum, and CCI identifies price deviations from the mean, providing a comprehensive view of market conditions. Take profit signals are plotted at points of high price exhaustion, indicating optimal exit prices.
Volume Analysis: Volume spikes are identified and highlighted with colored candles using an ATR calculation that pinpoints outliers in volume. This is calculated using the math.abs function, identifying volume spikes in the last 14 bars. Volume spike candle size can be configured in settings to the user's liking.
Bollinger Band Clouds: The indicator employs Bollinger Band clouds based on WMA, VWMA, and EMA to provide a comprehensive view of market volatility and trend strength. WMA responds quickly to price changes, VWMA incorporates volume, and EMA smooths out data, offering a unique and adaptive perspective on market conditions. This combination is used to provide a unique perspective on market volatility, utilizing different moving averages. These clouds adapt to price fluctuations and offer visual cues to enhance trend analysis.
Utility
This tool provides traders with valuable information for trend-following and reversal strategies across different timeframes. It helps traders by:
-Generating "bull" and "bear" signals to indicate potential long, short and exit points. The precise calculation methods and statistical components used in deriving the trend strength score are designed to filter out market noise and provide a clear indication of prevailing market trends.
-Providing "TP" signals at areas of price exhaustion, areas where taking profit is optimal. These also serve as potential reversal points in the market as they incorporate reversion analysis techniques.
-Highlighting high volume spikes with colored candles to indicate significant market activity. These volatile candles can indicate a significant and rapid surge in price.
-Offering visual insights through Bollinger Band clouds, which help traders assess overbought and oversold conditions on a broad scale. These aid in visualizing potential reversals in the market.
Rationale and Benefits of Component Combination
The combination of trend strength, overbought/oversold strength, volume analysis, and Bollinger Band clouds provides a holistic approach to market analysis and allows users to use various techniques of trading analysis to make sound trading decisions. Each component serves a distinct purpose:
-Trend Strength identifies and confirms the direction and magnitude of market trends, offering clear bull and bear signals. A trend score is calculated to clearly identify where price is strongly trending and where it is quite weak. This customizable feature allows traders to configure this indicator to their liking by only plotting signals when the trend reaches a desired threshold.
-Overbought/Oversold Strength pinpoints areas of price exhaustion, providing crucial take profit and reversal conditions in the market. I combine RSI, RVI, and CCI to provide a more robust reversion score. My rationale for this is to leverage data from multiple indicators, to ensure a comprehensive assessment of price exhaustion rather than relying on a single source.
-Volume Analysis highlights significant market activity, giving traders insights into potential price movements. This feature is included to provide users with a visual representation of price pumps/dumps, that can aid in trading decisions in combination with entry and exit signals.
-Bollinger Band Clouds offer a visual representation of market volatility and trend strength, enhancing the overall analytical framework. Bands were calculated using a mixture of WMA, VWMA, and EMA to diversify data and to bring variety to its display. This can enhance its use as it does not use a single data source and relies on multiple.
Uniqueness:
This indicator stands out due to its innovative integration of standard deviation and regression analysis, offering traders a unique and comprehensive market analysis tool. By combining standard deviation to measure volatility and filter out noise with regression analysis to identify trend direction and strength, it provides insightful trend signals that help traders make informed decisions. This indicator's versatility is enhanced by its customizable settings, allowing traders to adapt it to their specific needs and trading styles with the trend sensitivity setting. Combining RSI, RVI, and CCI for reversion and exit points is unique as it integrates multiple perspectives on price momentum and volatility, providing a more comprehensive assessment of price exhaustion than using any single indicator. Combining WMA, EMA, and VWMA as bands is beneficial and unique as it blends different averaging methods to offer a more nuanced and adaptive view of market volatility and trend strength.
By integrating these components, it delivers a multifaceted tool that addresses various aspects of market analysis, making it a valuable asset for traders seeking to improve their decision-making process.
Disclaimer
Trading involves substantial risk and is not suitable for every investor. This indicator is designed to assist in decision-making but does not guarantee profits or prevent losses. Always conduct your own research and consider seeking advice from a financial professional.
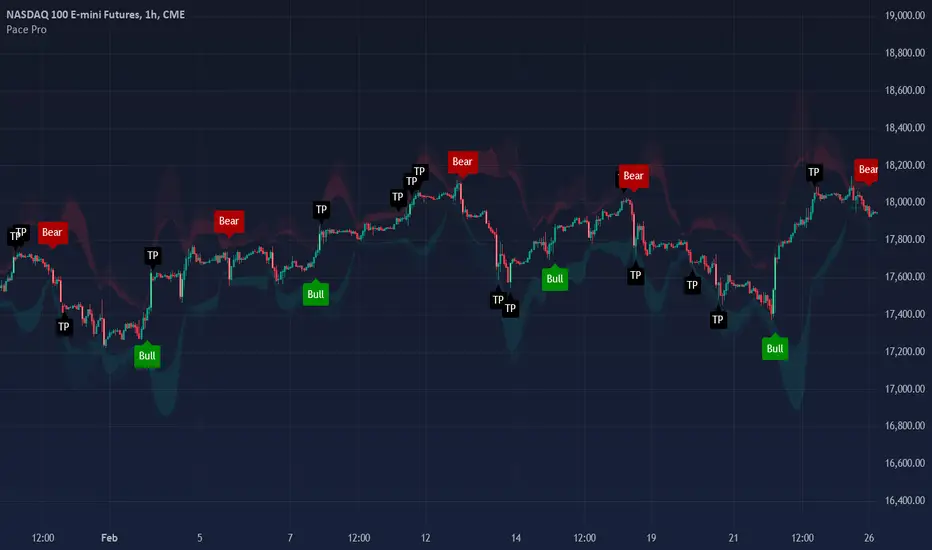
Market Waves [BigBeluga]MARKET WAVES
Market Waves The Market Waves [ BigBeluga ] is an all in one toolkit focusing on trends, accumulations and identifying market structures right on your chart. It is lightweight and powerful in its approaches, taking unique mathematical approaches to classical tools.
⬤ Signals
The Beluga Signals combine tested powerful ideas into a single tool. They are designed to follow trends and reduce noise in the market using low pass filtering methods. There are two types of signals founds in this toolkit; normal and power signals. Power signals are signals with a + in them indicating that the signal may be more likely to play out.
These are great when used in confluence with other trend following tools to filter them for even greater performance. Naturally traders will want to use these with confluence to confirm the trend identification.
The signals come with take profits built in. Ticks are placed on the chart indicating a potential areas to be taking profit. Using these as exits can be powerful especially when using confluence. Max Profit labels are also produced suggesting it really is the ideal time to be exiting the market before a reversal comes.
By leveraging unique low lag methods and filtering approaches, these signals offer a unique edge when compared to classical TSL such as a SuperTrend or PSAR.
⬤ Smooth Trend
The Smooth Trend (shown here with green and red shadows) also focuses on low lag noise filtering. This unique system is perfect when used for entries or as a filter. Users are able to adjust how fast or slow the trend is identified.
In the example above, we see a sell signal during the time the smooth trend is green. Therefore using confluence we can filter out the signal and proceed to take our power buy signal.
Percentages are also provided at the start of the trend. These indicate the probability this really is a new trend. In the image above we again see the trends are both labelled as 100% and the system is fully confident what we were seeing was indeed a trend reversal.
Although it may appear as a classical trend following tool, again it's uniqueness lies in its ability to locate market bottoms and respond to trends.
⬤ The Trend Accumulations
This feature focuses on elegant trend and range identification making trader's lives easier. By not cluttering the chart this system allows traders to see an asset's behavior without overlays.
Uptrends, downtrends and ranges are identified with uptrends showing with a green base line, downtrends with a red one and ranges/accumulations in blue. As shown in the image above; this is a powerful system to avoid trading ranges/chop in the market. We see a blue accumulation zone, this means the market is best to avoid. We then transition to a faint green suggesting the market is starting to move upwards.
Leveraging range detection techniques, this gives responsive market structure identification at a glance.
⬤ Voltix Bands
The Voltix Bands are a type of volatility-based band used to gauge market volatility and identify potential trading opportunities. These bands consist of two components: an upper band and a lower band. The distance between the bands fluctuates based on market volatility. When the market is highly volatile, the bands widen, and when volatility is low, the bands contract. They are unique as they uniquely apply distributions and weight volatility accordingly.
How to Use Voltix Bands:
When the price moves outside the Voltix Bands, it often signals a potential breakout. A close above the upper band may indicate the start of an upward trend, while a close below the lower band might signal the beginning of a downward trend.
Traders often use these breakout signals to enter trades in the direction of the breakout.
Detecting Overbought and Oversold Conditions:
When the price touches or moves beyond the upper Voltix Band, it can suggest that the market is overbought, indicating a potential reversal or pullback.
Conversely, when the price touches or drops below the lower Voltix Band, it may indicate an oversold condition, suggesting a possible price increase or trend reversal.
Volatility Contraction and Expansion:
Tightening Voltix Bands (when the bands contract) often precedes a significant price movement. This phenomenon is known as the "squeeze." When the bands tighten, it indicates a period of low volatility, and traders often anticipate an imminent breakout in either direction.
Widening Voltix Bands (when the bands expand) signal increasing volatility. Traders can use this as a cue to either ride the trend or be cautious of potential reversals.
Trend Following:
In trending markets, the price often stays close to the upper or lower band for extended periods. Traders can use this characteristic to follow the trend, staying long when the price is near the upper band and short when it is near the lower band. The bands also provide color coding and are green during an uptrend and purple during a downtrend.
⬤ Candle Coloring
1. Volume-Based Candle Coloring
Volume-based candle coloring mode changes the color of each candlestick according to the trading volume associated with that period. This method helps traders quickly identify periods of high or low market activity and understand the strength behind price movements.
How It Works:
High Volume: Candles are colored differently (red bearish, bright blue for bullish) when the trading volume is significantly higher than the average. This indicates strong buying or selling interest.
This mode is useful for identifying potential breakouts or fakeouts. For example, a price breakout accompanied by high volume suggests a strong move, while a breakout on low volume might indicate a lack of conviction, potentially leading to a false breakout.
2. Trend-Based Candle Coloring
Trend-based candle coloring mode changes the color of candlesticks depending on the current market trend, helping traders visually distinguish between bullish and bearish phases and neutral periods.
How It Works:
Bullish Trend: Candles are colored green when the price is in an uptrend.
Bearish Trend: Candles are colored red when the price is in a downtrend.
Usage:
This mode is beneficial for trend-following strategies, allowing traders to quickly assess the overall market direction and align their trades with the prevailing trend.
3. Momentum-Based Candle Coloring
In this momentum-based candle coloring mode, candlesticks are colored yellow for strong bullish momentum and pink for strong bearish momentum. This visual approach highlights the intensity of market movements, helping traders quickly identify prevailing momentum and potential trend shifts.
How It Works:
Strong Bullish Momentum (Yellow Candles):
Candles turn yellow when the market exhibits strong upward momentum. This might be triggered by a proprietary technique that detects when buying pressure is significantly driving prices higher, indicating that the market is experiencing robust bullish activity.
Yellow candles suggest that the price is likely to continue rising, and traders may look to capitalize on this momentum.
Strong Bearish Momentum (Pink Candles):
Candles turn pink when strong downward momentum is detected. The same technique identifies when selling pressure is dominant, pushing prices lower at a significant pace.
Pink candles indicate that bearish forces are strong, with the price likely to keep declining, making it a potential opportunity for short-selling or exiting long positions.
This color scheme is particularly beneficial for traders who prioritize momentum-based strategies. The clear distinction between strong bullish (yellow) and bearish (pink) momentum provides an instant visual cue, enabling quick decision-making.
Entering Trades:
Traders might choose to enter long positions when a series of yellow candles appears, indicating strong bullish momentum.
Alternatively, pink candles may signal an opportune moment to enter short positions, capturing the market's downward momentum.
Exiting Trades:
A shift from pink to yellow candles in a previously bearish trend could indicate a reversal, prompting traders to exit short positions.
The Market Waves toolkit is a powerful collection of unique and powerful tools. Please use DD when trading and always manage risk.
Tập lệnh trả phí
