Candlestickpattern
PA Extremely Early version
Experimenting with traditional "market structure" and candlestick patterns for trend analysis

Naked Forex - Kangaroo Tail IndicatorIndicator which identfies a kangaroo tail as defined in the book naked forex
A kangaroo tail is defined as
- a candle where the body closes in the upper or lower third
- which has room to the left

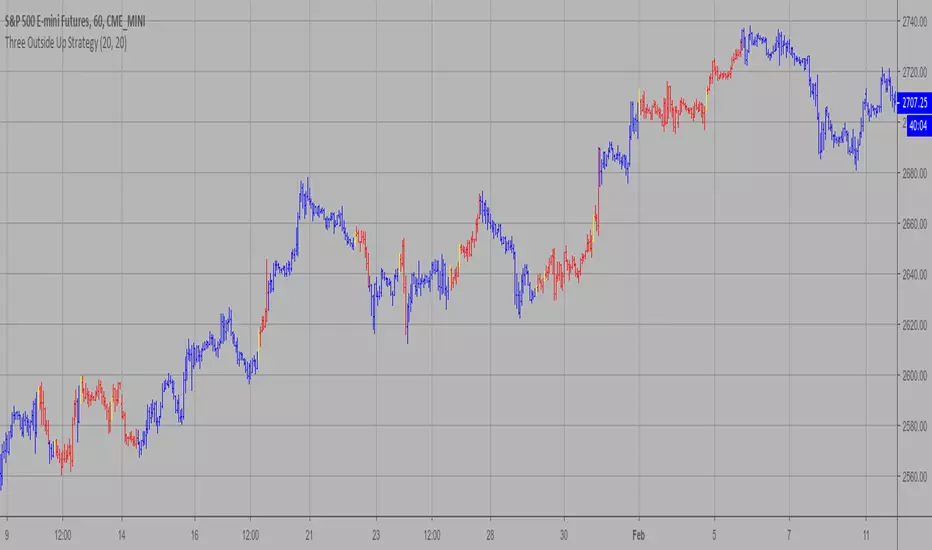
Three Outside Up Strategy This is a three candlestick bullish reversal pattern consisting of a bullish
engulfing pattern formed by the first two candlesticks then followed by an up
candlestick with a higher close than the prior candlestick.
WARNING:
- This script to change bars colors.
Three Outside Down Strategy This is a three candlestick bearish reversal pattern consisting of a bearish
engulfing pattern formed by the first two candlesticks then followed by a down
candlestick with a lower close than the prior candlestick.
WARNING:
- This script to change bars colors.

BH - Candlestick Pattern DetectionThis is a script to help the beginners locate the candle patterns. It has a nice code that can be used in other scripts too. Easy to use with separated functions, simple patterns and complex patterns detections.
I have done some updates at the Candlestick Patterns Identified script by @repo32. Was a good start of my ideia. Tks for sharing repo.
It will be always under constant development but I want to share this first version to know what can be done to get better, improve, get more desired patterns, know what are you guys using that could be helpful.
I still need to check if all patterns are correct.
Any comments, help and suggestions will be appreciated.
Marcos Issler @ Isslerman

Average Candle LengthThis script is designed to show you the average candle size in pips (wick to wick) for however many bars you choose (20 is default).
The idea is that if the average candle size for the last 20 bars is, let's say 25, you would probably not want to set your stop loss less than 25 because it is more likely to get hit.
if you find this script helpful, tips and donations are always appreciated (venmo @rick-munoz) :)

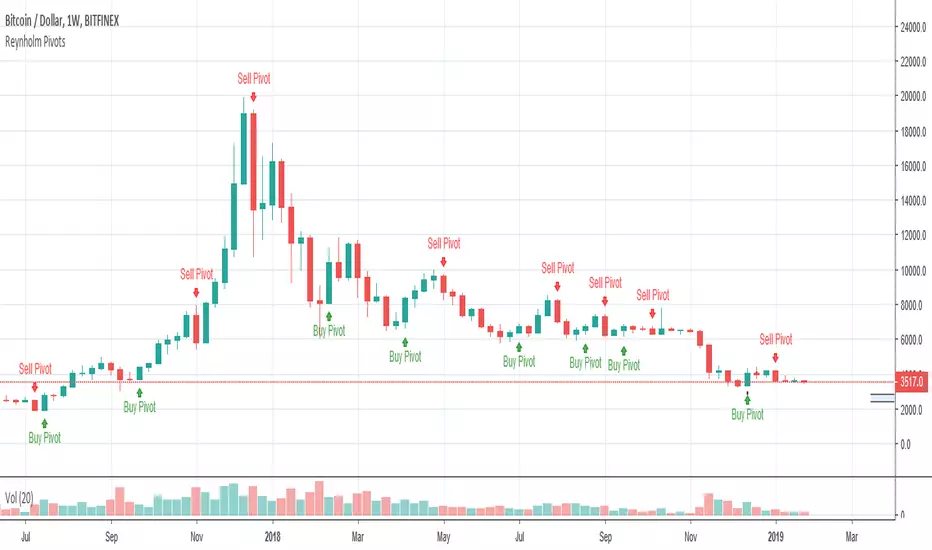
Reynholm PivotsReynholm Pivots are used by Forex, Futures and Stock Traders to flag possible reverse points. These pivots work best on higher times such as the monthly, weekly and daily time frames. I don't recommend using Reynholm Pivots on time frames lower than the daily chart. This pivots are not "buy" or" sell" signals and should not be used for this purpose, but used in conjunction with other technical and or fundamental analysis.
EMA BounceThis indicator will:
signal a GREEN triangle if a candle opens below the EMA and closes above the EMA
signal a RED triangle if the candle opens above the EMA and closes below the EMA
Strategy:
First identify the trend (stick to one timeframe, I use 4h)
If in an UP trend, then go LONG on GREEN triangles, do not trade red triangles as that would be a counter-trend trade (I am placing buy stops at the HIGH of the signal candle)
If in a DOWN trend, then go SHORT on RED triangles, do not trade on green triangles as that would be a counter-trend trade (I am placing sell stops at the LOW of the signal candle)
Default EMA is set to 50, you can change to a higher number for less signals or a lower number for more signal
NOTE: You can set up alerts so that you don't have to watch charts and wait for the signals.
If you find this indicator useful, tips and donations are always appreciated. Venmo @rick-munoz :)

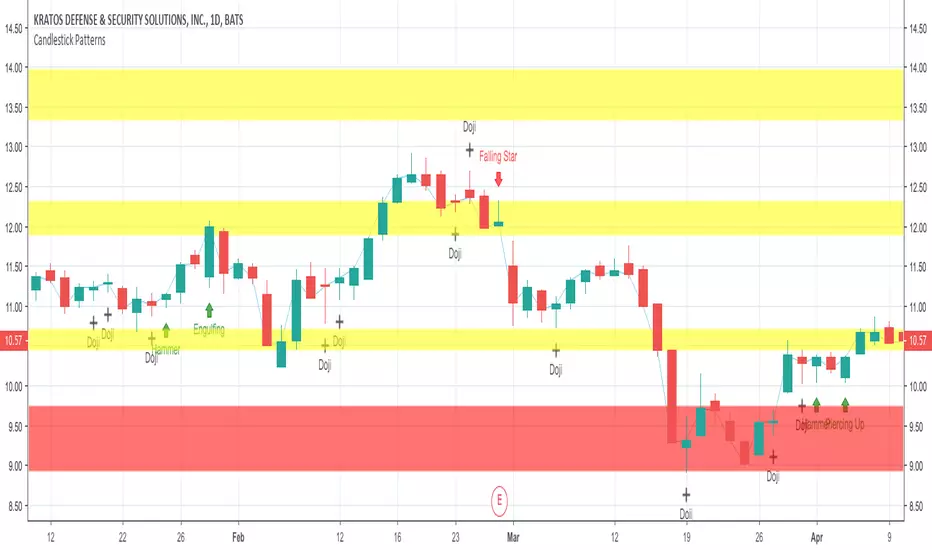
Candlestick Patterns DemoMy first Pine Script attempt to identify and display candlestick patterns on the chart. In this demo version the script identifies Doji, Bullish Engulfing and Bearish Engulfing patterns.

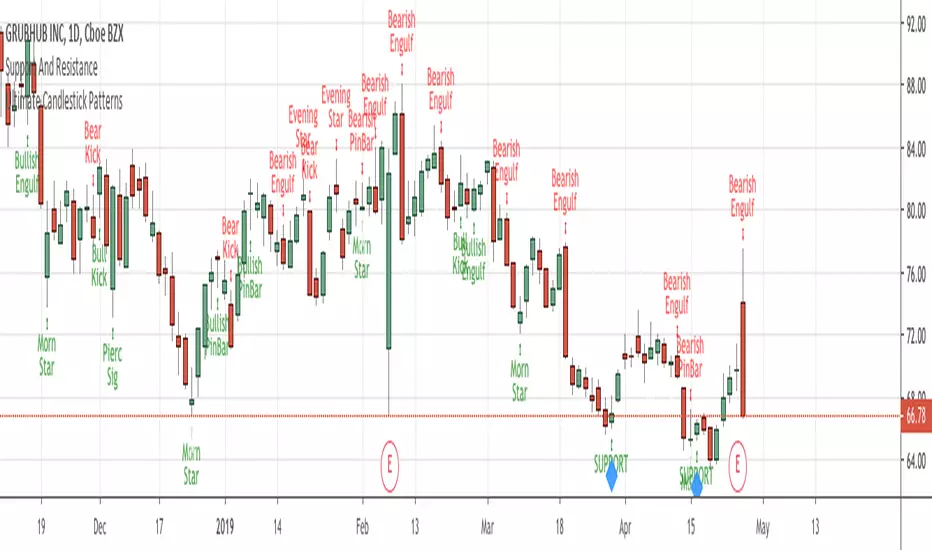
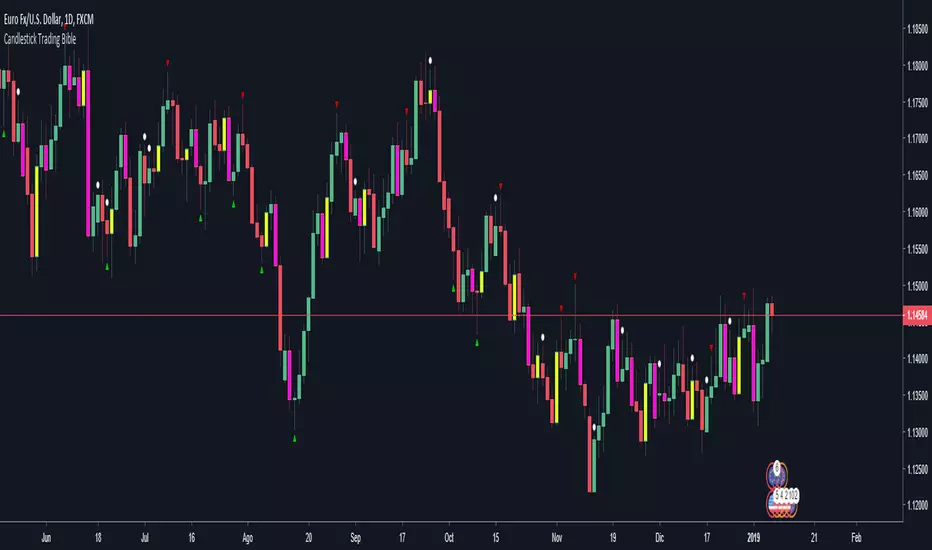
Candlestick Trading Bible pack: Engulfing + Pin bar + Inside barHelpful indicator that overlays the price with colors and arrows for understanding easily engulfing, pin bar and inside bar formations as seen in the book "The Candlestick Trading Bible" IG of writer: @price.action.strategies
How it works:
-Bullish engulfing: yellow
-Bearish engulfing: fuchsia
-Pin bars: up/down green/red arrows
-Inside bars: white circle above the inside candle
----------
I do not have any relationship with the writer or the book mentioned above. The explanations in it may differ from what is drawn on the graph.
Candles HistoryA utility tool to get some metrics from the whole candles history.
Consider it as my Christmas gift to the community.
Available metrics
Starting Year
Starting Month
Starting Day
Starting Weekday
Starting Hour
Starting Minute
Highest Volume (works correctly only on the tickers with available volume data)
Lowest Volume (works correctly only on the tickers with available volume data)
Longest Candle Range
Average Candle Range
Longest Candle Body
Average Candle Body
Available Candles
Bullish Candles
Bullish Trend Candles (body >= range / 2)
Bearish Candles
Bearish Trend Candles (body >= range / 2)
Doji Candles
Bullish Marubozu Candles
Bearish Marubozu Candles
Longest Bullish Serie
Longest Bearish Serie
Good luck!

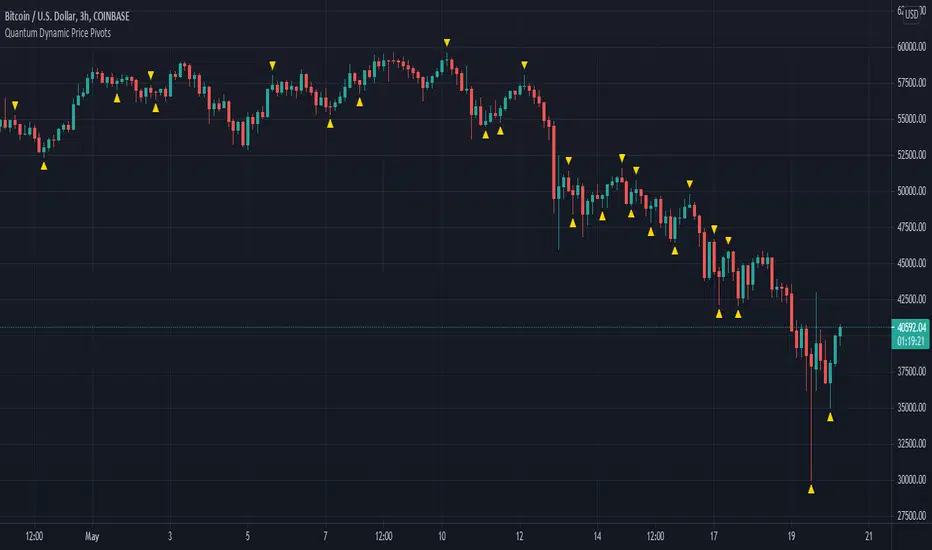
Quantum Dynamic Price PivotsFor aspiring price action traders, reading a candle chart at speed can be learned, but is a skill which takes years to perfect. For lesser mortals, help is required, and this is where the Quantum Dynamic Price Pivots indicator steps in to help.
As a leading indicator based purely on price action, the indicator delivers simple clear signals in abundance, highlighting potential reversals with clinical efficiency. Just like volume and price, pivots are another ‘predictive’ indicator and a leading indicator of price behaviour. And this is just the starting point for the ‘Swiss army knife’ indicator.
Pivot points can then be used to identify congestion phases of price action, as they are created dynamically, as well as define trends, again in real time. And of course, not forgetting possible trading opportunities as well.
Two specific pivot signals are displayed. A pivot low, and a pivot high. Both are shown with a yellow triangle. The pivot low is triggered, when the candles or bars either side have a higher high and a higher low than that in the middle. The pivot high is triggered when the candles or bars on either side have a lower high and a lower low. These simple phases of price action then signal potential reversals along with pauses points into congestion, and the development of longer term trends.
In congestion phases, the pivots mark the highs and lows of the phase dynamically. In the trend phase, again they mark the upper and lower trend lines as the price action develops.
This is why we refer to it as the ‘Swiss army knife’ indicator. Simple and elegant, yet powerful and functional with many uses. And when coupled with the Quantum Live Camarilla Levels indicator, really does allow you to take advantage of these key turning points, dynamically.
Get yours today, and take the hard work out of price action trading.
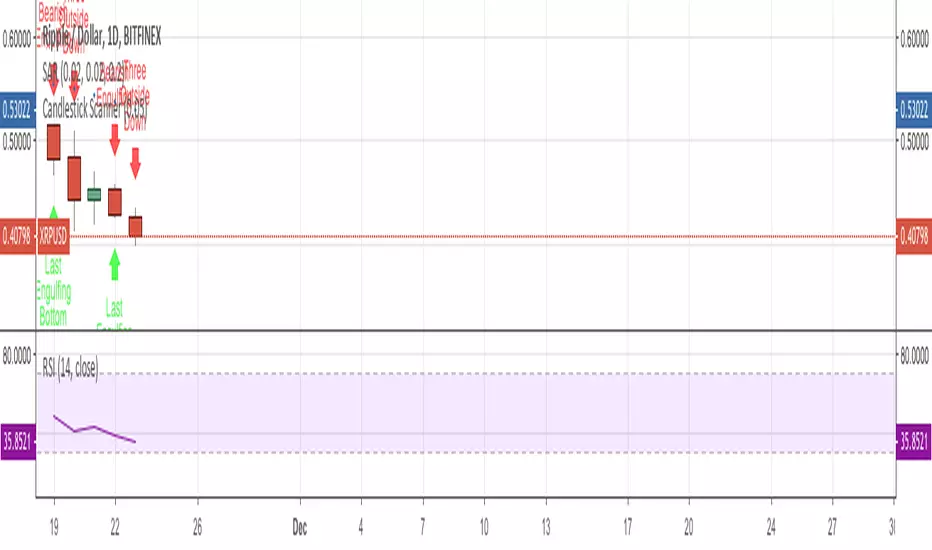
Candlestick ScannerThis is a large compilation of candlestick patterns that allows the user to detect up to 42 different bullish and bearish patterns.
This script is intended to be a Pine Editor version of the one I normally used on a different platform, so your feedback is more than welcome to help me improve it, as fine tuning is ongoing.
New patterns will be added in the next couple of days.
Happy trading!


Engulfing Candle IndicatorThis script shows you where a candle is either bullish or bearish engulfing the previous candle.
A GREEN triangle below the bar pointing UP indicates that the candle is BULLISH engulfing the previous candle
A RED triangle ABOVE the bar pointing DOWN indicates that the candle is BEARISH engulfing the previous candle

🥢Crypto-Sticks: Absolute Strength Index Osc. by Cryptorthyhms🥢Crypto-Sticks™: Absolute Strength Index Oscillator (Tudor Marcelin)
A new series of indicators brought to you by Cryptorhythms...giving you an alternate look at your trusted favorites! Follow me, there are still 2 dozen Crypto-Sticks indicators planned - all will be released in public library.
🚀Indicator Specific Info
New Crypto-Sticks option is an EMA of the average signal line output. Eventually I will go back and update the previous indicators with this feature as well!
Heiken Ashi candles (default) adds some more clear trend changing points. HA example here:
Volume weighting the HA candles adds a different dimension to the indicator which I have to explore more fully. VW
adds too much noise in my opinion, especially during periods of higher volatility. I left there in case you want to experiment. An example of VW+HA:
💭Please leave me any ideas or feedback you have!
🚫If you use volume weighting you should be on heiken candles.
🚀Crypto-Sticks General Info
🚧This series isnt polished 100%, and I have some more options I will add in the future. But for now, I want to just release them, as I am not sure when I will have the time to put more work into them (many other big projects I am working on).
📊Its basically reinterpretations of all your favorite indicators. I calculate the values a little bit differently than normal, but the end result is creating a candlestick chart (for the indicator!). Then I added the option to plot them as Heiken Ashi candles to smooth out noise and make signaling easier. I recommend using the indicator on this setting.
🔊Lastly I implemented a Volume Weighting system for them all which simply integrates volume into the formulas for these indicators. For the most part this feature is experimental and doesn't provide huge utility (yet - I have other ways I want to try it as well - just no time). Though on some of the indicators it already shows great promise.
👍Enjoying this indicator or find it useful? Please give me a like and follow! There are many more indicators to be released in this series, not to mention I post crypto analysis and other free indicators regularly.
💬Questions? Comments? Want to get access to an entire suite of proven trading indicators? Come visit us on telegram and chat, or just soak up some knowledge. We make timely posts about the market, news, and strategy everyday. Our community isnt open only to subscribers - everyone is welcome to join.

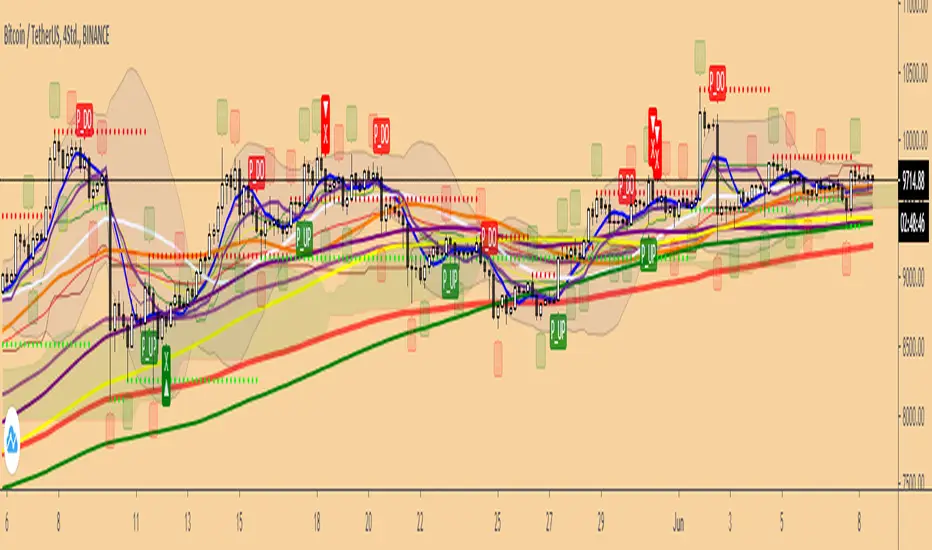
Quantum All in One Crypto Indicator V1Quantum All in One Crypto Indicator V1
Features
6 EMA
6 MA + Slow & Fast
Ichimoku
Bollinger
Fractals
CDC Strategy
Colored Bars
Pivot´s and more..
have fun
Version V1.5 in Progress
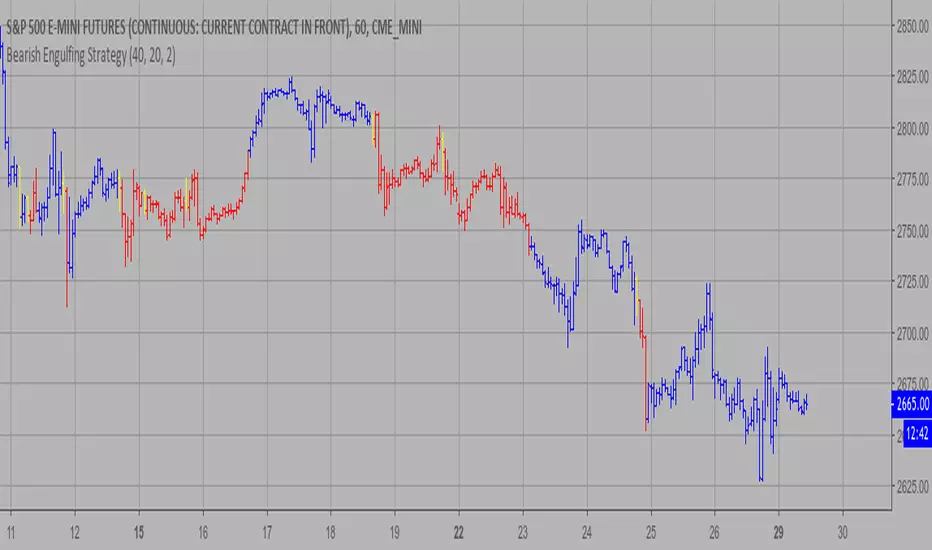
Bearish Engulfing Strategy This is a bearish candlestick reversal pattern formed by two candlesticks.
Following an uptrend, the first candlestick is a up candlestick which is
followed by a down candlestick which has a long real body that engulfs or
contains the real body of the prior bar. The Engulfing pattern is the reverse
of the Harami pattern.
WARNING:
- This script to change bars colors.
IO_CWL IndexCandlestick body and Wick Length Index (CWL)
Shows a trend chart of candle body length and wick length.
Green -> Candle body
Red -> Candle Wick
-- Invsto

Extreme Reversal Setup Price ActionThe extreme reversal setup is a fabulous signal that I've back tested over countless years of data on many
instruments, different timeframes, and using various trade management methodologies. The results have always been highly favorable. Needless to say, this setup remains a key staple of my trading arsenal. The extreme reversal setup is a classic "rubber band" trade. When a rubber band is stretched to its limits and then released, it snaps back in the direction from whence it came. We are looking to trade the snapback reversal with this setup.
The basic setup occurs when an extremely large candle forms that is about twice the size of the average
candlestick. While this candle may indicate that a continuation will be seen, the second bar of the pattern does not confirm a continuation and, instead, is an opposing candle that signals an upcoming reversal. When this occurs, you have a fantastic opportunity to buy below value, or sell at a premium.
The extreme reversal setup looks to capitalize over-extended situations in the market, as responsive buyers and sellers will enter the market to push price back in the opposite direction.
Courtesy : Frank Ochoa.
