Jurik MA Trend Breakouts [BigBeluga]🔵 OVERVIEW
Jurik MA Trend Breakouts is a precision trend-breakout detector built on a custom Jurik-smoothed moving average.
It identifies trend direction with ultra-low lag and maps breakout levels using pivot-based swing highs/lows.
The indicator plots dynamic breakout lines and confirms trend continuation or reversal when price breaks them — providing clean, minimalistic yet extremely accurate trend signals.
🔵 CONCEPTS
Jurik Moving Average (JMA) — A highly smooth and low-lag moving average that reacts quickly to trend shifts without noise. This becomes the core trend baseline.
Trend Bias —
• JMA rising → bullish trend
• JMA falling → bearish trend
The JMA color updates instantly based on slope.
Swing Pivots — Recent pivot highs/lows are detected to define structural break levels while filtering out weak noise.
Trend Breakout Levels —
The indicator draws horizontal levels at the last valid pivot in the direction of the trend.
These levels act as “confirmation gates” for breakout entries.
ATR Validity Filter — Ensures only meaningful pivots within a threshold are used to prevent fake breakouts.
🔵 FEATURES
Ultra-Smooth Jurik Trend Line — A visually clean trend baseline changing color based on direction.
Automatic Swing High Breakout Setup (Bullish) —
• During an uptrend, the indicator tracks the most recent pivot high.
• A horizontal breakout line is extended across the chart.
• A ✔ marker appears at both pivot points when the breakout structure becomes valid.
Automatic Swing Low Breakout Setup (Bearish) —
• During a downtrend, pivot lows are tracked.
• A horizontal breakout line marks the breakdown level.
• ✔ markers confirm valid structure before the breakout triggers.
Breakout Detection —
• Price closing above the bullish breakout line → “↑” signal printed on the chart.
• Price closing below the bearish breakout line → “↓” signal printed on the chart.
Automatic Reset on Trend Change —
When the JMA trend flips, all breakout structures are cleared and the model starts tracking new pivot levels.
Trend-Colored Visualization —
Glow + main JMA line give instant clarity of market direction.
🔵 HOW IT WORKS
1. JurikMA defines the main trend — Slope determines bullish or bearish state.
2. The indicator continuously searches for pivots in the direction of the trend.
3. When a valid pivot forms and passes ATR proximity filter, a structural breakout level is drawn.
4. As long as price stays below that level (bullish case), the trend setup remains active.
5. When price finally breaks the level , the indicator prints a directional arrow (↑ or ↓).
6. Trend flip instantly resets all levels and begins tracking pivots on the opposite side.
🔵 HOW TO USE
Breakout Trading — Enter long on “↑” and short on “↓” signals when price breaks key pivot structure.
Trend Confirmation — Use the JurikMA color to stay aligned with the main trend direction.
Reversals — Trend flips often mark major turning points.
Structure Mapping — Use the horizontal breakout lines to understand how close price is to confirming a new trend leg.
🔵 CONCLUSION
Jurik MA Trend Breakouts combines the speed of a Jurik MA with structural breakout logic to deliver clean, reliable entry signals.
Its minimal design, pivot-based confirmation, and trend-aligned logic make it suitable for scalping, swing trading, and intraday trend continuation setups.
If you want fast yet filtered breakout recognition with almost zero noise, this tool gives you everything you need.
Mẫu Biểu đồ

Cyberpunk Pattern Engine⚡ Cyberpunk Pattern Engine: Neon Technical Analysis
Upgrade your chart aesthetics while maintaining surgical precision. The Cyberpunk Pattern Engine is a high-performance pattern recognition script designed to identify classic reversal formations with a futuristic, neon-soaked visual style.
🛠️ Key Features
・Automated Pattern Detection: Real-time identification of four major price action structures:
・Double Top (DT) - Neon Pink
・Double Bottom (DB) - Neon Cyan
・Head & Shoulders (H&S) - Neon Green
・Inverse H&S (iH&S) - Neon Gold
・Cyber-Visuals: Uses the linefill engine to create semi-transparent glowing triangles, making chart patterns instantly recognizable without cluttering your price action.
・Dual-Language Support: Toggle labels between English and Japanese with a single click.
・Sensitivity Control: Adjust the "Pivot Period" and "Max Difference %" to filter out market noise and find only the most textbook-perfect setups.
🚀 How to Use
1. Pivot Period: Larger values find long-term trends; smaller values find scalp opportunities.
2. Max Difference: Controls how "equal" the tops/bottoms must be. Decrease for strict perfection, increase for more frequent signals.
3. Confirmation: The engine paints the completed pattern once the price crosses the neckline (confirmation level).
日本語版 (Japanese Description)
⚡ Cyberpunk Pattern Engine: ネオン・テクニカル・エンジン
チャート分析に「美学」と「精度」を。Cyberpunk Pattern Engineは、伝統的なチャートパターンを検出し、近未来的なサイバーパンク・スタイルで可視化する高性能インジケーターです。
🛠️ 主な機能
・自動パターン検出: 主要な4つの反転パターンをリアルタイムで識別します:
・ダブルトップ (DT) - ネオンピンク
・ダブルボトム (DB) - ネオンシアン
・三尊 / Head & Shoulders (H&S) - ネオングリーン
・逆三尊 / Inverse H&S (iH&S) - ネオンゴールド
・サイバー・ビジュアル: linefill機能を駆使し、半透明の光る三角形で描画。チャートの視認性を損なうことなく、瞬時に形状を把握できます。
・2ヶ国語対応: ラベル表示を日本語と英語で切り替え可能。
・感度カスタマイズ: 参照期間(Pivot Period)や許容誤差(Max Diff %)を調整することで、ノイズを排除し、自身のトレードスタイルに最適な形状のみを抽出できます。
🚀 使い方
1. 参照期間 (Pivot Period): 数値を大きくすると長期足レベルの大きな波を、小さくするとスキャルピング向けの小さな波を検出します。
2. 許容誤差: 頂点や肩の高さがどれくらい揃っていればパターンとみなすかを調整します。厳格な判断には数値を下げてください。
3. 確定条件: 価格がネックラインをブレイクし、パターンが完成したタイミングで描画が実行されます。

Cup & Handle (Zeiierman)█ Overview
Cup & Handle (Zeiierman) is a classic continuation-pattern scanner that detects both bullish Cup+Handle and bearish Inverted Cup+Handle structures using a compact pivot stream. It’s designed to highlight rounded reversals back to a “rim” level, followed by a smaller pullback (“handle”) before a potential continuation move.
⚪ What It Detects
A Cup & Handle (Bull) forms when price makes a rounded decline from a left rim, bottoms, then climbs back to a similar right rim. After returning to the rim, price forms a handle (a smaller pullback) that stays within an allowed retracement range. This pattern often precedes a bullish continuation attempt.
An Inverted Cup & Handle (Bear) is the mirrored version. Price makes a rounded rise to a left rim, tops, then declines back to a similar right rim. After returning to that rim, price forms a handle (a smaller bounce) that stays within the allowed retracement range. This pattern often precedes a bearish continuation attempt.
█ How It Works
⚪ 1) Pivot Extraction (Swing Compression)
The script first converts raw candles into a small set of meaningful swing pivots using ta.pivothigh() and ta.pivotlow() with Pivot span. A pivot is accepted only after it is confirmed by the lookback window, which helps reduce noise.
Key effect:
Higher Pivot span = fewer, stronger pivots (cleaner patterns)
Lower Pivot span = more pivots (more patterns, more noise)
⚪ 2) Pattern Framing (4-Point Structure)
When at least four pivots exist, the script maps them into a fixed sequence:
For a bull Cup+Handle sequence: High → Low → High → Low
These are treated as:
L = left rim pivot
B = cup bottom pivot
R = right rim pivot
H = handle pivot
For a bear inverted Cup+Handle sequence: Low → High → Low → High
Mapped similarly, but inverted.
This “4-pivot” structure is the minimum shape needed to define a cup and a handle without overfitting.
⚪ 3) Rim Similarity Filter (Cup Quality Control)
The script checks if the left rim and right rim are close enough to be considered a proper cup rim:
Rim similarity tolerance (%) controls this.
Lower tolerance = only very clean symmetric rims
Higher tolerance = allows uneven rims (more detections)
⚪ 4) Handle Depth Filter (Reject Weak or Messy Handles)
The handle is validated by measuring how deep it retraces relative to the cup depth:
Handle Retraction = |rim − handle| / |rim − bottom|
The handle must fall between:
Handle retrace min
Handle retrace max
This prevents:
tiny “non-handle” wiggles (too shallow)
deep pullbacks that break the structure (too deep)
█ How to Use
⚪ Interpreting a Bull Cup & Handle
Treat it like a continuation setup built around a key breakout level:
Cup forms
Handle forms
Breakout happens above this level
Once price returns to this breakout zone and the handle stays controlled, the structure may attempt to continue upward.
Common behaviors after a clean signal:
Push above the breakout level
Brief retest/acceptance near the breakout zone
Continuation toward the projected target if momentum holds
⚪ Interpreting a Bear Inverted Cup & Handle
Treat it like a bearish continuation/rollover setup built around the same breakout concept:
Cup forms (inverted)
Handle forms
Breakout happens below this level
Once price returns to this breakout zone and the handle stays controlled, the structure may attempt to continue downward.
Common behaviors after a clean signal:
Drop below the breakout level
Retest from underneath
Continuation toward the projected target if selling pressure persists
█ Settings
Pivot span – pivot sensitivity. Higher = smoother pivots, fewer signals. Lower = more pivots, more signals/noise.
Rim similarity tolerance (%) – rim quality filter. Lower = stricter symmetry, higher = more permissive detection.
Handle retrace min – minimum handle depth (filters weak handles).
Handle retrace max – maximum handle depth (filters messy/deep handles).
Invalidation (handle max retrace %) – “maximum tolerated damage” for handle move before the structure is considered broken.
Require breakout confirmation – only trigger when price closes beyond the rim in the expected direction.
Target multiplier (× cup depth) – scales how far the projection target is. Lower = closer targets; 1.0 = classic depth target.
-----------------
Disclaimer
The content provided in my scripts, indicators, ideas, algorithms, and systems is for educational and informational purposes only. It does not constitute financial advice, investment recommendations, or a solicitation to buy or sell any financial instruments. I will not accept liability for any loss or damage, including without limitation any loss of profit, which may arise directly or indirectly from the use of or reliance on such information.
All investments involve risk, and the past performance of a security, industry, sector, market, financial product, trading strategy, backtest, or individual's trading does not guarantee future results or returns. Investors are fully responsible for any investment decisions they make. Such decisions should be based solely on an evaluation of their financial circumstances, investment objectives, risk tolerance, and liquidity needs.

Std Dev Channel [fmb]What it is
A professional regression channel that combines standard deviation divisions, an extreme price envelope, and a trend quality gauge. It is designed for fast read-and-act decisions on any timeframe, with sensible presets and log-space math for instruments that trend exponentially.
Why it’s different
Most channels draw fixed ±1σ and ±2σ around a regression line. This tool adds:
- Fibonacci-spaced σ divisions for precise scaling
- An objective MaxEnvelope of actual extremes with optional 1.272 and 1.618 extensions
- Pearson’s R labelling that classifies the trend as Strong Up, Moderate, Weak, or Strong Down
- A log-space option so channels behave correctly on long trends and high beta charts
How it works
Base line
- Linear regression of the last Length bars, drawn as a ray.
- Optional colour change by regime using Pearson’s R.
Divisions (StdDev or MaxEnvelope)
- StdDev basis: σ of residuals around the regression line.
- MaxEnvelope basis: distances from the base line to the farthest highs and lows in the lookback.
- Divisions can be Fibonacci multiples (0.382, 0.618, 1.000, 1.272 by default) or uniform steps.
Outer rails
- ENV 1.0 touches the farthest highs and lows within the window.
- Optional extensions at 1.272 and 1.618 highlight stretch and breakout zones.
Trend quality (Pearson’s R)
- R is computed on the same series and window.
- Default thresholds: Strong when |R| ≥ 0.70, Weak when |R| < 0.40.
- The label reads: R 0.XXX • Class, plotted near the most recent base value.
Log-space math
- When enabled, the model runs on ln(price) and converts the outputs back to price.
- Safer on multi-year charts and large percentage trends.
Presets
- Swing: Length 125, StdDev basis, Fib divisions, ENV 1.0 and 1.272 on
- Intraday: Length 240, StdDev basis, simple ±1 and ±2 style divisions, ENV off by default
- Position: Length 200, StdDev basis, compact Fib set for higher timeframes
You can turn preset overrides off to make every input respond instantly.
Inputs you will actually use
- Length, Source, Log-space ON or OFF
- Basis: StdDev or MaxEnvelope
- Divisions: Fib list or Step and Max multiple
- Outer rails: show ENV 1.0, show 1.272, show 1.618
- Labels and sizes, extend left or right
- Hide divisions or outer rails automatically when the regime is Weak
Alerts included
- Close crosses above or below ENV 1.0
- Close crosses above or below ENV 1.272 and 1.618 (if enabled)
Practical playbook
Trend following
- In Strong Uptrend: buy pullbacks near 0.382 to 0.618 above the base with stops just beyond the next lower division.
- In Strong Downtrend: sell bounces into 0.382 to 0.618 below the base with stops just beyond the next upper division.
Mean reversion
- When R is Moderate or Weak, fade moves that tag ENV 1.0 back toward the base.
- If price closes through an ENV extension, treat it as potential regime change and stand down on fades.
Breakouts
- A close through ENV 1.0 with R rising toward Strong often precedes trend acceleration.
- Use the next division or the 1.272 rail as the first target and trail on the base.
Tips
- Keep Length stable across symbols you compare. Consistency beats curve fitting.
- Use log-space on multi-year equities and crypto. Use linear for short intraday work.
- If you want a classic look, disable Fib and rails, set Step 1.0 and Max 2.0.
Notes
- The tool draws more lines when Fib divisions are active. If it feels busy, show divisions only and hide labels, or keep ENV 1.0 plus one extension.
- Pearson’s R is descriptive, not predictive. Combine with price structure and volume for entries.

Flexible S/R Channels🟩 Flexible S/R Channels is a visualization tool that draws curved support and resistance boundaries through user-defined anchor points. Unlike traditional trendlines and channels that force linear interpretation onto price action, this indicator captures the curved structures that markets frequently form—rounded tops and bottoms, parabolic advances and declines, arcing rallies and pullbacks. Three anchor points per curve define the shape; the indicator fits a smooth mathematical curve through these points and projects it forward. The approach is simple: draw what you see. Curved market structure that resists precise definition with traditional tools can now be rendered with mathematical accuracy.
The indicator bridges the gap between static drawing tools and programmable indicators. TradingView's arc tool draws curves but produces only visual pixels with no analytical value. Flexible S/R Channels creates live data series that integrate with other analysis tools. Four curve-fitting methods—Quadratic, Quadratic-Linear, Weighted Linear, and Natural Cubic Spline—accommodate different market structures. The curved levels naturally lend themselves to breakout and reversion strategies—applications left to the trader's discretion. The open-source code invites experimentation and customization.
💡 THEORY AND CONCEPT 💡
Traders have long relied on horizontal levels and diagonal trendlines to define support and resistance. Linear tools assume constant slope—a property rarely exhibited by actual market movement. When momentum accelerates or decelerates, price trajectories curve rather than hold to fixed angles. The resulting structures—parabolic advances during expansion phases, arcing pullbacks during consolidation, rounded formations at reversal points—represent changes in the rate of change itself. Traditional drawing tools cannot accommodate this variable geometry without sacrificing mathematical precision..
Flexible S/R Channels extends familiar support and resistance concepts into curved space. The approach is simple: draw what you see. When the eye recognizes a curved boundary in price action, this indicator provides the means to define it precisely. Three anchor points per curve—an initial point, an intermediate point, and a recent point—are all that is required. The indicator fits a smooth mathematical curve through these points and extends it forward as a projection.
This indicator represents a blend of human pattern recognition and algorithmic precision. Fully automated indicators make decisions without user input—efficient but detached from trader discretion. Manual drawing tools rely entirely on freehand skill—expressive but imprecise. Flexible S/R Channels occupies the middle ground. The trader identifies the curved structure; the algorithm renders it mathematically. The result is human insight expressed with computational accuracy—for traders who recognize curved structure in price action but lack precise tools to define it.
This projection is not a prediction. It is a visual hypothesis—a structured way of asking "if this trajectory continues, where would price be?" The underlying assumption is simple: like Newton's first law of motion, a trajectory in motion tends to continue unless acted upon by an external force. Future price action validates or invalidates the projection, just as it does with any trendline or channel.
TradingView offers an arc drawing tool for freehand curved lines, but these are purely visual—static pixels on a screen with no programmable value. Flexible S/R Channels bridges this gap. The fitted curves exist as data series that can generate alerts, trigger signals, and interact with other analysis tools. The visual drawing becomes operational structure.
🔁 CURVE METHODS 🔁
The indicator offers four curve-calculation methods, each producing different shapes suited to different market structures:
Quadratic — Fits a parabolic arc through the three anchor points. Best for smooth, continuous curves such as rounded tops and bottoms. It captures the natural "swing" of the market, assuming the momentum will maintain its current rate of acceleration or deceleration.
Quadratic-Linear — Uses a parabolic curve through the anchor points, then transitions to a straight line after the final anchor. Useful when curved structure gives way to linear trend continuation. This is the "bridge" between a turning market and a steady, directed move, preventing the projection from curving back on itself when the price begins to run.
Weighted Linear — Connects anchor points with straight line segments rather than a smooth curve. Suited for angular market structures with distinct inflection points. It treats the market as a series of rigid shifts, providing a clear "corridor" when the price is bouncing between sharp, diagonal levels.
Natural Cubic Spline — Produces the smoothest curve by minimizing abrupt directional changes. Ideal for organic, flowing market movements. It acts as a flexible spine that adapts to complex transitions without the rigid constraints of a fixed geometric shape.
Quadratic Fitting : A smooth, parabolic arc defines a curved resistance boundary. By fitting a mathematical path through three anchor points, the curve captures rounded structures and arcing price action that traditional linear trendlines fail to represent.
Weighted Linear Fitting : This method produces an angular, segmented path by connecting anchor points with distinct linear slopes. Unlike the continuous smoothness of a quadratic arc, the weighted linear approach creates a more jointed geometry, allowing for a precise match to market structures that exhibit sharp, localized changes in trajectory.
Natural Cubic Spline Fitting : This method creates a highly fluid, elastic curve that can accommodate complex price oscillations. In this instance, the curves define a narrowing range as support and resistance converge, highlighting the volatility compression that often precedes a significant breakout or breakdown from established structures.
🖱️ HOW IT WORKS 🖱️
1️⃣ Initial Setup
Unlike traditional indicators that calculate values automatically from price data, Flexible S/R Channels requires user-defined anchor points. This is intentional. The trader's eye is the pattern recognition engine—no algorithm can see the curved structure that experience and intuition reveal. The indicator waits for this input, then applies mathematical precision to render what the trader has identified.
The Recognition of Natural Structure : Effective analysis begins when a curved rhythm becomes visible within price action that traditional trendlines cannot satisfy. Identifying the specific swing highs and swing lows that define these boundaries is the first step in organizing a chart. By isolating three key pivots for resistance and three for support, the underlying framework of the market's trajectory is established, providing the necessary coordinates to accurately map the path.
Interactive Setup Workflow : Upon loading, the indicator prompts for the sequential selection of six points—three swing highs and three swing lows—to serve as the raw data for the calculation. While the chart remains blank during this initial phase, the curves generate instantly once the final anchor is confirmed. These points are not permanent; they appear as interactive grips that can be dragged in real time to refine the boundaries as the market structure evolves.
The indicator prompts for six sequential selections—three for resistance, three for support. The first three selections define the resistance boundary; the final three define support. This sequential grouping is distinct from zigzag-style selection patterns. Within each group, clicking order is flexible—the algorithm automatically sorts points chronologically, allowing traders to select visually prominent pivots in whatever sequence feels natural.
Structural Anchor Identification : Identifying three key swing highs and three key swing lows provides the foundation for the dual-curve geometry. These specific structural peaks and troughs serve as the coordinates for the mathematical models, ensuring that the resulting boundaries accurately reflect the underlying skeleton of the market action.
2️⃣ Interactive Adjustment
After the initial setup, all six anchor points are fully adjustable:
Points are automatically sorted chronologically regardless of selection order
Grip handles appear at each anchor location
Any point can be repositioned by clicking and dragging its grip handle
The curves recalculate instantly as points are adjusted
The algorithm produces a mathematically perfect curve based on the anchor points provided. If the result does not match the trader's vision, adjustments are immediate. This iterative refinement—see, adjust, refine—continues until the rendered curve represents what the trader sees in the price action. The user remains in control; the algorithm remains in service.
Interactive Channel Boundaries : Six user-defined anchor points—three for resistance and three for support —establish a non-linear range that moves beyond the constraints of a flat, horizontal channel. This configuration captures the arcing trajectory of the market while showing price action respecting the curved boundaries in a classic reversion pattern. By manually positioning these anchors, a dynamic dimension is added to the chart that maintains structural integrity even as the price follows a rounded path.
🛠️ SETTINGS 🛠️
Customizable Visual Feedback : Beyond the core geometry, the visualization offers various user-defined settings to tailor the chart's information density. From identifying specific price targets to toggling structural labels, these options allow the trader to adjust the level of detail to suit their personal analysis style while maintaining a clear view of the non-linear boundaries.
Configuration Options
Curve Method — Select the curve-fitting algorithm: Quadratic, Quadratic-Linear, Weighted Linear, or Natural Cubic Spline.
Projection Length — Number of bars to project the curves beyond current price action. Projections appear as dashed lines.
Visual Settings
Grip Size — Size of the draggable handles displayed at each anchor point. Set to zero to hide grips entirely.
Line Width — Thickness of the support and resistance curves.
Support Color / Resistance Color — Color settings for each curve.
Show Info Table — Toggle display of the info table showing the current curve method in the chart corner.
Advanced: Time/Price Coordinates
The settings panel includes precise time and price values for each of the six anchor points, grouped under Resistance Time/Price and Support Time/Price. These values are populated automatically when points are selected on the chart.
Adjusting anchor points by dragging the grip handles directly on the chart is faster and more intuitive. The time/price fields are available for situations requiring exact coordinate entry—such as aligning an anchor to a specific candle timestamp or a precise price level. These fields can be safely ignored unless fine-tuning is necessary.
🖼️ CHART EXAMPLES 🖼️
The Flexible S/R Channels indicator adapts to diverse market structures across multiple timeframes and instruments. Curved boundaries can define subtle momentum shifts in near-linear trends, dramatic reversals in rounding formations, or volatility compression as channels converge toward breakout points. The four curve-fitting methods accommodate different geometries—smooth parabolic arcs for continuous momentum changes, segmented linear paths for angular structures, and elastic splines for complex oscillations. Each anchor point adjustment instantly recalculates the curves, allowing iterative refinement until the rendered boundaries align with the trader's interpretation of market structure. Forward projections extend these mathematical relationships into future territory, providing visual context for hypothetical support and resistance levels if current trajectories persist.
Subtle Curve Alignment : Even in structures that appear linear, subtle curvature allows the channel boundaries to breathe with the market’s internal momentum. By utilizing three anchor points rather than two, the channel adapts to the slight acceleration of a trend, providing a more precise fit than a rigid, straight corridor.
Decelerating Momentum and Convergence : This classic rounding structure illustrates a transition where the initial wide oscillations between highs and lows begin to contract. As the boundaries converge, the curve captures the diminishing volatility and the shift in market energy, providing a clear visual representation of a trend losing its expansive momentum as it approaches a potential turning point.
Organic Trend Modeling : In an accelerating uptrend, the Natural Cubic Spline provides a highly adaptable boundary that mirrors the organic flow of momentum. This non-traditional approach allows the channel to follow complex price pulses that a standard linear trendline would likely cut through, maintaining a precise fit even as the angle of the trend shifts over time.
Non-Linear Projections : Unlike standard trendlines that converge at a fixed rate, curved projections adapt to the historical momentum of the move. This allows the indicator to map a dynamic squeeze, capturing the subtle nuances of how price action tightens toward an apex. It provides a more sophisticated view of future convergence points that traditional linear channels often fail to anticipate.
The "Draw What You See" Philosophy : Market structures are rarely perfect, and this example highlights the indicator’s ability to map unconventional rhythms. Rather than forcing price into a predefined category, the tool remains flexible enough to define any structural path the trader identifies. If you can see a trend's trajectory, the indicator can provide the mathematical framework to support it.
Comparative Projection Modeling : Using identical anchor points as above, this example demonstrates how selecting a different calculation method can alter the projected path. While the historical fit remains precise, the variation in the forward-looking trajectory allows traders to explore multiple mathematical interpretations of the same market structure, choosing the model that best aligns with the current volatility and trend behavior.
Extended Timeframe Channel Definition : This multi-year perspective demonstrates the indicator's ability to define curved channel boundaries across extended timeframes spanning hundreds of bars and multiple market cycles. The resistance curve captures the rounded distribution of swing highs while the support curve follows the accelerating base formation, creating a non-linear channel that frames long-term structural trends more precisely than traditional parallel channels or static trendlines.
Rounding Bottom Reversal and Channel Convergence : This example captures a classic rounding bottom formation—a reversal pattern that linear tools cannot adequately define. The Quadratic method produces a smooth parabolic arc through the resistance anchors, tracing the deceleration of the downtrend, the capitulation low, and the subsequent re-acceleration upward as a single continuous curve. The support boundary mirrors this momentum shift from below, creating a curved channel that narrows toward current price. This convergence represents structural compression—the boundaries tightening as volatility contracts and directional resolution approaches. Price action oscillates within these non-linear boundaries, demonstrating that channel behavior persists even when the geometry is curved rather than parallel. The projection extends both curves forward, mapping the hypothetical trajectory if the current momentum structure continues, providing visual context for potential breakout or breakdown levels as the channel reaches its apex.
Built-in Precision vs. Algorithmic Power : While TradingView offers basic curve drawing tools (shown here as dashed lines), the Flexible S/R Channels indicator elevates this concept into a functional analytical framework. By converting manual observations into mathematical models, it moves beyond mere drawing to provide a data-driven structure that can be utilized for advanced technical analysis and future Pine Script trading logic.
⚙️ TECHNICAL DETAILS ⚙️
Curve Fitting vs. Overfitting: The term curve fitting often carries negative connotations in quantitative analysis due to its association with overfitting—the practice of adjusting a model until it perfectly matches historical data, producing an illusion of accuracy that fails when applied to new data. The application here is fundamentally different. Flexible S/R Channels does not optimize parameters to maximize historical fit; it constructs a mathematical curve through user-selected anchor points, then projects that curve into unknown territory. The curve is not fitted to price data—it is fitted to structural pivots identified by the trader. The projection represents a hypothesis about trajectory continuation, not a prediction derived from statistical optimization. Future price action validates or invalidates this hypothesis in real time, exactly as it does with any trendline or channel. The anchor points remain fixed unless manually adjusted, ensuring the curve does not adapt to new data retroactively.
Non-Repainting Behavior: The indicator does not repaint historical bars. The mathematical coefficients that define each curve are calculated once—when the final anchor point is set—and stored as fixed values. These coefficients remain constant unless an anchor point is manually repositioned. The backfit polyline is drawn once using these coefficients, spanning the known range from the first to last anchor point. The plot() function applies the same coefficients to each subsequent bar, updating in real-time as new bars form but never altering previously plotted values. The projection polyline extends forward from the current bar using the same fixed coefficients, projecting a user-defined number of future bars (maximum 500). This projection redraws on each tick to maintain its position relative to the moving current bar, but the mathematical trajectory remains constant—only the starting point advances. The current bar's curve value will update tick-by-tick as price develops, which is standard real-time behavior, not repainting. Once a bar closes, all curve values on that bar are permanent. The hybrid architecture (backfit polyline for known history, plot() for unlimited real-time range, projection polyline for controlled forward extension) prevents overflow errors while maintaining non-repainting integrity across all components.
🗒️ NOTES 🗒️
The indicator renders curves based on any anchor points provided without validation. Unusual anchor placement produces mathematically accurate but potentially non-useful results. Adjustment is iterative—if the curve doesn't match expectations, reposition the anchors.
Because anchor points are stored as specific time and price coordinates, a new instance of the indicator should be added when analyzing a different chart or timeframe.
Grip handles can be hidden by setting Grip Size to zero in the settings. This is useful for clean chart screenshots or presentations where interactive elements are not needed.
Projection length can be set to zero if forward-looking curves are not desired. The indicator will still render the backfit curves through the anchor points and continue plotting in real-time without the dotted projection extensions.
Anchor points remain fixed at their selected time-price coordinates as new bars form. The curves extend forward automatically from these historical anchors, allowing observation of how projected trajectories align with developing price action.
⚠️ DISCLAIMER ⚠️
The Flexible S/R Channels indicator is a visual analysis tool designed to illustrate geometric market inertia and serve as a framework for understanding dynamic support and resistance. While the indicator generates structural channels and projected paths, no guarantee is made regarding the accuracy or profitability of these projections. Like all technical indicators, the curves and boundaries generated by this tool may appear to align with favorable trading opportunities in hindsight. However, these visualizations are not intended as standalone recommendations for trading decisions. This indicator is intended for educational and analytical purposes, complementing other tools and methods of market analysis.
🧠 BEYOND THE CODE 🧠
Flexible S/R Channels is part of a broader collection of tools designed to provide structured market analysis. This includes the Grid Bot Simulator , the Grid Bot Auto , the Grid Bot Parabolic , and the Gridbot Ping Pong . While each tool serves a distinct purpose, they all utilize dynamic anchor mechanics and non-linear boundaries to adapt to evolving market conditions.
This indicator shares the same educational philosophy as the Fibonacci Time-Price Zones and the Fibonacci Geometry Series - providing frameworks for understanding market concepts through visualization and experimentation rather than black-box signals.
The Flexible S/R Channels indicator, like other xxattaxx indicators , is designed to encourage both education and community engagement. Feedback and insights are invaluable to refining and enhancing this tool. We look forward to the creative applications, observations, and discussions this indicator inspires within the trading community.

Power Hour Trendlines [LuxAlgo]The Power Hour Trendlines indicator is based on Power Hours detection, and includes up to three displayed trendlines derived from the closing prices of all the bars within the last user-selected Power Hours.
Users can edit the time of Power Hours, choose how many sessions to take into account, enable or disable any trendlines, and change their colors.
🔶 USAGE
The Power Hour is defined as the last hour of the trading session and is set by default from 3:00 p.m. to 4:00 p.m. New York time. During this period, volume and volatility enter the market. Traders using higher timeframes may use this period to enter or exit positions by placing MOC (Market on Close) orders.
This tool works under the hypothesis that prices made during power hours (periods with high trading activity) are more relevant when used for the construction of trendlines.
An initial trendline is fit using linear regression; prices from power hours located above this initial fit are used for the upper trendline, while the ones below the fit are used for the lower one.
As with any trendline, traders can analyze the slope to determine the market's direction:
Positive slope: The market is trending up.
Negative slope: The market is trending down.
No slope: The market is trending sideways.
As we can see in the image, Nasdaq and Bitcoin are clearly in downtrends, gold is clearly in an uptrend, and the euro/U.S. dollar is in a sideways market over the last visible sessions.
As you can see, the trend lines may or may not be parallel to each other. The wider the area, the more volatile the data. The narrower the area, the less volatile the data. Let's look at an example.
In the image, the Dow30 and the euro/U.S. dollar have opposite behaviors. The volatility above the middle trendline is growing in the first case but shrinking in the second. In both cases, the volatility in the bottom area seems steady, so there are no big surprises there.
Traders can adjust the number of sessions for calculations, making the tool ideal for analyzing price behavior over different time frames.
As the image shows, we can clearly see how the market behaves over different time periods. XLY has been moving down over the last 10, 20, and 40 sessions, with a steeper decline over shorter periods. However, it has been moving sideways over the last 70 sessions.
One of the main uses of trendlines is to provide key support and resistance. In the image, SPY is shown with trendlines over the last 20 sessions. These lines provide excellent reference points for trading and observing price behavior in those areas, such as whether prices are accepted or rejected, which may trigger a response from other traders.
🔹 Not Allowed Timeframes
For obvious reasons, timeframes larger than 1H are not allowed. The Power Hour is defined as the last hour of the trading session. The tool will display a warning message if the timeframe is longer than 60 minutes.
🔶 SETTINGS
Power Hour (NY Time): Choose a custom Power Hour in New York time
Sessions Memory: Select how many Power Hours to take into account for calculations.
🔹 Style
Top: Enable or disable the top line and choose the line and background colors.
Middle: Enable or disable the middle line and choose the line color.
Bottom: Enable or disable the bottom line and choose the line and background colors.
Background: Enable or disable the background color for top and bottom lines.

ATR Bands (MA Distance)ATR Bands (MA Distance) plots volatility-based bands at a multiple of ATR away from a selected moving average.
Unlike percentage envelopes or standard deviation bands, this indicator measures distance from the moving average using ATR, representing the market’s normal “breathing range” rather than statistical probability.
Key Features
The center line is a selectable moving average (EMA, SMA, RMA/Wilder, or WMA).
Upper and lower bands are calculated as:
Moving Average ± ATR × Multiplier
Band width automatically adapts to changing market volatility.
Designed for consistent use across different markets and timeframes without parameter re-optimization.
Non-repainting: all values are calculated only from confirmed historical bars.
Intended Use
ATR Bands (MA Distance) is best used as a context and preparation tool , not as a direct entry or exit signal.
Typical use cases include:
Identifying areas where price is extended relative to its recent volatility.
Visualizing normal vs. stretched price distance from the moving average.
Supporting range-based analysis or trade preparation when combined with other indicators (e.g., oscillators).
Important Notes / How NOT to Use
This indicator does NOT generate buy or sell signals by itself .
Touching or crossing a band does not imply an automatic reversal.
In strong trending markets, price may stay outside the bands for extended periods.
ATR Bands should not be interpreted as overbought/oversold levels on their own.
This indicator does NOT repaint. Once a bar is closed, its values will not change.
For best results:
Use ATR Bands as a preparation zone, then wait for confirmation from your own entry logic.
Disable or ignore band-based mean-reversion ideas during strong trend conditions.
Concept Summary (Short)
ATR Bands (MA Distance) visualize how far price has moved from its moving average in terms of volatility, without repainting and without relying on percentage deviation or statistical assumptions.
Optional Short Description (Preview)
Volatility-based, non-repainting ATR bands plotted at a distance from a moving average.
Designed for market context and trade preparation — not standalone signals.

Wedge Pattern [Kodexius]Wedge Pattern is a chart-overlay indicator designed to detect and manage classic Rising Wedge (bearish) and Falling Wedge (bullish) structures using strict, rules-based validation. The script focuses on producing clean, tradable wedge prints by building both boundaries from confirmed pivot swings, enforcing a mandatory “no closes outside the wedge” condition during formation, and requiring the wedge apex to be projected into the future to avoid premature or distorted patterns.
This implementation is built for practical execution charts. It continuously updates the active wedge boundaries in real time, clearly labels the pattern type, and reacts decisively when price confirms a valid breakout. When enabled, it also projects a measured-move target derived from the wedge geometry, so the trader can quickly evaluate reward potential without manual projection.
The detection logic is intentionally conservative. Rather than printing every possible converging structure, it aims to identify wedges that respect structural integrity: multiple touches on each boundary, controlled price action inside the converging range, and a valid convergence point (apex) ahead of the current bar. The result is a wedge tool that prioritizes quality, readability, and consistent behavior across symbols and timeframes.
🔹 Features
🔸 Rising and Falling Wedge Detection (Trendline Based)
The indicator detects two wedge types by constructing an upper trendline from pivot highs and a lower trendline from pivot lows:
Rising Wedge (Bearish): both lines slope upward, and the lower line rises faster than the upper line, creating a tightening upward channel that typically resolves with a downside break.
Falling Wedge (Bullish): both lines slope downward, and the upper line falls faster than the lower line, producing a tightening downward channel that typically resolves with an upside break.
This slope relationship is the core wedge classifier. It ensures the script is not just drawing random converging lines, but explicitly requires the characteristic “compression” geometry that defines wedges.
🔸 Pivot-Confirmed Structure with User Control
Wedges are built from confirmed pivots using:
Pivot Left and Pivot Right inputs to control how “strict” a pivot must be.
Min. Touches per Line to enforce multiple confirmations on each boundary.
Standard technical analysis commonly requires at least three touches to validate a trendline. This script supports that workflow by requiring a minimum number of pivot points before a wedge is eligible for drawing.
🔸 Mandatory Integrity Rule: No Closes Outside the Boundaries
A key quality filter is applied before a wedge can be accepted:
During formation, no candle close is allowed outside the upper or lower boundary.
If any close is detected above the upper line or below the lower line (with tick tolerance), the candidate wedge is rejected. This prevents patterns that already “broke” before they were formally detected and reduces false positives caused by messy price action.
🔸 Apex Validation to Avoid Distorted Prints
The wedge apex (the projected intersection point of the two trendlines) must be in the future. This avoids degenerate cases where lines intersect behind current price, which often indicates the structure is not a valid wedge or is already past its useful phase.
🔸 Live Updating Boundaries for Active Patterns
Once a wedge becomes active, its upper and lower lines are extended forward bar by bar. The script recalculates the boundary price at the current bar index using the stored slope, then updates the line endpoints so the wedge remains visually accurate as time advances.
🔸 Breakout Engine with Directional Confirmation
The script differentiates between:
Correct breakout: the wedge breaks in the expected direction.
Rising wedge breaks downward (close below the lower boundary).
Falling wedge breaks upward (close above the upper boundary).
When this happens, the wedge is marked as broken and labeled as BREAKOUT on the chart.
🔸 Invalidation and Failure Handling
If price violates the wedge in the wrong direction, or if the wedge collapses into an impossible structure (upper boundary falls below or equals the lower boundary), the wedge is flagged as FAILED. This keeps signals honest and prevents lingering drawings that no longer represent a valid pattern.
🔸 Optional Target Projection (Measured Move)
When Show Target Projection is enabled, the script plots a dashed target line and a target label after a valid breakout. The target is computed as a measured move using the wedge height, projected from the breakout boundary in the breakout direction. This provides an immediate objective reference for potential continuation.
🔸 Clean Object Management and Chart Readability
To maintain clarity, the script manages the “active” wedge per type:
If a new wedge is detected while an older one is still active and not broken or failed, the old drawings are removed and replaced with the newer valid pattern.
This prevents chart clutter and keeps the display focused on the most relevant wedge structures.
🔹 Calculations
1) Pivot Collection
The script uses pivot functions to confirm swing points:
float ph = ta.pivothigh(high, INPUT_PIVOT_LEFT, INPUT_PIVOT_RIGHT)
float pl = ta.pivotlow(low, INPUT_PIVOT_LEFT, INPUT_PIVOT_RIGHT)
if not na(ph)
pivot_highs.push(Coordinate.new(bar_index - INPUT_PIVOT_RIGHT, ph))
if not na(pl)
pivot_lows.push(Coordinate.new(bar_index - INPUT_PIVOT_RIGHT, pl))
Each pivot is stored as a Coordinate containing:
index: the bar index where the pivot is confirmed
price: the pivot high or pivot low value
The arrays are capped (for example, last 20 pivots) to control memory and keep selection relevant.
2) Trendline Construction and Slope
A wedge candidate uses the earliest and latest required pivot points for each line. For each boundary, slope is computed as:
method calc_slope(Trendline this) =>
(this.end.price - this.start.price) / (this.end.index - this.start.index)
With slope known, the trendline value at any bar index is:
method get_price_at(Trendline this, int bar_idx) =>
this.start.price + this.slope * (bar_idx - this.start.index)
This approach allows the script to update wedge boundaries consistently without re-fitting lines on every bar.
3) Wedge Type Classification (Geometry Rules)
After both slopes are calculated, wedge type is determined by slope direction and relative steepness:
Rising wedge requires both slopes positive and lower slope greater than upper slope.
Falling wedge requires both slopes negative and upper slope more negative than lower slope (upper line falls faster).
In code logic:
if tl_up.slope > 0 and tl_lo.slope > 0 and tl_lo.slope > tl_up.slope
w_type := 1 // Rising
if tl_up.slope < 0 and tl_lo.slope < 0 and tl_up.slope < tl_lo.slope
w_type := 2 // Falling
This enforces converging boundaries and avoids simple parallel channels.
4) Apex Projection (Trendline Intersection)
The apex is the projected intersection x-coordinate of the two trendlines:
method get_apex_index(Wedge this) =>
float m1 = this.upper.slope
float m2 = this.lower.slope
float y1 = this.upper.start.price
float y2 = this.lower.start.price
int x1 = this.upper.start.index
int x2 = this.lower.start.index
float apex_x = (y2 - y1 + m1 * x1 - m2 * x2) / (m1 - m2)
math.round(apex_x)
Validation requires:
apex_idx > bar_index (apex must be in the future)
This prevents late or structurally invalid wedges from being activated.
5) Mandatory “No Close Outside” Validation
Before activation, the script verifies the pattern has not been violated by candle closes:
method check_violation(Wedge this, int from_idx, int to_idx) =>
bool violated = false
for i = from_idx to to_idx
float up_p = this.upper.get_price_at(i)
float lo_p = this.lower.get_price_at(i)
float c_p = close
if c_p > up_p + syminfo.mintick or c_p < lo_p - syminfo.mintick
violated := true
break
violated
Interpretation:
For every bar from wedge start to current bar, the close must remain between the projected upper and lower boundary prices.
A tick tolerance (syminfo.mintick) is used to reduce micro false violations.
6) Live Update and Breakout Detection
Once active, lines are extended to the current bar and boundary prices are computed:
float u_p = w.upper.get_price_at(bar_index)
float l_p = w.lower.get_price_at(bar_index)
bool b_up = close > u_p
bool b_dn = close < l_p
Correct breakout conditions:
Rising wedge breakout: close below lower boundary.
Falling wedge breakout: close above upper boundary.
if (w.is_rising and b_dn) or (not w.is_rising and b_up)
w.is_broken := true
Invalidation rules include:
wrong-direction break
boundary crossover (upper <= lower)
7) Target Projection (Measured Move)
If target display is enabled, the script calculates wedge height and projects a target from the breakout side:
float m = math.abs(w.upper.start.price - w.lower.get_price_at(w.upper.start.index))
float t = w.is_rising ? l_p - m : u_p + m
Interpretation:
m represents the wedge height near the start of the formation.
t is the target price, projected in the breakout direction.
Rising wedge: target below the lower boundary.
Falling wedge: target above the upper boundary.
A dashed target line and label are then placed forward in time for readability.

HMA 34 Dual-Fractal Projections - VdubusVdubus MacD Divergence Trend Break Signal Generator :Here:-
HMA 18 Dual-Fractal Projections
Overview
The HMA 18 Dual-Fractal Projections is a technical analysis tool designed to identify market structure and potential breakout patterns by analyzing the pivots of a Hull Moving Average (HMA).
Unlike standard trendline indicators that struggle to balance "big picture" trends with immediate price action, this indicator utilizes a Dual-Fractal approach. It simultaneously calculates two separate timelines—Macro and Micro—to visualize both the dominant channel and the developing chart patterns (such as wedges or triangles) in real-time.
Visual Guide
The indicator plots three key elements on the main chart:
The HMA Line (Blue): A smooth, fast-acting moving average (default length 34) that serves as the baseline for all calculations.
Macro Structure (Solid, Thick Lines):
Red (Solid): Major Resistance.
Green (Solid): Major Support.
Purpose: Identifies the long-term trend channel. These lines react slowly and filter out noise.
Micro Structure (Dashed, Thin Lines):
Red (Dashed): Immediate Resistance.
Green (Dashed): Immediate Support.
Purpose: Identifies the short-term market structure. These lines react quickly to show forming wedges, triangles, or flags.
How It Works
The indicator applies a "Pivot High/Low" algorithm directly to the HMA data rather than raw price data. This filters out candle wicks and volatility, ensuring lines are drawn based on established momentum shifts.
Layer 1 (Macro): Uses a large "Lookback" period (default 44 bars) to find significant peaks and valleys. It connects the most recent major pivot to the previous one, projecting a line forward to show where the major trend channel lies.
Layer 2 (Micro): Uses a small "Lookback" period (default 10 bars) to find local peaks and valleys. This allows you to see how price is behaving within the larger channel.
Settings & Configuration
HMA Settings
HMA Length: The length of the Hull Moving Average.
Default: 34 (Matches the "visually pleasing" setting from recent testing).
Note: Set to 18 for a faster, more reactive baseline (scalping).
Layer 1: Macro (Big Channel)
Macro Lookback: Determines how many bars must pass before a peak is confirmed.
Default: 44. High values find broad, established channels.
Max Macro Lines: How many historical lines to keep on the chart.
Default: 1 (Keeps the chart clean, showing only the current structure).
Extend Macro Lines: Projects the lines infinitely to the right to predict future support/resistance zones.
Layer 2: Micro (Current Pattern)
Micro Lookback: A lower sensitivity setting to catch immediate structure.
Default: 10. Low values will pinpoint the exact boundaries of small wedges or flags forming right now.
Trading Strategy & Interpretation
1. The "Squeeze" (Wedge Identification) This is the primary use case.
Look for scenarios where the Macro Lines (Solid) are wide/parallel, but the Micro Lines (Dashed) are rapidly converging (pointing towards each other).
This indicates that while the main trend is intact, momentum is compressing. A breakout is imminent where the dashed lines intersect.
2. Trend Channels
When both Solid and Dashed lines are roughly parallel and sloping in the same direction, the trend is healthy and strong. Price is respecting both the short-term and long-term momentum.
3. Divergence / Early Reversal Warning
If the Macro Line is sloping UP, but the Micro Line starts sloping DOWN (crossing inside), it indicates a loss of momentum and a potential reversal before the price actually breaks the major trendline.
===========================================================================
2. Micro/Macro Cross Alert
A new input, Enable Micro/Macro Cross Alert, has been added under the "Alerts & Features" section.
This alert condition is triggered when the momentum of the Micro Structure exceeds the momentum of the Macro Structure, which is a high-probability signal for a breakout:
Bullish Alert: The Micro High (dashed red line) crosses above the Macro High (solid red line).
Bearish Alert: The Micro Low (dashed green line) crosses below the Macro Low (solid green line).
To set up the actual alert on your chart:
Right-click on the chart.
Select "Add alert on HMA 34 Dual-Fractal Projections".
In the Condition dropdown, select the indicator's name.
For the main alert criteria, choose "Any alert()".
Select your preferred alert actions (e.g., notification, email).

Ben D"s IndicatorIt Auto Draws and Detects, Channels draws buy and sell signals based on over bought, oversold and a few other indicators. It works on all time frames! Enjoy! Leave a comment if you like it.

Simple Price ChannelSimple Price Channel
This indicator plots a basic volatility-based channel around a moving average.
Features:
Midline using Simple Moving Average (SMA)
Upper & lower bands using ATR or true range
Channel fill for easy trend visualisation
This script is designed for educational and analytical purposes only.
It does not provide signals, alerts, or financial advice.

Kernel Channel [BackQuant]Kernel Channel
A non-parametric, kernel-weighted trend channel that adapts to local structure, smooths noise without lagging like moving averages, and highlights volatility compressions, expansions, and directional bias through a flexible choice of kernels, band types, and squeeze logic.
What this is
This indicator builds a full trend channel using kernel regression rather than classical averaging. Instead of a simple moving average or exponential weighting, the midline is computed as a kernel-weighted expectation of past values. This allows it to adapt to local shape, give more weight to nearby bars, and reduce distortion from outliers.
You can think of it as a sliding local smoother where you define both the “window” of influence (Window Length) and the “locality strength” (Bandwidth). The result is a flexible midline with optional upper and lower bands derived from kernel-weighted ATR or kernel-weighted standard deviation, letting you visualize volatility in a structurally consistent way.
Three plotting modes help demonstrate this difference:
When the midline is shown alone, you get a smooth, adaptive baseline that behaves almost like a regression moving average, as shown in this view:
When full channels are enabled, you see how standard deviation reacts to local structure with dynamically widening and tightening bands, a mode illustrated here:
When ATR mode is chosen instead of StdDev, band width reflects breadth of movement rather than variance, creating a volatility-aware envelope like the example here:
Why kernels
Classical moving averages allocate fixed weights. Kernels let the user define weighting shape:
Epanechnikov — emphasizes bars near the current bar, fades fast, stable and smooth.
Triangular — linear decay, simple and responsive.
Laplacian — exponential decay from the current point, sharper reactivity.
Cosine — gentle periodic decay, balanced smoothness for trend filters.
Using these in combination with a bandwidth parameter gives fine control over smoothness vs responsiveness. Smaller bandwidths give sharper local sensitivity, larger bandwidths give smoother curvature.
How it works (core logic)
The indicator computes three building blocks:
1) Kernel-weighted midline
For every bar, a sliding window looks back Window Length bars. Each bar in this window receives a kernel weight depending on:
its index distance from the present
the chosen kernel shape
the bandwidth parameter (locality)
Weights form the denominator, weighted values form the numerator, and the resulting ratio is the kernel regression mean. This midline is the central trend.
2) Kernel-based width
You choose one of two band types:
Kernel ATR — ATR values are kernel-averaged, producing a smooth, volatility-based width that is not dependent on variance. Ideal for directional trend channels and regime separation.
Kernel StdDev — local variance around the midline is computed through kernel weighting. This produces a true statistical envelope that narrows in quiet periods and widens in noisy areas.
Width is scaled using Band Multiplier , controlling how far the envelope extends.
3) Upper and lower channels
Provided midline and width exist, the channel edges are:
Upper = midline + bandMult × width
Lower = midline − bandMult × width
These create smooth structures around price that adapt continuously.
Plotting modes
The indicator supports multiple visual styles depending on what you want to emphasize.
When only the midline is displayed, you get a pure kernel trend: a smooth regression-like curve that reacts to local structure while filtering noise, demonstrated here: This provides a clean read on direction and slope.
With full channels enabled, the behavior of the bands becomes visible. Standard deviation mode creates elastic boundaries that tighten during compressions and widen during turbulence, which you can see in the band-focused demonstration: This helps identify expansion events, volatility clusters, and breakouts.
ATR mode shifts interpretation from statistical variance to raw movement amplitude. This makes channels less sensitive to outliers and more consistent across trend phases, as shown in this ATR variation example: This mode is particularly useful for breakout systems and bar-range regimes.
Regime detection and bar coloring
The slope of the midline defines directional bias:
Up-slope → green
Down-slope → red
Flat → gray
A secondary regime filter compares close to the channel:
Trend Up Strong — close above upper band and midline rising.
Trend Down Strong — close below lower band and midline falling.
Trend Up Weak — close between midline and upper band with rising slope.
Trend Down Weak — close between lower band and midline with falling slope.
Compression mode — squeeze conditions.
Bar coloring is optional and can be toggled for cleaner charts.
Squeeze logic
The indicator includes non-standard squeeze detection based on relative width , defined as:
width / |midline|
This gives a dimensionless measure of how “tight” or “loose” the channel is, normalized for trend level.
A rolling window evaluates the percentile rank of current width relative to past behavior. If the width is in the lowest X% of its last N observations, the script flags a squeeze environment. This highlights compression regions that may precede breakouts or regime shifts.
Deviation highlighting
When using Kernel StdDev mode, you may enable deviation flags that highlight bars where price moves outside the channel:
Above upper band → bullish momentum overextension
Below lower band → bearish momentum overextension
This is turned off in ATR mode because ATR widths do not represent distributional variance.
Alerts included
Kernel Channel Long — midline turns up.
Kernel Channel Short — midline turns down.
Price Crossed Midline — crossover or crossunder of the midline.
Price Above Upper — early momentum expansion.
Price Below Lower — downward volatility expansion.
These help automate regime changes and breakout detection.
How to use it
Trend identification
The midline acts as a bias filter. Rising midline means trend strength upward, falling midline means downward behavior. The channel width contextualizes confidence.
Breakout anticipation
Kernel StdDev compressions highlight areas where price is coiling. Breakouts often follow narrow relative width. ATR mode provides structural expansion cues that are smooth and robust.
Mean reversion
StdDev mode is suitable for fade setups. Moves to outer bands during low volatility often revert to the midline.
Continuation logic
If price breaks above the upper band while midline is rising, the indicator flags strong directional expansion. Same logic for breakdowns on the lower band.
Volatility characterization
Kernel ATR maps raw bar movements and is excellent for identifying regime shifts in markets where variance is unstable.
Tuning guidance
For smoother long-term trend tracking
Larger window (150–300).
Moderate bandwidth (1.0–2.0).
Epanechnikov or Cosine kernel.
ATR mode for stable envelopes.
For swing trading / short-term structure
Window length around 50–100.
Bandwidth 0.6–1.2.
Triangular for speed, Laplacian for sharper reactions.
StdDev bands for precise volatility compression.
For breakout systems
Smaller bandwidth for sharp local detection.
ATR mode for stable envelopes.
Enable squeeze highlighting for identifying setups early.
For mean-reversion systems
Use StdDev bands.
Moderate window length.
Highlight deviations to locate overextended bars.
Settings overview
Kernel Settings
Source
Window Length
Bandwidth
Kernel Type (Epanechnikov, Triangular, Laplacian, Cosine)
Channel Width
Band Type (Kernel ATR or Kernel StdDev)
Band Multiplier
Visuals
Show Bands
Color Bars By Regime
Highlight Squeeze Periods
Highlight Deviation
Lookback and Percentile settings
Colors for uptrend, downtrend, squeeze, flat
Trading applications
Trend filtering — trade only in direction of the midline slope.
Breakout confirmation — expansion outside the bands while slope agrees.
Squeeze timing — compression periods often precede the next directional leg.
Volatility-aware stops — ATR mode makes channel edges suitable for adaptive stop placement.
Structural swing mapping — StdDev bands help locate midline pullbacks vs distributional extremes.
Bias rotation — bar coloring highlights when regime shifts occur.
Notes
The Kernel Channel is not a signal generator by itself, but a structural map. It helps classify trend direction, volatility environment, distribution shape, and compression cycles. Combine it with your entry and exit framework, risk parameters, and higher-timeframe confirmation.
It is designed to behave consistently across markets, to avoid the bluntness of classical averages, and to reveal subtle curvature in price that traditional channels miss. Adjust kernel type, bandwidth, and band source to match the noise profile of your instrument, then use squeeze logic and deviation highlighting to guide timing.

MIG and MC 发布简介(中文)
MIG and MC 指标帮助日内交易者快速识别微型缺口(Micro Gap)与微型通道(Micro Channel)。脚本支持过滤开盘跳空、合并连续缺口,并自动绘制
FPL(Fair Price Line)延伸线,既可追踪缺口是否被填补,也能直观标注潜在的趋势结构。为了确保跨周期一致性,最新版本对开盘前后和跨日场景做了专门处理
主要特性
- 自动检测并显示看涨/看跌微型缺口,支持按需合并连续缺口。
- 自定义是否忽略开盘缺口、缺口显示范围与 FPL 样式。
- FPL 触及后即停止延伸,辅助研判缺口是否真正回补。
- 内置强收盘与缺口过滤的微型通道识别,可选多种严格程度。
- 适用于 1/5/9 分钟等日内周期,也适用于更长周期。
Recommended English Description
The MIG and MC indicator highlights Micro Gaps and Micro Channels so you can track true intraday imbalances without noise. It merges
consecutive gaps, projects Fair Price Lines (FPL) that stop once touched, and offers a full intraday-ready opening-gap filter so your
early bars stay clean. The latest update refines cross-session handling, giving reliable gap plots on 1-, 5-, and 9-minute charts as well as higher time frames.
Key Features
- Detects bullish and bearish micro gaps with optional gap merging.
- Toggle opening-gap filters and configure look back, visibility, and FPL style.
- FPL lines stop as soon as price revisits the gap, making gap closure obvious.
- Micro Channel mode uses strong-close and gap filters to mark high-quality trend legs.
- Consistent behavior across intraday and higher time frames.

Auto Channel [SciQua]Auto Channel
Purpose
Auto Channel finds the single best parallel price channel from recent price action and keeps it updated in real time. It uses ZigZag pivots to build candidate channels, scores each candidate for quality, then plots the winner. When price closes outside the channel, the script flags a breakout and can fire alerts.
How it works
1. ZigZag pivots
The script uses TradingView’s TradingView/ZigZag/7 library to generate a stream of swing highs and lows based on a percentage reversal threshold and a leg depth. These pivots are the only points the channel logic evaluates, which keeps the search fast and focused on structure rather than noise.
2. Channel candidates
From the most recent pivots, the script forms all combinations of two swing highs and two swing lows.
It computes a slope for the high line and a slope for the low line and requires that they be nearly parallel within a user-defined tolerance.
3. Quality scoring and selection
For every valid candidate, the script checks the recent pivot segments against the trial channel and computes:
Inside ratio: fraction of tested pivots that sit fully inside the channel after applying the tolerance buffer.
Violation sum: total magnitude of the breaches for any pivots outside the channel.
Current width: distance between upper and lower lines at the current bar.
The “best” channel is chosen by:
1. highest inside ratio
2. then widest current width
3. then smallest violation sum
4. Plot and projection
The upper and lower lines are anchored to the chosen pivot pairs and extend to the left. The script also projects each line to the current bar to compute the live upper and lower channel prices. Those levels drive the breakout checks and alerts.
5. Breakouts and alerts
A breakout is detected when the bar closes above the projected upper line or closes below the projected lower line, after applying the tolerance buffer. Triangle markers highlight fresh breakouts, and you can enable alert conditions to automate notification or strategy handoff.
Inputs:
ZigZag
Price deviation for reversals (%)
Default 0.2. Larger values produce fewer, larger swings. Smaller values produce more, smaller swings.
Pivot legs
Default 2. Controls the lookback depth ZigZag uses to confirm pivots.
ZigZag Color
Visual only.
Tip: If you are not seeing a stable channel, increase the ZigZag percentage to reduce minor swings.
Channel search
Number of recent pivots to consider
Default 12. Higher values search more history and try more channel combinations. Lower values make the search faster and more reactive.
Max slope difference for parallel
Default 0.0005. Maximum allowed difference between the upper and lower line slopes. Smaller values enforce stricter parallelism.
Max price tolerance outside channel
Default 0.0. A buffer added to the channel boundaries during validation and breakout checks. Use this to ignore tiny wicks that poke the lines.
Minimum inside to outside pivots ratio for valid channel (0.00–1.00)
Default 1.00. Require that at least this fraction of checked pivots lie inside the channel. For a more permissive fit, try 0.60 to 0.85.
Styling
Upper Line Color
Lower Line Color
Breakout Above Color
Breakout Below Color
Plots and visuals
Upper channel line
Lower channel line
Triangle markers on the bar that first confirms a close outside the channel, above or below.
Lines extend left from their pivot anchors. Projection to the current bar is used internally to test for breakouts and to set alerts.
Alerts
The script defines two alert conditions:
Close Above Channel
Triggers when the bar closes above the projected upper line plus tolerance.
Close Below Channel
Triggers when the bar closes below the projected lower line minus tolerance.
Practical usage
Trend channels
In a steady trend, a high inside ratio with a moderate width often highlights the dominant channel. Consider trend entries near the lower line in an uptrend or near the upper line in a downtrend, with exits or stops beyond the opposite boundary.
Breakout trades
Combine the channel breakout alert with volume or a separate momentum filter. The tolerance input helps avoid false triggers from small wicks.
Tuning for timeframe and symbol
• Faster markets or lower timeframes usually benefit from a larger ZigZag percentage and a smaller pivot count.
• Slower markets or higher timeframes can use more pivots and a tighter slope difference to enforce cleaner geometry.
Notes and limitations
Channels are derived from ZigZag pivots. If your ZigZag settings change, the detected channel will also change.
The script plots only the single best channel at any time to keep the chart clean.
Breakout markers appear on confirmed bars. For historical bars, markers appear only where a breakout would have been confirmed at that time.
Lines extend left from their anchors. The script projects the lines internally to the current bar for checks and alerts.
License and attribution
License
Creative Commons Attribution-NonCommercial 4.0 International (CC BY-NC 4.0).
Open source for educational and personal use only. Commercial use requires written permission.
Attribution
© 2025 SciQua — Joshua Danford
Libraries
Uses TradingView/ZigZag/7.
Changelog
v1.0
Initial release. Automatic parallel channel detection from ZigZag pivots, quality scoring, live plotting, and close-based breakout alerts.
FAQ
Why do I not see any channel sometimes?
There may not be a valid pair of highs and lows that pass the slope, inside ratio, and tolerance checks. Loosen the constraints by increasing Max slope difference, lowering Minimum inside ratio, or increasing the ZigZag percentage.
The channel looks too narrow or too wide?
Adjust Number of recent pivots and Minimum inside ratio. A higher inside ratio tends to favor cleaner, sometimes wider channels. A lower ratio may admit narrower, more reactive channels.
How can I reduce false breakout alerts?
Increase Max price tolerance outside channel to ignore small wicks. Add a volume or momentum confirmation in your personal alert workflow.
Thank you for using Auto Channel . Feedback and improvements are welcome.

Step Channel Momentum Trend [ChartPrime]OVERVIEW
Step Channel Momentum Trend is a momentum-based price filtering system that adapts to market structure using pivot levels and ATR volatility. It builds a dynamic channel around a stepwise midline derived from swing highs and lows. The system colors price candles based on whether price remains inside this channel (low momentum) or breaks out (strong directional flow). This allows traders to clearly distinguish ranging conditions from trending ones and take action accordingly.
⯁ STRUCTURAL MIDLNE (STEP CHANNEL CORE)
The midline acts as the backbone of the trend system and is based on structure rather than smoothing.
Calculated as the average of the most recent confirmed Pivot High and Pivot Low.
The result is a step-like horizontal line that only updates when new pivot points are confirmed.
This design avoids lag and makes the line "snap" to recent structural shifts.
It reflects the equilibrium level between recent bullish and bearish control.
This unique step logic creates clear regime shifts and prevents noise from distorting trend interpretation.
⯁ DYNAMIC VOLATILITY BANDS (ATR FILTERING)
To detect momentum strength, the script constructs upper and lower bands using the ATR (Average True Range):
The distance from the midline is determined by ATR × multiplier (default: 200-period ATR × 0.6).
These bands adjust dynamically to volatility, expanding in high-ATR environments and contracting in calm markets.
The area between upper and lower bands represents a neutral or ranging market state.
Breakouts outside the bands are treated as significant momentum shifts.
This filtering approach ensures that only meaningful breakouts are visually emphasized — not every candle fluctuation.
⯁ MOMENTUM-BASED CANDLE COLORING
The system visually transforms price candles into momentum indicators:
When price (hl2) is above the upper band, candles are green → bullish momentum.
When price is below the lower band, candles are red → bearish momentum.
When price is between the bands, candles are orange → low or no momentum (range).
The candle body, wick, and border are all colored uniformly for visual clarity.
This gives traders instant feedback on when momentum is expanding or fading — ideal for breakout, pullback, or trend-following strategies.
⯁ PIVOT-BASED SWING ANCHORS
Each confirmed pivot is plotted as a label ⬥ directly on the chart:
They also serve as potential manual entry zones, SL/TP anchors, or confirmation points.
⯁ MOMENTUM STATE LABEL
To reinforce the current market mode, a live label is displayed at the most recent candle:
Displays either:
“ Momentum Up ” when price breaks above the upper band.
“ Momentum Down ” when price breaks below the lower band.
“ Range ” when price remains between the bands.
Label color matches the candle color for quick identification.
Automatically updates on each bar close.
This helps discretionary traders filter trades based on market phase.
USAGE
Use the green/red zones to enter with momentum and ride trending moves.
Use the orange zone to stay out or fade ranges.
The step midline can act as a breakout base, pullback anchor, or bias reference.
Combine with other indicators (e.g., order blocks, divergences, or volume) to build high-confluence systems.
CONCLUSION
Step Channel Momentum Trend gives traders a clean, adaptive framework for identifying trend direction, volatility-based breakouts, and ranging environments — all from structural logic and ATR responsiveness. Its stepwise midline provides clarity, while its dynamic color-coded candles make momentum shifts impossible to miss. Whether you’re scalping intraday momentum or managing swing entries, this tool helps you trade with the market’s rhythm — not against it.

Rolling VWAP Channel [LuxAlgo]The Rolling VWAP Channel indicator creates a channel by analyzing a large number of Volume Weighted Average Prices (VWAPs) and determining a Channel based on percentile linear interpolation throughout the VWAPs.
🔶 USAGE
In this indicator, we have formed a Channel by first calculating multiple VWAPs, each with their respective anchor, then locating prices using "Percentile Linear Interpolation".
Note: Percentile Linear Interpolation locates the price point at which a specified percentage of VWAPs fall below it.
For example, a percentile of 50% would mean that 50% of the VWAP values fall below this price.
This method of analysis is important since the VWAPs are not often evenly distributed; therefore, we are able to draw importance to different levels by analyzing in percentiles.
When visualized, there is typically clustering of the VWAP values, which occurs at any given time, as seen below.
The channel can be tailored to each individual, with full control of each percentile represented in the channel. That being said, a general concept is that these clustered areas are clear results of sideways price action, which would lead us to believe that after interactions at these levels, we should expect to see a directional decision made by the market closely after.
🔶 DETAILS
The Rolling VWAP calculation calculates a user-specified number of VWAPs (up to 500), each anchored to a unique starting point in the chart based on the start of a new timeframe.
Each new timeframe that occurs causes a new VWAP to initialize. When the total number of desired VWAPs is reached, the oldest VWAP is removed and re-initialized, anchored to the current bar. Hence, the name " Rolling " VWAPs
This method allows us to automatically generate and manage large amounts of VWAPs without the need for user interaction.
After we have generated these VWAPs, we are able to run analyses on their returned values, such as the "Percentile Linear Interpolation" mentioned in the section above.
🔶 SETTINGS
Anchor Period: Choose which time period to use as the anchor point to initialize new VWAPs from.
VWAP Source: Choose the source for your VWAPs to calculate.
VWAP Amount: Sets the number of VWAPs to use. After this amount is on the chart, the oldest will be rolled.
🔹 Channel Lines
Toggle: Enable the associated VWAP Channel percentile line.
Percentile: Adjust each line's percentile independently for your needs.
Width: Adjust the width of the associated percentile line.
🔹 Calculation
Calculated Bars: Tells the indicator how many bars to calculate on, for faster calculations with less history, use a lower value. Setting this to 0 will remove the bar constraint.
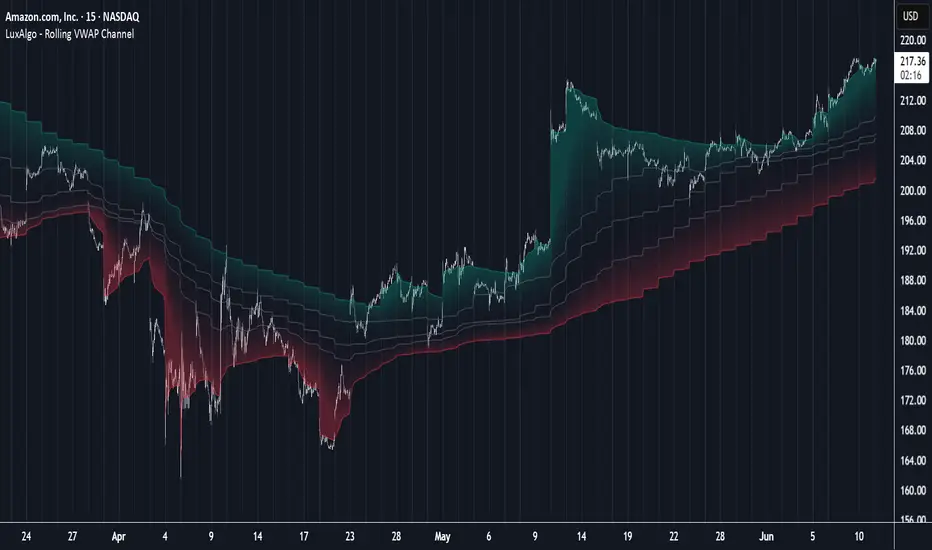
Support and Resistance Power Channel [ChartPrime]The Support and Resistance Power Channel indicator helps traders visualize key support and resistance zones, along with buy and sell power within those zones. By identifying the highest and lowest prices within a defined range, this indicator provides insight into potential price reversals and market strength. It calculates the strength of buy and sell pressure within the zones and includes additional features like midline values and delayed signals to reduce false breakouts.
⯁ KEY FEATURES AND HOW TO USE
⯌ Support and Resistance Zones :
This indicator identifies dynamic support (lower zone) and resistance (upper zone) levels, allowing traders to easily visualize key price levels. These zones are customizable with settings for the length of the channel and how far the zones extend into the future. The zones can be used to predict areas of potential price reversal or consolidation.
⯌ Buy and Sell Power :
Within the upper resistance zone, the indicator calculates Sell Power based on the number of bearish candles, while the lower support zone calculates Buy Power based on bullish candles. This feature helps traders understand the strength of buying or selling activity within each zone.
Example of buy and sell power tracking:
⯌ Highest, Lowest, and Mid Price Levels :
The indicator marks the highest and lowest price levels within the channel with an "X," and displays these values at the end of the channel. Additionally, the midline (average of the high and low) is plotted with a dotted line, showing a key area that the price often retests during trends.
⯌ Delayed Signal Markers :
To prevent false breakouts, the indicator includes a 2-bar delay for signals. These signals are plotted when the price crosses above or below the resistance or support zones, confirming potential reversals or breakouts. Arrows or diamonds are used to mark these signals on the chart.
Example of delayed breakout signals on the chart:
⯌ Extend Zones into the Future :
In the settings, traders can extend the support and resistance zones further into the future, allowing for ongoing analysis even after the initial levels have been identified. This feature can help with forward-looking trade planning.
⯁ USER INPUTS
Length : Defines the number of bars used to calculate the support and resistance zones.
Extend : Sets how far the support and resistance zones should be extended into the future.
Top and Bottom Colors : Allows customization of the colors for the support and resistance zones.
⯁ CONCLUSION
The Support and Resistance Power Channel indicator provides a powerful and visually intuitive way to track key market levels, buy and sell pressure, and potential reversals. With its real-time zone plotting and the calculation of power within each zone, it offers traders essential insights for making more informed trading decisions.

Chart Patterns [ActiveQuants]The Chart Patterns indicator is a comprehensive tool designed to automatically identify a variety of common chart patterns directly on your price chart. By detecting sequences of pivot highs and lows , this indicator helps traders spot potential trend continuations , reversals , and key market structures such as Double Tops and Double Bottoms . Enhance your technical analysis by quickly recognizing these formations as they emerge.
How It Works
The indicator operates in a two-stage process:
Pivot Point Detection: It first identifies significant swing highs and swing lows (pivot points) based on a user-defined Period . These pivots form the fundamental building blocks for pattern recognition.
Pattern Recognition: Using the sequence of these detected pivot points, the script then applies logical rules to identify the following patterns:
Lower Low (LL)
Lower Low & Lower High (LL & LH)
Higher High (HH)
Higher High & Higher Low (HH & HL)
Double Tops
Double Bottoms
Patterns are drawn on the chart with connecting lines and labeled for easy identification. Double Tops and Double Bottoms also feature a status system: " Active " while forming, " Confirmed " upon neckline breakout, or " Invalid " if specific conditions negate the pattern before confirmation.
█ KEY FEATURES
Comprehensive Pattern Detection: Identifies six distinct types of chart patterns, offering insights into both trend continuation and potential reversals.
Pivot-Based Analysis: Uses a robust method of identifying pivot highs and lows as the foundation for pattern formation.
Pattern Status for Double Tops/Bottoms:
- Active: A Double Top or Double Bottom pattern has formed its two peaks/troughs and the intervening neckline point, but the price has not yet broken beyond the neckline. The pattern is developing .
- Confirmed: The price has decisively closed beyond the neckline (below for Double Top, above for Double Bottom), signaling a potential entry or validation of the pattern.
- Invalid: An " Active " Double Top or Double Bottom pattern can be invalidated if, before a neckline breakout occurs, a new pivot point forms that negates the pattern’s structural integrity. For example, if a new pivot low forms above or at the neckline of an Active Double Top, the pattern is considered invalid because the market failed to break down and instead showed relative strength.
Customizable Visuals: Allows users to define colors for bullish and bearish patterns, line widths, and the visibility of pivot points.
Selective Pattern Display: Users can choose to display all patterns or filter by status (Active, Confirmed, Invalid) for Double Tops/Bottoms. Individual pattern types can also be toggled on or off.
Historical Analysis Control: The Show Last History (Bars) input allows users to specify how far back the indicator should plot patterns, optimizing performance and chart readability.
Clear Labeling: Patterns are clearly labeled on the chart, with Double Tops/Bottoms also showing " Top 1 ," " Top 2 ," or " Bottom 1 ," " Bottom 2 " labels.
█ PATTERNS DETECTED
Lower Low (LL): Indicates a potential bearish continuation or the start of a downtrend. Forms when price makes a lower low during an uptrend.
Lower Low & Lower High (LL & LH): A stronger confirmation of a bearish trend, where the market forms a lower low followed by a lower high .
Higher High (HH): Signals a potential bullish continuation or the start of an uptrend. Forms when price makes a higher high during a downtrend.
Higher High & Higher Low (HH & HL): A stronger confirmation of a bullish trend, where the market forms a higher high followed by a higher low .
Double Top: A bearish reversal pattern characterized by two distinct peaks at roughly the same price level, separated by a trough (neckline). Confirmation occurs when price breaks below the neckline.
Double Bottom: A bullish reversal pattern featuring two distinct troughs at roughly the same price level, separated by a peak (neckline). Confirmation occurs when price breaks above the neckline.
█ EXAMPLE: DOUBLE TOP INVALIDATION
Understanding how a Double Top or Double Bottom can be invalidated is crucial. Here's an example for a Double Top:
Formation: The indicator identifies two peaks (Top 1, Top 2) at a similar price level, with a corrective trough (Neckline Pivot P5) in between. The pattern is labeled " Double Top " and is in an " Active " state. ( Imagine points P4 and P6 are the two tops, and P5 is the low point of the neckline between them ).
Pre-Breakout Condition: The price action continues, but before it breaks decisively below the P5 neckline level, a new significant swing low (a new pivot low) forms.
Invalidation Check: The indicator checks the price level of this new pivot low. If this new pivot low occurs at a price equal to or higher than the P5 neckline level, the " Active " Double Top pattern is re-labeled as " Invalid Double Top ". ( See image below for a visual representation of this scenario )
In this example, the Double Top formed with Top 1 (P4) and Top 2 (P6). The neckline is at P5. Before price broke below P5, a new pivot low formed at the red circle. Since this new pivot low is above the P5 neckline, the Double Top is marked " Invalid ".
The logic is that the market failed to break the neckline support and instead established a higher low (or a low at the support level), suggesting that the immediate bearish pressure has waned, thus invalidating the bearish reversal implication of the Double Top before it could confirm. A similar logic applies to Double Bottoms (a new pivot high forming below or at the neckline before an upside breakout).
█ USER INPUTS
Visibility and Common Styling
- Show Last History (Bars):
Specifies the number of recent bars the indicator will analyze and plot patterns on.
Default: 3000 bars. Min: 10.
- Patterns:
Filters which patterns are displayed based on their status.
Options: All, Active, Confirmed, Invalid.
Default: All.
- Pattern Line Width:
Sets the thickness of the lines used to draw the patterns.
Default: 1. Min: 1, Max: 10.
- Bearish Color:
Color for bearish patterns (LL, LL & LH, Double Tops).
Default: Red.
- Bullish Color:
Color for bullish patterns (HH, HH & HL, Double Bottoms).
Default: Green.
Pivot Points
- Period:
The lookback period on either side of a bar to qualify it as a pivot high or low. Higher values detect more significant pivots.
Default: 10 bars. Min: 2.
- Show Pivot Highs:
Toggles the visibility of detected pivot high markers.
Default: Enabled.
- Show Pivot Lows:
Toggles the visibility of detected pivot low markers.
Default: Enabled.
- Pivot Highs Color:
Color for the pivot high markers.
Default: #ff5252 (Reddish).
- Pivot Lows Color:
Color for the pivot low markers.
Default: #089981 (Greenish).
Patterns (Toggles)
- Lower Low:
Enable/disable detection and display of Lower Low patterns.
Default: Enabled.
- Lower Low & Lower High:
Enable/disable detection and display of Lower Low & Lower High patterns.
Default: Enabled.
- Higher High:
Enable/disable detection and display of Higher High patterns.
Default: Enabled.
- Higher High & Higher Low:
Enable/disable detection and display of Higher High & Higher Low patterns.
Default: Enabled.
- Double Tops:
Enable/disable detection and display of Double Top patterns.
Default: Enabled.
- Double Bottoms:
Enable/disable detection and display of Double Bottom patterns.
Default: Enabled.
█ CONCLUSION
The Chart Patterns indicator is a versatile and powerful assistant for traders who utilize classical chart pattern analysis. By automating the detection of key formations and providing clear visual cues along with status updates for patterns like Double Tops and Bottoms, it allows traders to focus on strategy development and execution. With its customizable settings, it can be adapted to various instruments and timeframes, making it a valuable addition to any technical trader's toolkit.
█ IMPORTANT NOTES
⚠ Pivot Period Sensitivity: The Period setting for pivot detection is crucial. A shorter period will identify more frequent, smaller swings, while a longer period will focus on more significant turning points. Adjust this setting based on the asset's volatility, the timeframe you are trading and your trading style.
⚠ Confirmation is Key: While the indicator identifies patterns, always wait for pattern confirmation (e.g., neckline breaks for Double Tops/Bottoms) and consider other factors like volume and market context before making trading decisions.
⚠ Confirmed Bars for Detection: Patterns are identified based on confirmed pivot points, which means a pivot is recognized period bars after it has formed. Status updates for Double Tops/Bottoms (Active, Confirmed, Invalid) also occur on confirmed bars. This approach enhances reliability and reduces the likelihood of repainting based on intra-bar price fluctuations.
⚠ Not a Standalone System: Chart patterns provide valuable insights, but they should be used in conjunction with other technical analysis tools (e.g., trendlines, moving averages, oscillators) and a sound risk management plan.
⚠ Lagging Nature: By their very definition, chart patterns are lagging indicators as they require a sequence of price action and several pivot points to complete their formation.
█ RISK DISCLAIMER
Trading involves a substantial risk of loss and is not suitable for every investor. The information provided by the Chart Patterns indicator is for educational and informational purposes only. It should not be considered as financial advice or a recommendation to buy or sell any security. Chart patterns indicate potential price movements but do not guarantee future results. Always perform your own due diligence and consult with a qualified financial advisor before making any investment decisions. Past performance is not indicative of future results.
📈 Happy trading! 🚀

NR4 & NR7 with Breakouts [LuxAlgo]NR4 & NR7 with Breakouts is a simple indicator that utilizes the NR4 and NR7 candle patterns to display candle ranges and signals from range breakouts.
🔶 USAGE
The Narrow Range Patterns are candle formations determined by the last candle having a narrower (high-low) range than the previous number. This indicator showcases the 2 most recognized Narrow Range Patterns, which are the 4 and 7 bar variants (NR4 and NR7).
These patterns, introduced by Toby Crabel, are thought to provide insight for potential market breakouts by identifying periods of low volatility indicated by a candle with a small range. This is due to the idea that markets often move from periods of low volatility (contraction) to high volatility (expansion), and the NR4 and NR7 patterns help spot these transitions.
By utilizing these patterns, traders are better able to anticipate and respond to market shifts for better decision-making and risk management.
NOTE: These patterns have traditionally been studied on the Daily Timeframe Chart. This indicator allows the user to select a timeframe to generate these patterns from. It is suggested to be mindful of this when considering these patterns.
In this indicator, on the bar after the pattern is detected, the Narrow Range Bar will be highlighted with a zone, and lines displaying the range will extend from it. These ranges are helpful for providing levels to set limit orders and for managing risk.
Users are able to adjust which pattern they want visualized on their chart, please note;
All NR7s are NR4s but not all NR4s are NR7s.
Because of this, you will notice that when selecting "NR4" to display, the colors will change, but the detected ranges will not change.
🔹 Signals
When a Narrow Range Bar is detected, the script will wait for the price to close outside of the Range, then a signal will fire indicating the direction of exit. The signals are produced from the last NR4 or NR7 and will have the potential to fire from that range until a new NR4 or NR7 is detected.
After a signal fires, the logic goes into a "reset" period where it will wait for the price to reach the Range Mean before firing another signal.
These signals can be anticipated by considering the underlying logic and watching price approach the range extremities, and can be improved by utilizing other market information for confluence.
🔶 SETTINGS
Timeframe: Choose which timeframe to identify the NR4 and NR7 Pattern on. This must be Higher than the chart timeframe.
Pattern Type: Choose which (or all) patterns to display.

RSI Divergence[UgurTash] – Real-Time📈 RSI Divergence – Real-Time, Adaptive, and Intelligent RSI Divergence Detection
🚀 What Does This Indicator Do?
RSI Divergence is a real-time divergence detection tool that helps traders identify bullish and bearish divergences between price and the Relative Strength Index (RSI). Unlike traditional RSI-based indicators, this script offers:
✅ Real-time detection – No need to wait for bar closes or repainting.
✅ Dynamic time-frame adaptation – The script automatically adjusts RSI settings based on the selected chart time frame.
✅ Multi-layered divergence analysis – Supports short-term, medium-term, and long-term divergence detection with an optional all-term mode that dynamically selects the best configuration.
🛠 How Does It Work?
Pivot-Based Divergence Detection:
The script analyzes pivot points on both price and RSI to determine valid divergences.
Bullish divergence occurs when price forms a lower low but RSI trends higher, indicating potential upward momentum.
Bearish divergence occurs when price forms a higher high but RSI trends lower, signaling possible weakness.
Adaptive RSI Calculation:
The RSI length is dynamically adjusted based on the chosen time frame:
Short-Term: RSI (7) for 1-5 min charts.
Medium-Term: RSI (14) for 15-60 min charts.
Long-Term: RSI (28) for 4H+ charts.
In All-Term Mode, the script automatically determines the best RSI length based on the active chart timeframe.
Smart Visualization & Alerts:
Bullish divergences are marked with green lines & labels.
Bearish divergences are highlighted in red.
Users can customize symbol size, divergence labels, and colors.
Instant alerts notify traders as soon as a divergence is detected.
🎯 How to Use This Indicator?
📌 For Trend Reversals: Look for bullish divergences at key support levels and bearish divergences at resistance zones.
📌 For Trend Continuation: Combine divergence signals with moving averages, volume analysis, or price action strategies to confirm trades.
📌 For Scalping & Swing Trading: Adjust the time-frame settings to match your trading style.
🏆 What Makes This Indicator Original?
🔹 Unlike standard RSI divergence indicators, this script features real-time analysis with no repainting, allowing for instant trading decisions.
🔹 The time-frame adaptive RSI makes it dynamic and suitable for any market condition.
🔹 The multi-term divergence detection offers flexibility, giving traders a precise view of both short-term & long-term market structure.
⚠ Note: No indicator guarantees 100% accuracy. Always use additional confirmations and sound risk management strategies.
If you find this tool useful, don’t forget to support & share! 🚀

Doji Double Top & Double Bottom
FUNCTION :
This indicator checks if 2 consecutive candlesticks are formed in such a way that both the lows or both the highs of the consecutive candlesticks are almost at the same level and either of them is a doji
TIMEFRAMES :
it works on daily, weekly, monthly and higher timeframes
CRITERIA :
There is maximum difference value between 2 consecutive candlesticks' lows or 2 consecutive candlesticks' highs
Minimum value of the doji's wick size
Maximum value of the doji's body size
These 3 conditions need to be fulfilled for the 2 consecutive candlesticks to be considered as a Double top or Double bottom by this indicator
EXAMPLES :
Here the indicator is giving only double Bottom signals on CRUDE OIL chart
Here the indicator is giving only double top signals on GOLD chart
Here the indicator gives both double top & double bottom signals on EUR/USD Daily chart
Here the indicator is giving both double top & double bottom signals on EUR/USD Half-Yearly chart
DEFINITIONS :
There are 2 types -
DOJI DOUBLE BOTTOM - if the lows of 2 consecutive candlesticks are almost at the same level & either of them is doji then it is called Double Bottom and market is supposed to go higher after forming it.
DOJI DOUBLE TOP - if the highs of 2 consecutive candlesticks are almost at the same level & either of them is doji then it is called Double Top and market is supposed to go lower after forming it.
SETTINGS :
There are options to change the value of each of the 3 parameters within the indicator's settings for daily, weekly & monthly chart [
LIMITATIONS :
You should not trade based on the signals from this indicator solely, you should check other parameters too before making trading decision
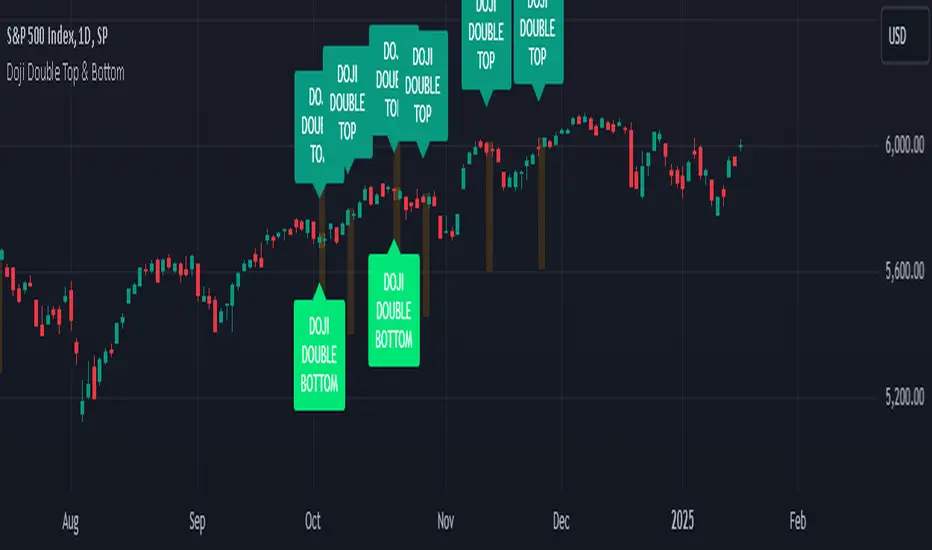
Prime Bands [ChartPrime]The Prime Standard Deviation Bands indicator uses custom-calculated bands based on highest and lowest price values over specific period to analyze price volatility and trend direction. Traders can set the bands to 1, 2, or 3 standard deviations from a central base, providing a dynamic view of price behavior in relation to volatility. The indicator also includes color-coded trend signals, standard deviation labels, and mean reversion signals, offering insights into trend strength and potential reversal points.
⯁ KEY FEATURES AND HOW TO USE
⯌ Standard Deviation Bands :
The indicator plots upper and lower bands based on standard deviation settings (1, 2, or 3 SDs) from a central base, allowing traders to visualize volatility and price extremes. These bands can be used to identify overbought and oversold conditions, as well as potential trend reversals.
Example of 3-standard-deviation bands around price:
⯌ Dynamic Trend Indicator :
The midline of the bands changes color based on trend direction. If the midline is rising, it turns green, indicating an uptrend. When the midline is falling, it turns orange, suggesting a downtrend. This color coding provides a quick visual reference to the current trend.
Trend color examples for rising and falling midlines:
⯌ Standard Deviation Labels :
At the end of the bands, the indicator displays labels with price levels for each standard deviation level (+3, 0, -3, etc.), helping traders quickly reference where price is relative to its statistical boundaries.
Price labels at each standard deviation level on the chart:
⯌ Mean Reversion Signals :
When price moves beyond the upper or lower bands and then reverts back inside, the indicator plots mean reversion signals with diamond icons. These signals indicate potential reversal points where the price may return to the mean after extreme moves.
Example of mean reversion signals near bands:
⯌ Standard Deviation Scale on Chart :
A visual scale on the right side of the chart shows the current price position in relation to the bands, expressed in standard deviations. This scale provides an at-a-glance view of how far price has deviated from the mean, helping traders assess risk and volatility.
⯁ USER INPUTS
Length : Sets the number of bars used in the calculation of the bands.
Standard Deviation Level : Allows selection of 1, 2, or 3 standard deviations for upper and lower bands.
Colors : Customize colors for the uptrend and downtrend midline indicators.
⯁ CONCLUSION
The Prime Standard Deviation Bands indicator provides a comprehensive view of price volatility and trend direction. Its customizable bands, trend coloring, and mean reversion signals allow traders to effectively gauge price behavior, identify extreme conditions, and make informed trading decisions based on statistical boundaries.

Improved G-Trend DetectionIt is the Improved version of G trend channel detection.
The Umair Trend Detection Indicator is a powerful tool designed to help traders identify potential buy and sell opportunities by combining dynamic price channels with RSI-based confirmation. This indicator is suitable for all types of financial markets, including stocks, forex, and cryptocurrencies.
Key Features:
Dynamic G-Channels
Calculates upper, lower, and average price channels based on the "G-Channel" methodology.
Helps identify market extremes and potential reversal points.
RSI Confirmation
Integrates RSI (Relative Strength Index) to filter buy and sell signals.
Avoids false signals by ensuring market momentum aligns with trend direction.
Buy/Sell Signals
Generates "Buy" signals when bullish conditions align with oversold RSI levels.
Generates "Sell" signals when bearish conditions align with overbought RSI levels.
Exit Signals
Provides optional exit points for both long and short positions using a buffer for confirmation.
Visual Clarity
Displays clearly plotted channels and average lines to help visualize price trends.
Buy and sell signals are marked with arrows for easy identification on the chart.
Custom Alerts
Offers customizable alerts for buy, sell, and exit conditions, ensuring traders never miss an opportunity.
Input Parameters:
Channel Length: Controls the sensitivity of the G-Channels.
Multiplier: Adjusts the width of the channels to suit different market conditions.
RSI Settings: Customize RSI length and thresholds for overbought/oversold conditions.
Exit Signal Buffer: Adds flexibility to the exit strategy by delaying signals for confirmation.
How It Helps:
The Umair Trend Detection Indicator is perfect for traders looking for an easy-to-use trend-following system with strong confirmation. By combining dynamic channels with RSI, it provides accurate and reliable signals to enter and exit trades, minimizing risks associated with false breakouts or trend reversals.
Use Cases:
Trend Trading: Identify and follow long-term trends with confidence.
Swing Trading: Spot reversals and capitalize on medium-term price movements.
Risk Management: Use exit signals to lock in profits or limit losses effectively.
This indicator is a versatile tool for both novice and experienced traders. Fine-tune its settings to align with your trading style and improve your decision-making in any market.
