Ichimoku Kinko HyoIchimoku Kinkō Hyō (IKH) — 一目均衡表
Ichimoku Kinkō Hyō is a complete Japanese charting system developed by Goichi Hosoda and his team in the late 1930s. It was designed to visualize market structure at a glance: trend direction, momentum, and key support/resistance zones.
This implementation preserves the classic Ichimoku structure while adding modern usability features. It is built for traders who want clean structure and beginner-friendly visuals with detailed tooltips. In addition to the traditional system, this version optionally includes scenario projections and historical flat level detection .
-----------------------------------------------------------------------------------------------
Ichimoku calculation reminder (5 key lines)
• Tenkan-sen (転換線 / Conversion Line)
Short-term equilibrium (fast)
Midpoint of the highest high and lowest low over the last 9 periods
• Kijun-sen (基準線 / Base Line)
Medium-term equilibrium (slow)
Midpoint of the highest high and lowest low over the last 26 periods
• Senkou Span A (先行スパンA / Leading Span A)
Forward “average equilibrium” (faster cloud boundary)
Average of Tenkan-sen and Kijun-sen, plotted forward by the displacement (default 26)
• Senkou Span B (先行スパンB / Leading Span B)
Long-term equilibrium (slower cloud boundary)
Midpoint of the highest high and lowest low over the last 52 periods, plotted forward by the
displacement
• Chikou Span (遅行スパン / Lagging Span)
Confirmation line (price vs past context)
The closing price plotted backward by the displacement
-----------------------------------------------------------------------------------------------
Key Features
Selectable Calculation Timeframe
Choose the timeframe used for Ichimoku calculations (or select “Chart” to use the current chart timeframe).
Inputs-First Design
Line colors defined in Inputs are used consistently across:
• Plots
• Labels
• Projection segments
• Flat levels
Flexible Labelling (Optional)
Supports customizable labels for Ichimoku lines.
• Japanese (Romanized) or English terminology
• Full or Short names
Romanized Japanese:
• Tenkan-sen → Tk
• Kijun-sen → Kj
• Senkou Span A → SSA
• Senkou Span B → SSB
• Chikou Span → Ck
English:
• Conversion line → Conv
• Base line → Base
• Lead line A → Lead A
• Lead line B → Lead B
• Lagging Span → Ls
Additional options:
• “Label + text” or “Text only”
• Optional timeframe tag
• Optional value display
• Per-line custom label text
• Hide any label using OFF or -
-----------------------------------------------------------------------------------------------
Scenario Projections — “No New High / Low” (Optional)
Conditional forward segments for:
• Tenkan-sen (up to 5 steps)
• Kijun-sen (up to 13 steps)
• Senkou Span A (up to 10 steps)
• Senkou Span B (up to 20 steps)
This is a scenario tool — not a prediction. It assumes upcoming bars do not create new highs or lows beyond the current lookback window.
Example:
For a Kijun-sen lookback of 26
+1 segment uses the last 25 bars
+2 uses the last 24 bars
+3 uses the last 23 bars
…and so on.
-----------------------------------------------------------------------------------------------
Flat Levels — Past Equilibrium Shelves (Optional)
Flat levels are historical horizontal “shelves” where an Ichimoku line remained unchanged for several consecutive bars. These shelves often act as future support or resistance because they represent prior equilibrium zones.
Detects flat segments on selected lines:
• Tenkan-sen
• Kijun-sen
• Senkou Span A
• Senkou Span B
A flat is confirmed when the line remains identical for at least Min flat length bars.
The script then:
• Displays up to Max levels, selected by proximity to the current price
• Draws horizontal rays from the flat’s ending point and extends them rightward
Flat Level Options
• Show flat levels (master on/off)
• Select which lines generate levels
• Min flat length (bars)
• Lookback window (bars)
• Max levels to display
• Ray style / thickness
Color mode:
• By line color
• Support / Resistance (levels below price = support, above price = resistance)
Flat Labels (Optional)
Flat levels can display right-side labels using the same labeling system as the Ichimoku lines, including:
• Language + length
• Optional timeframe tag
• Optional value display
• “Label + text” or “Text only”
• Shared far-right offset for clean alignment
-----------------------------------------------------------------------------------------------
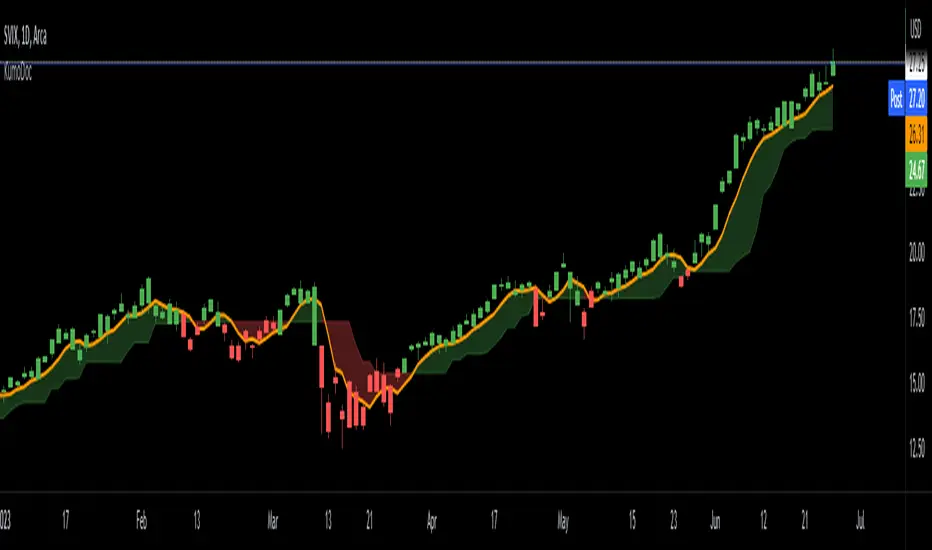
Example of an alternative chart layout
-----------------------------------------------------------------------------------------------
Notes / Disclaimer
• Projections and flat levels are analytical tools, not forecasts.
• No trading signal is guaranteed. Always manage risk appropriately.
• This script uses Pine Script® version 6.
-----------------------------------------------------------------------------------------------
Credit
• Thanks to NgheTrader for inspiration regarding projection / future-line concepts.
• Thanks to the TradingView team for the platform and charting infrastructure.
Chỉ báo Pine Script®