Relative Strength IndexThe relative strength index (RSI) is a momentum indicator that measures the magnitude of recent price changes to evaluate overbought or oversold conditions in the price of a stock or other asset. The RSI is displayed as an oscillator (a line graph that moves between two extremes) and can have a reading from 0 to 100. The indicator was originally developed by J. Welles Wilder Jr. and introduced in his seminal 1978 book, New Concepts in Technical Trading Systems.
Traditional interpretation and usage of the RSI are that values of 70 or above indicate that a security is becoming overbought or overvalued and may be primed for a trend reversal or corrective pullback in price. An RSI reading of 30 or below indicates an oversold or undervalued condition...more here .
-------------------------
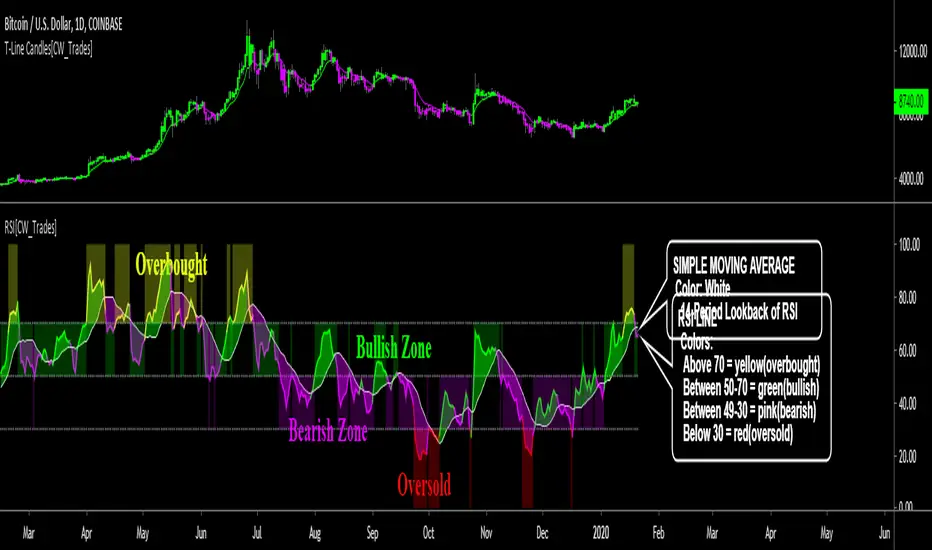
*This indicator uses standard RSI settings of a 14-period lookback with a midline of 50, overbought level of 70 and oversold level of 30.
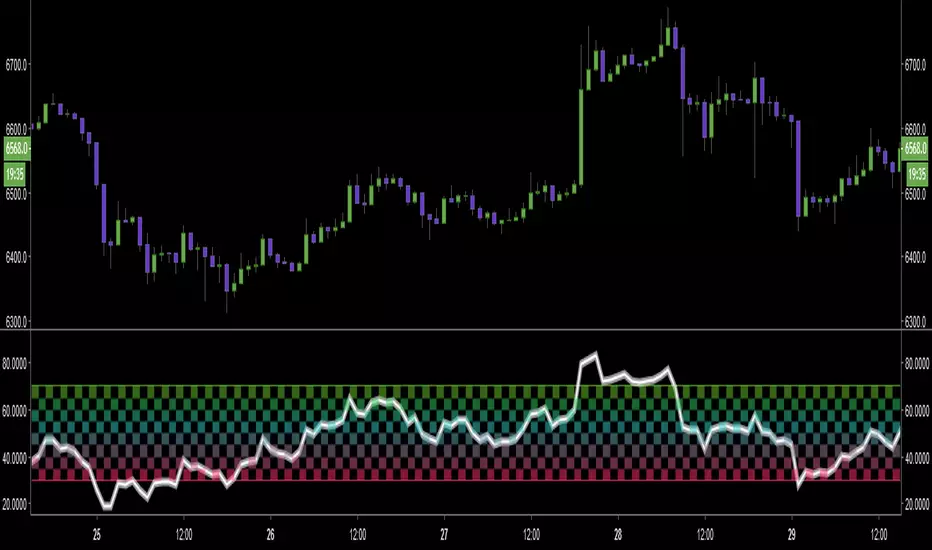
This RSI indicator has been modified to include a simple moving average of the RSI, adjustable overbought and oversold horizontal lines, a color-changing RSI line, color-filled RSI horizontal levels and color-filling the space between the RSI and simple moving average.
-This simple moving average(SMA) is set to a lookback period of 14 and is plotted as a white line. As the RSI moves above and below the SMA the color of the RSI changes; when above the SMA the RSI is lime, when below he SMA the RSI is pink. Lime indicates bullish momentum for RSI, pink indicates bearish momentum for RSI.
-When the RSI line is above 70 the RSI and background both turn yellow, this indicates overbought conditions.
-When the RSI line is below 30 the RSI and background both turn red, this indicates oversold conditions.
-The backgrounds fill the levels the RSI is trading between and can be turned on/off.
-The space between the RSI and SMA is filled and can be turned on/off.
-The RSI line can be set to solid or multi-color.
-The horizontal lines can be adjusted and turned on/off.
-The SMA can be adjusted.
For crypto or volatile markets, overbought and oversold levels of 80 and 20 are recommended.
Colored
Ichimoku Cloud & CandlesThe Ichimoku Cloud is a hybrid indicator combining numerous technical indicators that show support and resistance levels, as well as indicating momentum and trend direction. Ichimoku does so by taking multiple, pre-set price moving averages and plotting them on the chart in line form. It also uses these inputs to create a "cloud" which intends to forecast where the price may find support or resistance in the future. Refer to standard, and widely available, Ichimoku Cloud technical publications and/or YT videos for information on how to trade using the Ichimoku Cloud.
This indicator uses standard/default Ichimoku settings. The difference between this indicator and standard Ichimoku indicators is that the candle colors are based on price relative to the Tenkan-sen and Kijun-sen, and as such are painted lime, fuchsia and gray. Lime price candles indicate that price is in an uptrend; fuchsia candles indicate a downtrend; gray is no identifiable trend, or neutral.

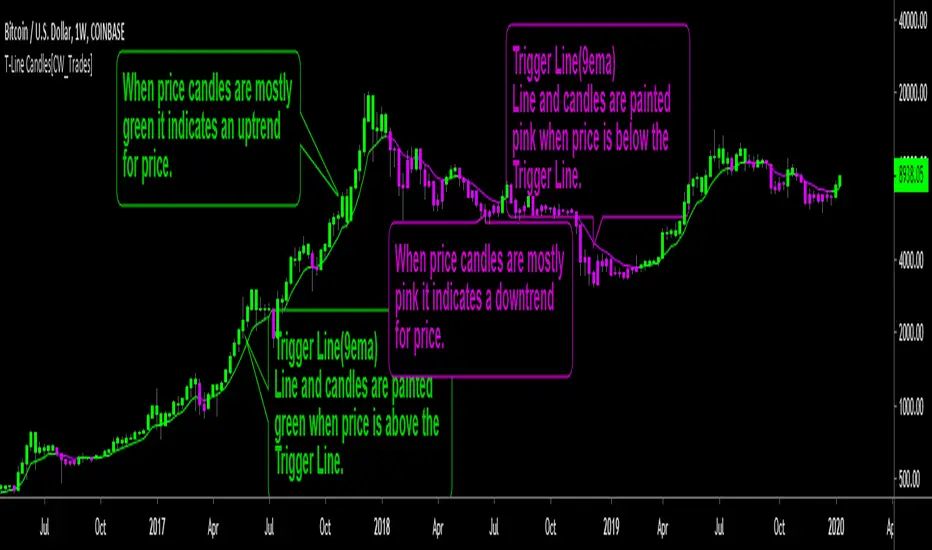
Trigger Line CandlesThis is a trend indicator utilizing a 9-period exponential moving average, known as the Trigger Line. When price is above the Trigger Line both the candles and Trigger Line are colored green, indicating an uptrend for price. Price will tend to find support at the Trigger Line when trending above the Trigger Line. When price is below the Trigger Line both the candles and the Trigger Line are colored pink, indicating a downtrend for price. Price will tend to find resistance at the Trigger Line when trending below the Trigger Line.
Coloring price candles based on price relation to the Trigger Line paints a clearer picture of the true short-term trend behind price, rather than traditional price candles which only paint price in two colors representing individual candle up and down movement while no short-term trend identification is utilized.
Indicator inputs are editable; candle colors and T-Line can be turned on/off.
Indicator inspired by Stephen Bigalow's T-Line strategy.
RSI background by AvesTradingHello,
This is RSI indicator that shows background color, when proper levels reached, instead of line in another pane. Customizable options are available:
- source
- length
- overbought level
- oversold level
I have added as well RMA of RSI for extra confirmation if needed. I hope you enjoy and will leave me some feedback! Don't forget to follow me for new releases.
Cheers
Aves
Please remember that the indicators provided by me are for educational purposes only.

BEST Multicolor Supertrend InfoPanelHello traders
Today is a Pinescript hack to display multiple colors in one label.
I used that panel to show the Supertrend Long Term values (weekly, monthly, quarterly, yearly)
What is a Supertrend?
Definition : SuperTrend is an indicator that works on all timeframes and all instruments (stocks, futures, forex, ...). It is a great tool to follow market trends and optimizes your profits.
SuperTrend evolves below or above the prices depending on the trend. You can use it as an exit position indicator when its direction changes. You can also use it to place your stops.
So.... the hack is?
The hack is about creating a new label for each line - versus creating just one label containing the whole text
Best regards,
Dave

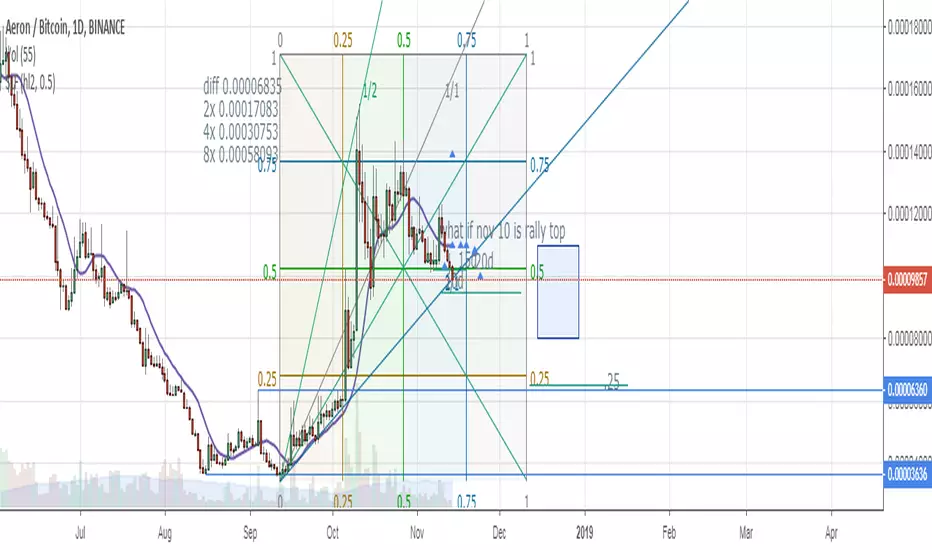
Multiple EMAs with marked zones and custom timeframe supportThis script plots 10 exponential moving averages and marks the areas between them.
The lengths are Fibonacci numbers starting from 5 and ending with 377.
The colors indicate the length of the moving average, green for the shortest and purple for the longest.
The zones between consecutive EMA's (e.g. 5 and 8 ema ) are market according to the color of the greater one in value.
By default the script plots values for the current time frame, but supports custom time frames.
I'm releasing this script with an open visibility. Feel free to suggest improvements!
Enjoy,
s0ullight

nTrend ULTIMATEHello traders
With this fabulous script, you can color the candles based on the indicator and timeframe you want
You can only apply one indicator at a given time obviously
The list of indicators are the following:
- Price vs Moving Average : if price is above, bullish color, if price is below, bearish color
- Trend Signal : if the Trend signal is pointing upwards, bullish color, if the Trend signal is point downwards, bearish color
- Supertrend : if supertrend is below the price, bullish color, if supertrend is above the price, bearish color
- MACD : if MACD is positive, bullish color, if MACD is negative, bearish color
- MACD ZERO LAG : if MACD ZERO LAG is positive, bullish color, if MACD ZERO LAG is negative, bearish color
- MM Cross : if MM cross is bullish , bullish color, if MM cross is bearish , bearish color
- Ichimoku: if price is above the cloud, bullish color, if price is below the cloud, bearish color
Hope you'll like it
Please feel free to comment to ask me to add any other indicator you like or simply to say how much you love it.
Positive vibes are always appreciated and will encourage me to give you more free content.
Dave

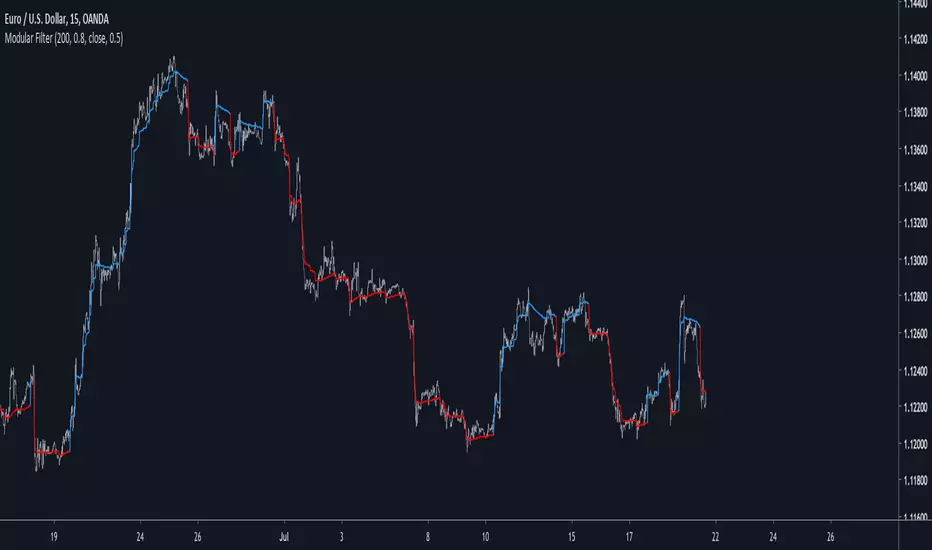
Modular Filter - Spot Trends And Smooth PriceIntroduction
This indicator can have a wide variety of usages, and since it is based on exponential averaging then the whole indicator can be made adaptive, thus ending up with a really promising tool. This indicator who can both smooth price and act as a trailing stop depending on user preferences, i tried to make it as reactive, stable and efficient as possible in order to both smooth and spot trends, lets view it more in depth.
The Indicator
line 8 and 9 create two bands, one upper and one lower, then based on certain conditions the indicator will only return a certain band or an average of both with different weights, this weight is controlled by the beta parameter, values of 1 will return a simple filter while values of 0 will return a classical trailing stop.
beta = 0
The indicator can use output values as input, thus using smoother values as input, in order to do so just check "Feedback", this help the overall output to be smoother as well as giving more long terms signals
The amount of feedback is controlled by the feedback weighting parameter, lower values will weight more the output values thus creating smoother results.
Feedback weighting of 0.2
Using beta = 0 thus having the indicator act as a trailing stop while having the feedback option activated return more long terms signals. Notes that the colors are based on the initial conditions of the indicator.
Conclusion
You can replace length and change alpha for any smoothing variable such as the efficiency ratio or anything with scale (1,0), same goes for beta and the feedback weighting parameter, this is why the indicator is "Modular" in addition of providing different usages. This indicator can look like cluster filters (smooth price monarch, forexguru) , filters with the ability to follow the price quite fine while being stables. I really hope you find an use to it.
Thanks for reading !
Colored Columns for Elder's Force Index EMAThe Elder's Force Index is an oscillator that takes into account the change of the price combined with the volume:
EFI = (close of the current day - close of the previous day) * volume of the current day
If measure the force of the price change.
If you calculate the exponential moving average of the last two days to smooth the signal EMA(EFI,2), you have a nice buy/sell indicator in the context of the "Elder Triple Screen Method":
- If you are in a long term uptrend (for example ema(13) going up), you have a buy signal if EFI(2)<0, because then you have a short term downtrend in a long term uptrend. Put a "stop buy" a bit higher in case the long term uptrend continues.
- If you are in a long term downtrend (for example ema(13) going down), you have a sell signal if EFI(2)>0, because then you have a short term uptrend in a long term downtrend. Put a "stop sell" a bit lower in case the long term downtrend continues.
This graph shows you colored columns for the EMA(EFI,2), which is more visible than the one-color indicator provided by default by TV.
You can also display the EFI itself on top of the columns. (optional, I personaly do not use it)
PS: ema(13) is to make the explanation simple. Personaly, I use MACD histogram on a weekly view to define if I am on a long term uptrend or downtrend.

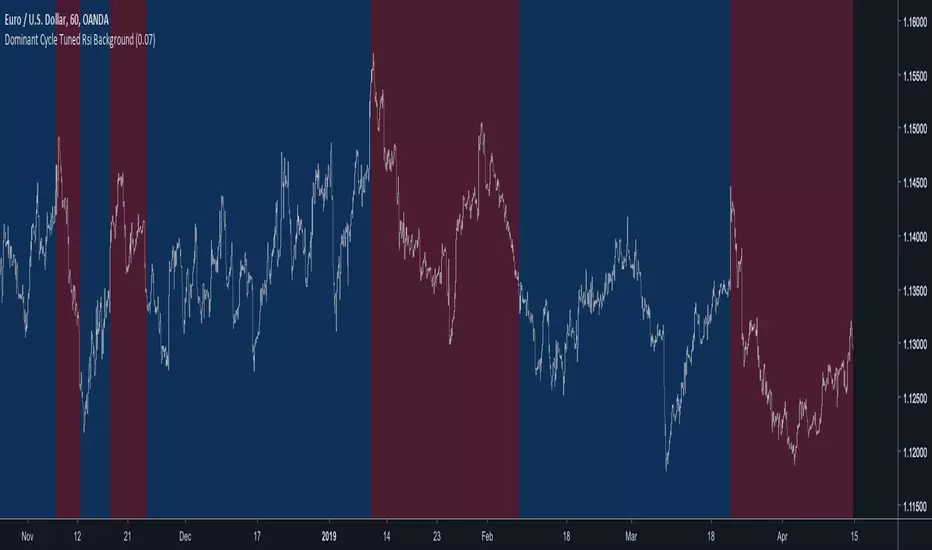
Dominant Cycle Tuned Rsi BackgroundBackground version of the Dominant Cycle Tuned Rsi Background published here

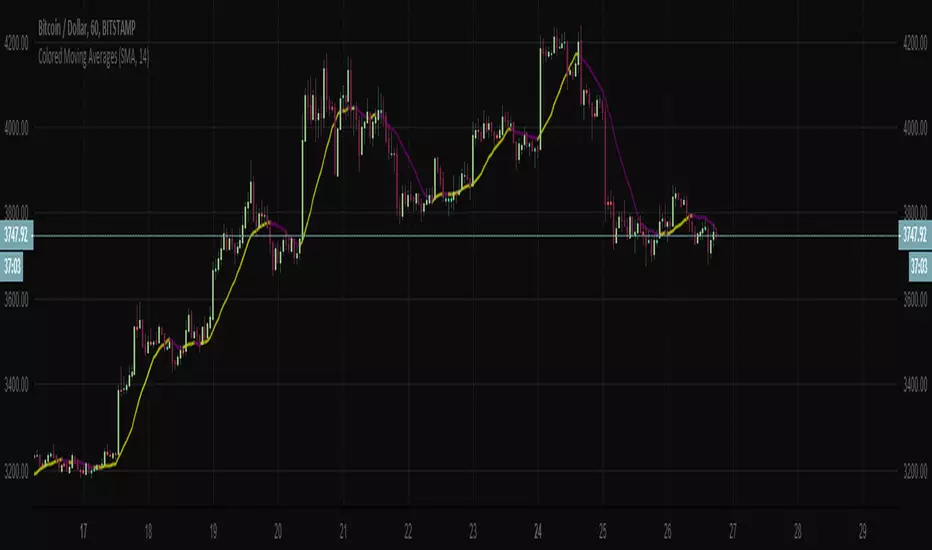
Colored Moving AveragesAs colored moving averages show local trends much better, here you go. Few different MA's in one script to switch between (SMA, EMA, WMA, VWMA, RMA).
You can also turn off 2 colors option if you don't need it.
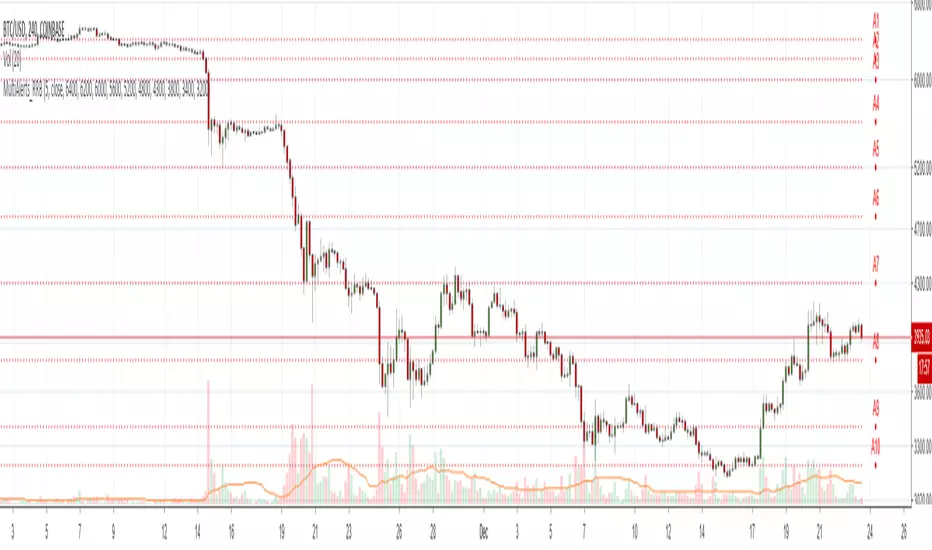
Zindarra Multi Alerts by RRBZindarra Multi Alerts by RRB by RagingRocketBull 2018
Version 1.0
This indicator lets you configure multiple alert levels for an asset. Zindarra Multi Alerts supports 10 custom alert levels.
You have to manually create an alert in Manage Alerts Panel and configure it to use with this indicator.
Free accounts are limited to only 1 alert slot and this indicator will take it (any existing alerts must be disabled/stopped).
Once the alert is configured, the indicator can be removed from chart to free a slot for another indicator, but you won't see the alert levels.
This is the Zindarra Multi Alerts Simple version. You can't auto disable already triggered alerts in this indicator. All alerts will remain active.
If you want to be able to hide/disable/change color of the triggered alert levels use the Zindarra Multi Alerts Pro version.
Features:
- 10 custom alert levels with labels
- set open/high/low/close source point for level penetration
- show/hide levels/labels
Usage:
1. attach indicator to a chart
2. define alert levels in UI settings
3. in TradingView's Manage Alerts panel on the right:
- for free accounts: disable/stop all existing alerts, you are limited to 1 alert slot only. Otherwise you won't be able to save.
- create a new Alert:
- select 'Multi Alerts' indicator name in the Condition dropdown box, leave Level 1 and Multi Alerts Cross as default options
- select 'Once Per Bar' or 'Once Per Minute' instead of 'Only Once' to trigger the alert multiple times
5. click Save. Your 9 alerts are enabled now.
Change Settings:
1. change levels/settings in UI
2. in Manage Alerts panel:
- open/edit the alert you created
- select new instance of 'Multi Alerts' indicator name in the Condition dropdown box (appears at the bottom)
- check the Condition dropdown again - a single instance should remain selected.
3. click Save. Your alert settings are updated.
Notes on using alerts:
- attaching this indicator to a chart and configuring alert levels will not automatically enable the alerts - you have to manually create/configure a new alert in the Alerts Panel
- removing this indicator from chart will not disable the alerts, you have to manually disable the alert you created in the Alerts Panel
- your alert in the Alerts Panel uses another instance (copy) of indicator/settings. Any changes won't affect the alert. You have to manually update the alert every time you change any settings in the indicator.
- recompiling and attaching your own version of indicator will require creating a new Alert (delete the old one).
- alerts are designed to work in realtime. In replay mode you will see only the alert levels but there will be no system alert messages. It's best to test the indicator in realtime on M1 (1 min) chart
- you will only see 1 system alert per bar/60 sec when multiple alert levels are crossed with a single bar.
- you can only see the alert levels when the indicator is attached to chart, they are not shown by the system alert.
- a standard bidirectional cross is used for all penetration sources
1. uses plot*, cross*, alertcondition
Zindarra Multi Alerts Pro (9 Levels) by RRBZindarra Multi Alerts Pro by RRB by RagingRocketBull 2018
Version 1.0
This indicator lets you configure multiple alert levels for an asset. Zindarra Multi Alerts Pro supports 9 custom alert levels.
You have to manually create an alert in Manage Alerts Panel and configure it to use with this indicator.
Free accounts are limited to only 1 alert slot and this indicator will take it (any existing alerts must be disabled/stopped).
Once the alert is configured, the indicator can be removed from chart to free a slot for another indicator, but you won't see the alert levels.
If you want 10 alert levels and don't need colors and Pro features - use Multi Alerts Simple version instead.
Features:
- 9 custom alert levels with labels
- 2 plot modes: plot and price line
- high/low or close level penetration modes
- show/hide levels/labels
- change color based on level position above/below price
- keep or auto disable triggered alerts
- trigger alerts only after a confirmed close
- swap level colors
Usage:
1. attach indicator to a chart
2. define alert levels in UI settings
3. in TradingView's Manage Alerts panel on the right:
- for free accounts: disable/stop all existing alerts, you are limited to 1 alert slot only. Otherwise you won't be able to save.
- create a new Alert:
- select 'Multi Alerts' indicator name in the Condition dropdown box, leave Level 1 and Multi Alerts Cross as default options
- select 'Once Per Bar' or 'Once Per Minute' instead of 'Only Once' to trigger the alert multiple times
5. click Save. Your 9 alerts are enabled now.
Change Settings:
1. change levels/settings in UI. Any changes will also reset already triggered level colors/visibility.
2. in Manage Alerts panel:
- open/edit the alert you created
- select new instance of 'Multi Alerts' indicator name in the Condition dropdown box (appears at the bottom)
- check the Condition dropdown again - a single instance should remain selected.
3. click Save. Your alert settings are updated.
Notes on using alerts:
- attaching this indicator to a chart and configuring alert levels will not automatically enable the alerts - you have to manually create/configure a new alert in the Alerts Panel
- removing this indicator from chart will not disable the alerts, you have to manually disable the alert you created in the Alerts Panel
- your alert in the Alerts Panel uses another instance (copy) of indicator/settings. Any changes won't affect the alert. You have to manually update the alert every time you change any settings in the indicator.
- recompiling and attaching your own version of indicator will require creating a new Alert (delete the old one).
- alerts are designed to work in realtime. In replay mode you will see triggered alert levels hiding/changing colors but there will be no system alert messages. It's best to test the indicator in realtime on M1 (1 min) chart
- you will only see 1 system alert per bar/60 sec when multiple alert levels are crossed with a single bar. However all of these levels will hide/change color in the indicator as expected.
- plot modes: price line - changes color of the whole level, style is not configurable; plot - changes color of a level's segment after each cross, configurable style
- you can only see the alert levels when the indicator is attached to chart, they are not shown by the system alert.
- For source=high/low a directional level penetration is used automatically (crossunder/low and crossover/high). For source=close a standard bidirectional cross is used. Colors always change above/below close.
1. uses plot*, cross*, alertcondition

BNG MACD / Blue and Green MACDJust publish it again so it's easier to search this indicator.
Just inspired from macd 4c.
I changed it to blue and green color so it's looks better.

Moving Average Shaded Fill Area Crossover EMA Color - EditableMoving Average Shaded Fill Area Crossover EMA Color with option to change EMA value

ADXRainbowColorEMAThis is an EMA that color changes based on ADX.
When ADX is low, EMA color is in lime or aqua, if the value of ADX moves higher, It changes from aqua to yellow and then red.
You can change the settings like EMA period and the color, etc in the dialog window.
Usually, as the trend becomes stronger, the ADX values rises, so there is a possibility on a trend when it is yellow or red.
Especially, when changing from aqua to yellow and red, it is a necessity check because it is a possibility of change from range to trend.
これはADXに応じて色が変化するEMAです。
ADXが低いときは、EMAの色はライム(明るい緑)やアクア(水色)ですが、ADXの値が高くなると、アクアから黄色、そして赤に変化します。
EMAの期間や色などはダイアログウインドウで変更できます。
通常、トレンドが強いとき、ADXの値は上昇します。その為、ラインの色が黄色や赤の時は、トレンド状態の可能性があります。
特に、色が水色から黄色、そして赤に変化するときは、レンジ状態からトレンドへと移行した可能性があるので、要チェックです。

Colored EMAThis is a modified version of the exponential moving average indicator to change color based on trend (red/bearish if price has closed below EMA, green/bullish if price has closed above EMA).

Volume Strength Candles / Colored BarsIs Price Action Higher or Lower on STRONG or WEAK VOLUME from lookback
(Strong or Weak Bulls // Strong or Weak Bears)
Candles / Bars Indicate the Following (default 13 period lookback / Length)
MAROON Bear Candle with STRONG VOLUME more than 150% of the lookback / length (13 default), STRONG Bear Candle Confirmed With Volume
RED Bear Candle while VOLUME is BETWEEN 50% & 150% of the Lookback / Length (13 default), Neutral Bear Volume Neither strong or weak
ORANGE Bear Candle with WEAK VOLUME (Less than 50% of the Length / Lookback)
DARK GREEN Bull Candle with STRONG VOLUME MORE than 150% of lookback
GREEN Bull Candle with Neutral VOLUME BETWEEN 50% & 150% of the lookback / Length
AQUA Bull Candle with WEAK VOLUME less than 50% of the Lookback
Is price confirmed by volume?
Can Change the Lookback / Length from 13
Can Change the Colors and Transparency to easily see based off your chart background colors I recommend ZERO Transparency to easily identify volume strength (i use white background but many use black or other)

Color Volume Bars V 0.1 - Paints bars accrding to its volume.Preliminary version of volume % compared exclusively to series (volume) average painted on each bar, according to adjustable parameters.
