Scalp God (top and bottom finder) (SATURN)I am very happy to present the Tradingview community the first of my new line of powerful indicators.
This is the SCALP GOD. It will clearly label market tops and bottoms for you, if you are scalping and looking to open or close a position this indicator will mark the local highs and lows for you. Or if you are a swing trader this can also give good signals as this indicator works on any pair and any timeframe! When you see the chart turning green you know for sure that a market top is forming, if the chart is turning red you know for sure a market bottom is forming. It is sometimes the absolute top or bottom and sometimes just an important local top or bottom. PM me if you find a better top & bottom indicator because I am trying to make this better than everything out there.
It absolutely can not repaint under any circumstances.
There are a few inputs for you to think about here:
-First is the length, this just decides how many previous bars to consider, making it longer will focus on more historical information while making shorter will make it focus on what has recently happened. 12 seems to be a good value, but it's not as important as the next two options.
-Next is the threshold value, setting it very low will mean that signals will get triggered very quickly, while a higher threshold will take more movement to trigger.
-Last and most important is the sensitivity value. A lower value here will make the signals much more sensitive and therefore able to flip and trigger faster. A higher sensitivity value will make the signals less sensitive and harder to flip, meaning that it will only look for movements that agree with the longer term trend. This is great for swing traders and scalpers that go with the trend.
-There is also a smoothening option, this will make it so the signals don't come on and off so much. Sometimes this will not be good for timing, but other times it will be a more certain signal for traders specifically looking for where the top or bottom ends.
It gets better because I added several of these indicators into one script, so if there is a particular set of sensitivities and thresholds that you like you can look at them all on the same chart without opening so many copies of this. To turn on an additional copy just check the "Sensitivity # On" box.
Everyone can try this for free for 3 days and after that it will be 0.025 BTC for lifetime use and this will include all future updates to this project. This is Project Saturn and this is the first indicator from a new series of indicators that will be coming out over the next year.
Hopefully this makes a lot of you rich! I'm very excited to see all of the uses people make with it.
Happy trading & good health!
Hàng hoá

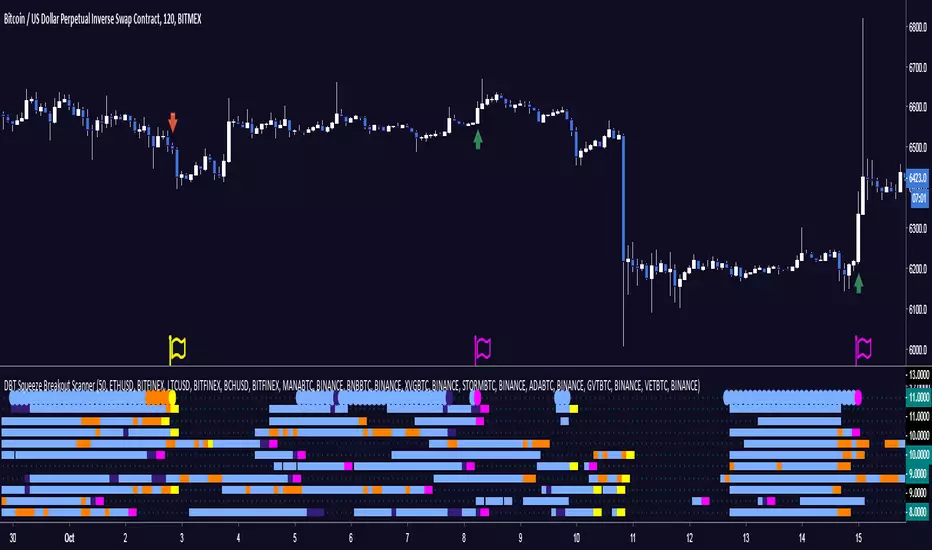
DBT Squeeze Breakout ScannerThe DBT Squeeze Scanner helps you keep an eye on 10 instruments at the same time. It uses a modified version of the DBT Squeeze strategy and scans this strategy against 10 instruments at the same time.
The scanner looks for areas of low volatility signified by a Bollinger Band squeeze and a light blue coloring on the scanner. Once it is squeezing it looks for potential breakout or breakdown opportunities
The scanner has warning signals for both long and short (sell for non margin exchanges) signals, these warning signals are shown as follows:
Light Blue = Bollinger Band Squeeze
Purple = Get ready for a Breakout
Pink = Squeeze has let go and a Breakout is Incoming
Orange = Get ready for a Breakdown
Yellow = Squeeze has let go and a Breakdown is Incoming
All of these signals have their own TradingView alerts. Alerts can be set for anyone of the 10 chosen instruments. Over 10 different kinds of alerts can be setup all at the same time.
This indicator is designed specifically for trending markets, and can be used in many different markets including: Equities, Futures, Commodities, Forex, and Cryptocurrencies. it will give significantly different signals in ranging markets. This indicator is also designed to be 100% preference, PLEASE make sure to choose which 10 instruments you want to watch, the defaults are just some of the major Cryptocurrencies.
Use at your own risk. This is not financial advise and this indicator is not guaranteed to make you profits. Please message me if you have any questions or feedback. Enjoy.
MADE BY GYROMATICAL
Volatility FilterOver the past few weeks (as of today, which is: 12th of October 2018) there has been little to no volatility in most of the major cryptocurrencies. What volatility does come in comes and goes very quickly. It's difficult to discern good and bad moments to be in a trade. As a result I decided to create a volatility filter based on Hurst exponent market phases, Bollinger Band width, moving averages, volume and the average true range. The results are the above.
You can use this indicator against any asset or within any market. It actually reaps excellent results against the DJI and XAUUSD One of my suggested uses for it is if you're scalping, only enter a position when there is volatility (when there's no background color present). If you're swinging, only enter a position when there's low volatility (when the red background color is present).
Another way to use it (although this isn't intended, just incidental) is to take a position in the direction of the first bar after the red background has gone/after low volatility has passed. So if we get a declining candle when we exit a low volatility zone, short. Otherwise long. This is the experimental side of it though.
However, this indicator won't tell you what direction to trade in, so in order to get use from it I suggest having a trend filter and a trigger. Luckily these two things are in most traders' arsenal. If not, take a look at my other script which is a timelessly brilliant trigger for buying and selling:
Something else to consider is that the volatility is relative. If we go through a period of incredibly high volatility then afterwards we can sometimes expect the volatility filter to plot a red background even though there is still acceptable volatility left in the market. The volatility at that point is much less than the volatility beforehand.
With all that said, this easy-to-read tool will help you avoid flat periods when scalping and, conversely, help you determine good times to enter a swing trade. For those who had difficulty trading the markets as of late due to volatility, this indicator is perfect for you
Access to the filter is provided for 10$, payable in most low-transaction-fee cryptocurrencies. Access is limited to 250 customers. For more information message me through TradingView or message @overttherainbow through Telegram.
Have a nice day and good luck trading.


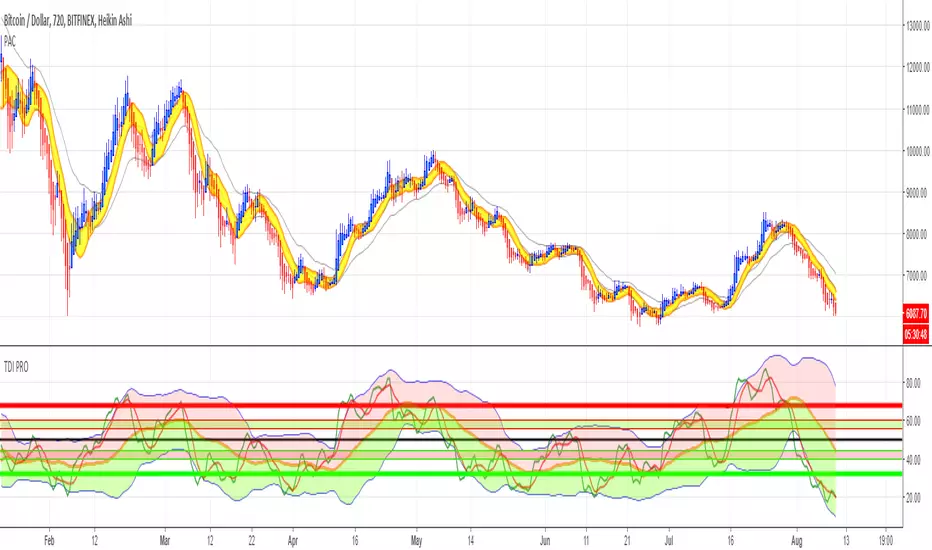
Price Action Channel ( PAC ) - Restoration by YardleyRosetteOriginal script PACMASTER by JustUncleL.
I (YardleyRosette) have republished this indicator with the fixed and optimal settings nearest to MetaTrader4 Traders Dynamic Index ("SYNERGY") Price Action Channel.
Therefore I feel I have to accredit myself for selecting the optimal settings as best intended by CompassFX .
Basic Rules:
Solid filled Heikin Ashi above (golden) yellow PAC indicates strong upmove, trend trade ( Buy ). Solid filled Heikin Ashi under (golden) yellow PAC indicates strong downmove, trend trade ( Sell ).
Weak Heikin Ashi bars signal weakness as if of ranging/consolidating market conditions, especially when price is within PAC . This is an alert zone in which not to trade or to close trade for possible reversed direction.
2nd Channel made for assistance due to the unfixable precision settings when compared to MetaTrader4's Price Action Channel. MT4 displaces PAC in a certain manner TradingView has no script for programming.
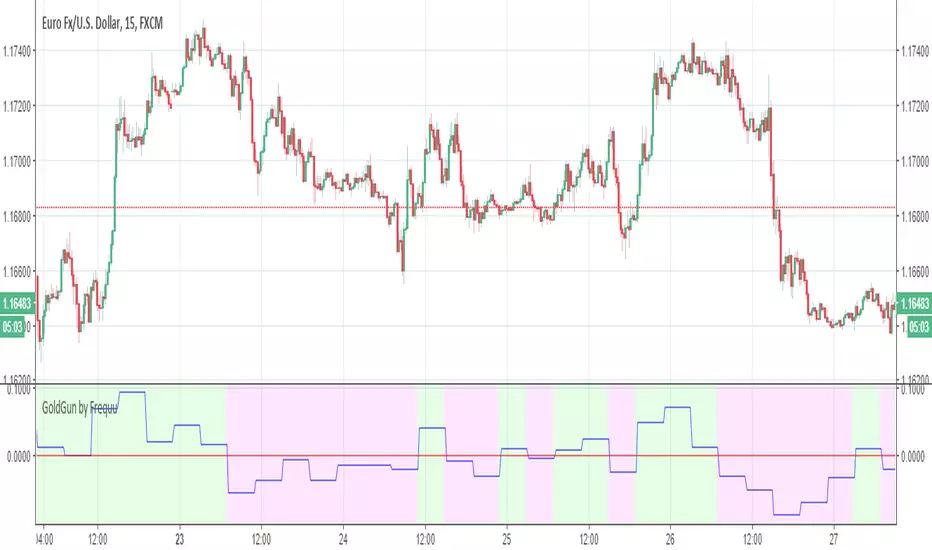
GoldGun by Frequu
Hi, I would like to present you the best script for manual / automatic trading
NO REPAINT
ALERT FIX
ALERT NO DOUBLE!
- ALL PAIR STOX (over 90%)
- GOLD (80-85%)
- and more more more ..
Script i`m testing on 1BROKER, binance and pepperstone, working brilliant !
Signal StreamSIGNAL STREAM
Want a TL;DR?
Signal Stream gives you actionable trading signals. It’s as simple as that.
LONG ANSWER
Signal Stream is the culmination of years and years of research, testing, and analysis of The Big Three data points of market information.
• Major Data Point One – PRICE. The one everyone cares about most.
• Major Data Point Two – TIME. We’re all bound by it. We can’t escape it.
• Major Data Point Three – VOLUME. With this third point, the market takes on an entirely new dynamic.
Signal Stream takes these points into account, runs them all through tested (ridiculously so) algorithms based of our knowledge and experience trading.
The result? Clean, actionable signals you can trade.
Primarily used on and around the 1 hour time frame. That’s the power of TradingView! So many custom time frames to look at!
Blue arrow pointing up? Go long!
Red arrow pointing down? Go short!
SIMPLY PRESENTED – COMPLEXITY HIDING UNDER THE HOOD
To be perfectly clear, this isn’t some script that does a couple MA crossovers and checks RSI against the Elliot Wave Fib Zig Zag on a Bollinger Band.
Signal Stream is 2000+ lines of tested, rigorous logic built in Pine for TradingView.
It’s based on a method of price action and volume analysis that has been proven profitable over and over for the past 10 years.
What method exactly? Weeeeell…. That’s our secret sauce. :)
But it’s a secret sauce developed over the past ten years by traders with a combined 25+ years in trading and trading system development.
We’ve refined our analysis of PRICE and TIME and VOLUME.
It’s a little bit like if pattern analysis and VSA had a kid and then taught that kid a lot of other really important market confluence ideas.
Okay, maybe that analogy got away from me….
Signal Stream is hours and and days and weeks and months and years spent in front of charts, writing code, staring at spreadsheets, testing, refining, and trading.
All distilled into a simple, power signal system.
SIGNAL STREAM GUARANTEE - NOT GONNA GIVE YOU THE RUN AROUND
Look, I can’t guarantee you will make money. That’s not only illegal, it’s also a ridiculous promise and absolutely a red flag. Anyone guaranteeing that you will make money is probably selling you snake oil and you should steer clear of them.
What I can guarantee is that there is no other indicator on TradingView right now that looks as deeply into PRICE, TIME, and VOLUME as Signal Stream does.
I guarantee you that Signal Stream provides clear, actionable signals based on 25+ years of experience and 10+ years of hardcore testing and live trading.
PM US TO GET PAYMENT INSTRUCTIONS AND ACCESS.

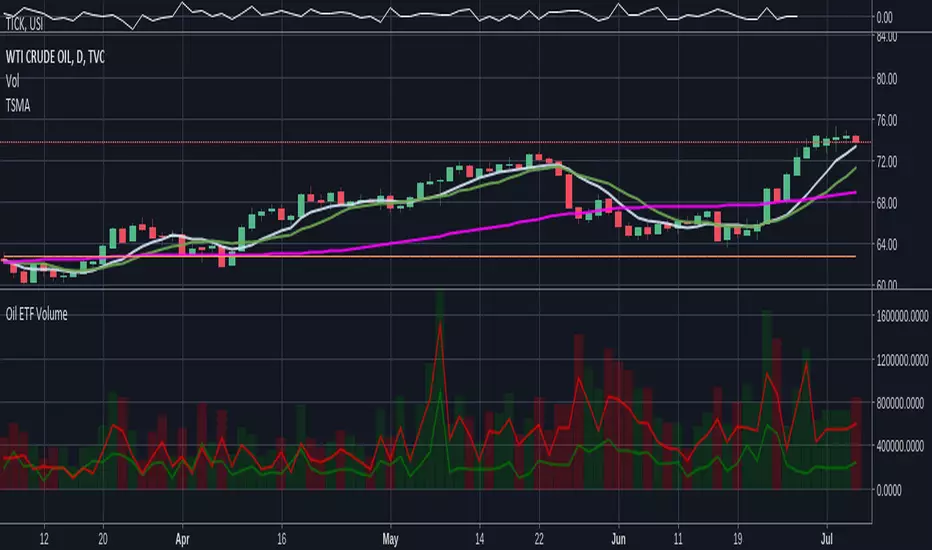
Oil ETF VolumeDirexxion Daily has both 'bear' and 'bull' oil ETFs. This tracks the volume in both combined. It also tracks them individually: the bear ETF is the red line, and bull the green.
NOTE: the color of the volume bars is determined by whatever ticker you're currently looking at, and whether current close is gt/lt previous close. It is intended to be used while looking at the USOIL chart. The colors will be inverted if you're looking at the 'bear' ETF! as the higher closes will actually mean price is going down :D
Gap finder (gold minds)This tool highlights where gaps happens and outlines in the chart where the gap zones are. If there is a gap up there is a green line, a gap down it is red. The gap zone is highlighted in blue. You can choose the size of your gap with the input menu to the desired size. Feel free to ask comment below. Made for the Gold Minds group

Bottom & Top Finder v3.0Bottom & Top Finder v3.0 is a proprietary multi-component oscillator designed to identify potential market reversals and extreme price conditions. The indicator analyzes momentum, volatility, and price behavior to generate bullish and bearish signals with strength classification.
█ OVERVIEW
Each signal is classified into three strength levels (Weak, Medium, Strong) allowing traders to prioritize high-conviction setups.
Signal Classification:
• Strong signals (±1.0): High conviction setups with multiple confirmations
• Medium signals (±0.6): Moderate conviction with key component alignment
• Weak signals (±0.33): Early warnings or preliminary indications
█ KEY FEATURES
Smart Signal Management
The indicator includes an intelligent system that allows signal sequences to complete naturally while preventing excessive noise. Unlike traditional cooldown systems that block all signals during a cooldown period, this implementation allows consecutive signals during a "run" and only applies cooldown after the signal run ends. This ensures complete multi-bar patterns are captured while preventing rapid flip-flopping.
Advanced Filtering System
Three optional filters allow adaptation to different market conditions:
• Volume Confirmation Filter: Validates signals against recent volume activity across a configurable lookback period. Checks if any bar in the lookback window exceeded average volume by the specified multiplier.
• Trend Alignment Filter: Four operational modes including With Trend, Counter Trend, Statistical Distance, or Off. The anomaly mode uses calculations to identify signals only at statistical extremes rather than simple directional bias.
• Signal Type Selection: Enable or disable weak, medium, and strong signals independently based on your trading style and risk tolerance.
Comprehensive Alert System
Ten distinct alert conditions cover every use case. Alerts include price level and timestamp, and are ready for webhook integration with automated trading systems.
█ HOW TO USE
Basic Setup
1 — Add "Bottom & Top Finder v3.0" to your chart in a separate indicator pane
2 — Optionally add "Bottom & Top Finder v3.0 - Chart Labels" for on-chart visual markers
3 — Configure lookback periods (defaults work well for most timeframes)
4 — Enable or disable signal strengths based on your trading style
5 — Apply filters as needed to reduce noise in your specific market
Signal Interpretation
Histogram magnitude indicates signal conviction. Multiple signal types can fire simultaneously and are aggregated into the composite score.
Alert Configuration
Set up alerts through TradingView's standard alert system using the built-in alert conditions. Choose from individual signal types (for specific setups) or aggregate alerts (for broader monitoring).
Recommended Approach
• Combine indicator signals with price action and support/resistance analysis
• Use strong signals for entries, weaker signals for early warnings or exits
• Enable filters when trading liquid markets with reliable volume data
• Adjust cooldown period based on timeframe: lower for active trading, higher for swing setups
• Start with default settings and adjust based on backtesting results
█ SETTINGS
Lookback Settings
• Main Lookback Period: Primary calculation period for most components (default: 21). Lower values increase sensitivity, higher values smooth signals.
• Range Lookback: Extended lookback for range high/low analysis (default: 50). Affects extreme condition detection.
Signal Settings
• Enable Weak Signals: Toggle weak signal detection (default: on)
• Enable Medium Signals: Toggle medium signal detection (default: on)
• Enable Strong Signals: Toggle strong signal detection (default: on)
Filter Settings
• Enable Volume Filter: Require volume confirmation (default: off)
• Volume Lookback: Period to check for volume spikes (default: 30)
• Volume Spike Multiplier: Threshold above average volume (default: 1.3x)
• Trend Filter Mode: Off, With Trend, Counter Trend, or Anomaly (default: off)
• Trend SMA Period: Moving average period for trend calculations (default: 50)
• Anomaly Threshold: Minimum statistical deviation for anomaly mode (default: 1.5)
Display Settings
• Show Composite Histogram: Toggle main histogram display (default: on)
• Show Signal Bars: Toggle triangle markers in indicator pane (default: on)
• Show RSI Reference: Overlay normalized RSI for context (default: off)
█ TIMEFRAME CONSIDERATIONS
The indicator works on any timeframe from 1-minute to monthly charts. However, optimal performance requires timeframe-appropriate configuration:
Shorter Timeframes (1m-15m)
Consider reducing main lookback period for increased responsiveness. Volume filter may be less reliable in some markets during low-liquidity sessions.
Medium Timeframes (1H-4H)
Default lookback periods are optimized for these timeframes. Volume and trend filters provide good noise reduction.
Longer Timeframes (1D+)
Consider increasing lookback periods for smoother signals. Filters are highly effective at these timeframes.
█ BEST PRACTICES
Risk Management
This indicator is a technical analysis tool designed to identify potential reversal zones and does not guarantee profitable trades. Users should:
• Understand that signals indicate potential setup zones, not guaranteed outcomes
• Employ proper position sizing and risk management on every trade
• Combine indicator signals with their own analysis and trading strategy
• Paper trade and backtest thoroughly before live implementation
• Never risk more than they can afford to lose
Signal Context
Indicator signals should be evaluated within broader market structure. Consider:
• Proximity to key support and resistance levels
• Overall trend direction and strength
• Market volatility and liquidity conditions
• Confluence with other technical indicators or patterns
• Fundamental factors that may override technical signals
█ NOTES
• All signals use confirmed bar data and do not repaint
• The cooldown system tracks top and bottom signals independently
• Multiple signal types can fire simultaneously; the composite score aggregates them
• Anomaly mode measures standard deviation magnitude, not just directional bias
• Volume filter checks any bar in the lookback period, not just the current bar
• Strong signals require more confirmations than medium or weak signals

Top Finder 1.1Top Finder is an automated cryptocurrency signals and analysis tool which uses a complex algorithm involving multiple indicators, trends, and cross-overs including proprietary formulas developed in-house to predict the top or near top price of cryptocurrencies. It also works well on stocks, gold, oil and forex, even soybeans!
Top Finder is the sister indicator to Bottom Finder (check my other scripts).
Signal strength is represented by height/color of the signal. (Taller signal = stronger signal).

Bottom Finder 2.2Release 2.2
Bottom Finder is an automated cryptocurrency signals and analysis tool which uses a complex algorithm involving multiple indicators, trends, and cross-overs including proprietary formulas developed in-house to predict the bottom price of cryptocurrencies. It also works well on stocks, gold, oil and forex!
Future updates will be included onto this script.
Tip #1: In a bear market, the Half height (fuchsia colored) signals should be ignored by the risk averse trader. In a bull market feel free to buy on both the signals.
Tip #2: In a bear market, use a smaller percent gain instead of TSSL to set your exit targets. In a bull do the opposite, using TSSL (or method of your choice) to exit.

Bottom Finder 2.1Release 2.1 Final!
Bottom Finder is an automated cryptocurrency signals and analysis tool which uses a complex algorithm involving multiple indicators, trends, and cross-overs including proprietary formulas developed in-house to predict the bottom price of cryptocurrencies. It also works well on stocks, gold, oil and forex!

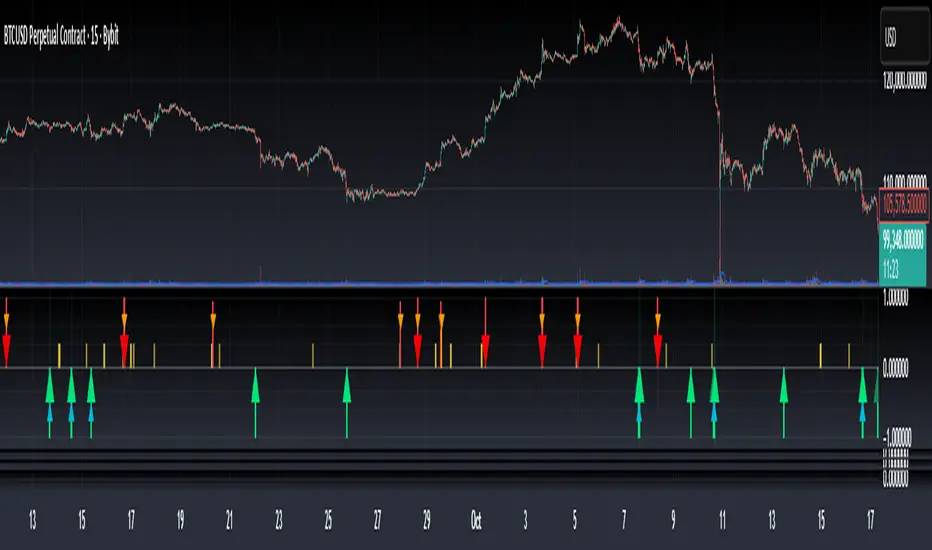
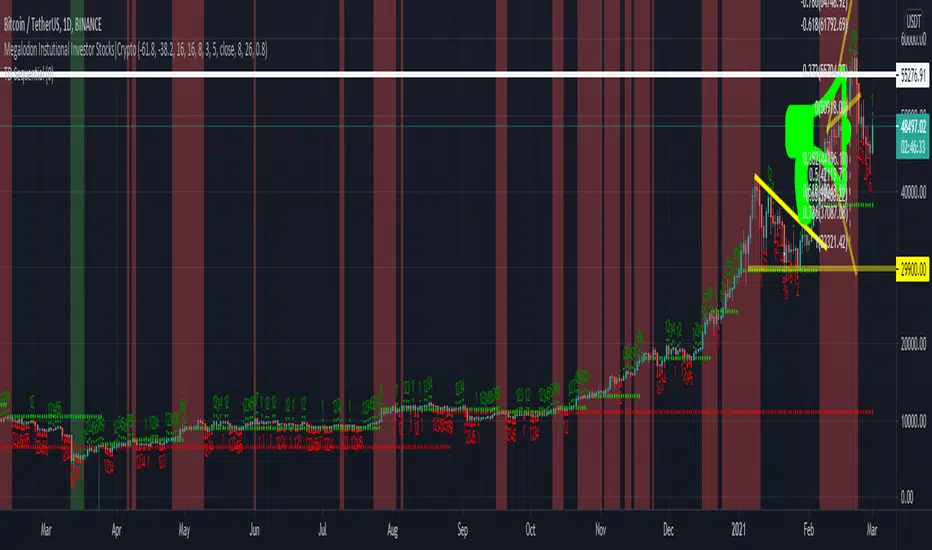
iPyra◬_theMegalodonTHEMEGALODON
theMegalodon looks for the institutional finger prints, the whales or the big boys.
theMegalodon is really simple to use.
theMegalodon combines the 8 different unique indicators, that each have almost perfect success rate.
theMegalodon works with any kind of market state, any kind of trading, and any kind of asset.
theMegalodon has more features than any other indicator in the market: Out of 9 working indicators, we have 3 momentum, 3 price and 3 volume indicators showing you the best signals.
--------------------------------------
theMegalodon is designed for us, the small fishes in the ocean, the millennials, the college students. This will basically makes us the new Megalodons(whale hunters).
All you have to do is:
1- Look for green or red arrows.
2- Look for orange or red candles.
3- Repeat
--------------------------------------
TECHNICAL DETAILS
Some boring info that you don't necessarily need to know.
1- Draws fibonacci retracement (s)' levels depending on your preferred look back period (Default: 365 and 120)
i) Can draw 2 fibs on the same chart. Can reverse the fib levels. Even, add an additional fib level to look for.
ii) Automatic fill function for a Reload Zone inside of a Reload Zone. *61.8% levels to 100% levels or 0% levels
2- Changes the color of the candle when strong buy(orange) or strong sell(red). Draws arrows on the chart for long and short positions.
i) Analyses and Combines
a) Price
b) Momentum
c) Volume
3- Prints out the indicators that are either giving Short or Long signs on the right corner.
4- The closer the unclebo indicator(click enable UncleBo) gets to the All time high, the better buy it is.
i) Same with the other way around. The closer it gets to the 0, the better sell it is.
5- Draws Bollinger Bands on the chart and shows where to buy or sell
6-The indicator is designed to be used in Daily time frame for the best calls to short or long.
--------------------------------------------------
iPyra◬
Enlighten others
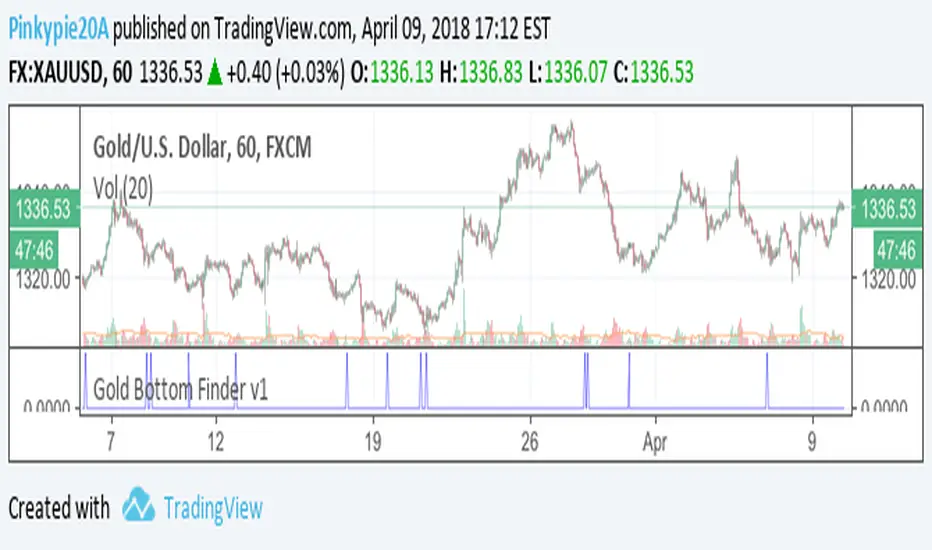
Gold Bottom Finder v1For the gold bugs, Bottom Finder Gold edition v1 script. If you would like to try it out, please post your access requests below.
min_Crypto_Thesis_indicator_MoriceauThis indicator is for minute candlestick and this back test work perfectly with Bitcoin and Gold.
The indicator tells you when you need to buy and sell your position. The backtest work at 86% of the last year.

Tick Tick BoomThis is THE tick tick boom method from the GOLD MINDS group!
When we enter a trade the line changes color.
If your charts are not in UTC time then you can adjust the UTC offset time. If your charts are in UTC-9 then set this to 9, if you are in UTC+1 set this to -1, if your charts are un UTC then set this to 0.
I noticed daily pivots, support, and resistance levels are pretty useful targets here. Uncheck the box if you would like to see the levels.
Many thanks to Dimitri Wallace!

Adjusting USOIL/USDWTI so it reflects CL1! Tired of adding 2 ticks? me too..
this works for USDWTI and USOIL only
bring up the USOIL or USDWTI chart, add this as an indicator and hide the candles for the main ticker symbol.. pretty simple

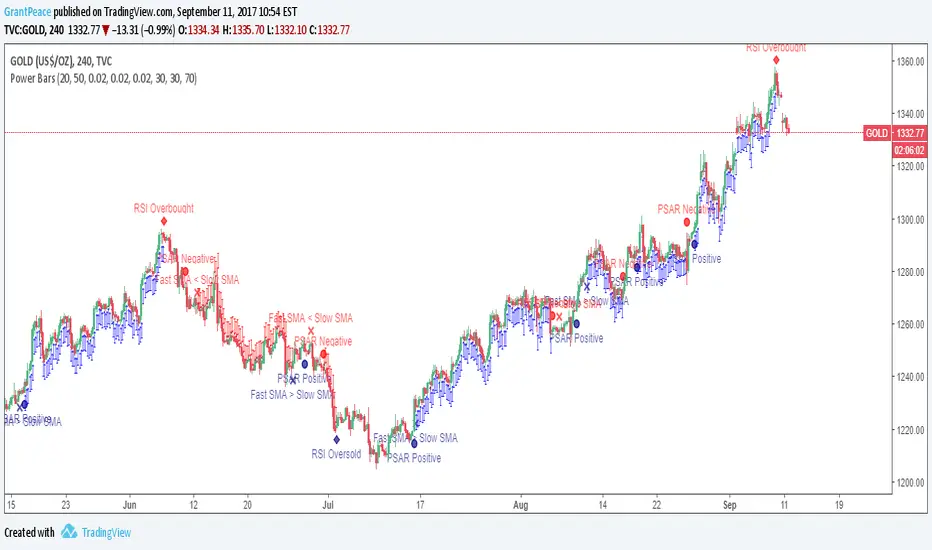
Power Bars This is the latest and greatest of technical analysis .
Values for your favourite indicators can easily be changed to customise your strategy.
When an indicator becomes bullish or bearish , a notification appears on the bar.
When all indicators align, Power Bars show up. Red Power Bars are bearish , blue Power Bars are bullish.
This is what the bars look like close-up.
ramntrade ( What NOT to DO)KEEP IT SIMPLE
indicator rules
WHAT NOT to do
indicator rules
Daily TimeFrame
Above ( 100 and yellow) = Don't Short
----------------------------
Below (minus100 and red) = never buy
