Reentry BUY SELL OnlyReentry BBMA tapi per 4 jam sekali,,
Entri di time frame m15 folow buy dan sellnya
Concept

Kinetic RSI [Vel + Accel] + AlertsThe Problem with Standard RSI
Most traders use the Relative Strength Index (RSI) to see if a market is "Overbought" (above 70) or "Oversold" (below 30). The problem? A strong trend can stay overbought for days, burning short sellers, or an asset can stay oversold while price continues to crash. Standard RSI tells you where the price is, but it doesn't tell you how hard it is moving.
The Solution: Kinetic RSI
This script reimagines RSI by applying basic physics concepts: Velocity and Acceleration.
Instead of asking "Is RSI below 30?", this indicator asks: "Is RSI below 35 AND did it just make a violent, high-speed turn upwards?"
It filters out lazy, drifting price action and only signals when momentum is accelerating in a new direction.
How It Works (The Math)
Velocity: We calculate the speed of the RSI change (Current RSI - Previous RSI).
Acceleration: We calculate if that speed is increasing (Current Velocity - Previous Velocity).
The Trigger: A signal is only generated if the RSI is in an extreme zone (<35 or >65) AND it has high Velocity AND positive Acceleration.
How to Trade It
1. The "Kick" Signals (Background Highlights)
🟢 Green Background (Bullish Kick): The RSI was low, but buyers stepped in aggressively. The momentum is not just positive; it is accelerating upward. This is often a "V-Bottom" catch.
🔴 Red Background (Bearish Kick): The RSI was high, but sellers slammed the price down. Momentum is accelerating downward.
2. The Line Color
Lime Line: Velocity is positive (Momentum is rising).
Fuchsia Line: Velocity is negative (Momentum is falling).
Usage: If the background flashes Green (Buy Signal), but the line turns back to Fuchsia (Red) a few bars later, the move has failed—exit the trade.
Settings & Alerts
RSI Length: Standard 14 (Adjustable).
Velocity Threshold: Controls sensitivity.
Lower (e.g., 2-3): More signals, catches smaller reversals.
Higher (e.g., 5+): Fewer signals, catches only massive "shocks" to the price.
Alerts Included: You can set alerts for "Bullish Kick," "Bearish Kick," or "Any Kick" to get notified of volatility spikes.
Best Practices
Wait for the Close: This indicator measures the closing velocity. Always wait for the bar to close to confirm the background color signal.
Trend Filtering: This works best as a "Reversal" indicator. If the market is in a super-strong uptrend, ignore the Bearish (Red) signals and only take the Bullish (Green) dips.

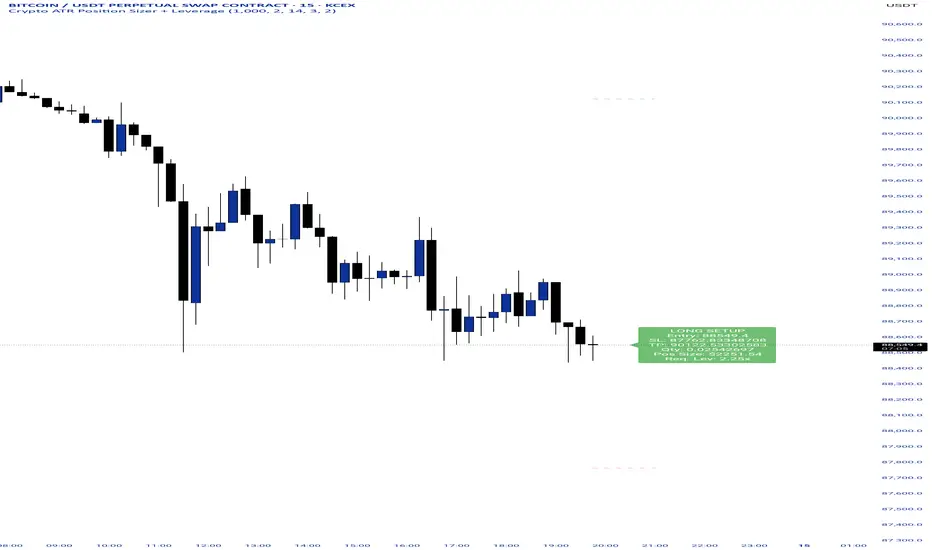
Crypto ATR Position Sizer + LeverageThis indicator is a "heads-up display" for crypto traders who need real time risk management without manually calculating position sizes. It uses Average True Range (ATR) to dynamically place Stop Losses based on current market volatility and automatically calculates the exact position size needed to respect your risk percentage.
Key Features:
Dynamic Risk Management: Stop Loss and Take Profit levels adjust automatically based on market volatility (ATR).
Auto-Position Sizing: Calculates the exact Quantity (in coins) and Position Value (in $) to ensure you never risk more than your defined percentage (e.g., 1% or 2%).
Leverage Calculator: Instantly sees the "Required Leverage" needed to execute the trade size relative to your account balance.
Crypto Precision: Displays up to 8 decimal places, making it compatible with both Bitcoin and low-sat altcoins.
Toggable Direction: Switch between Long and Short biases instantly via the settings menu.
How to Use:
Add the indicator to your chart.
Open Settings and input your Account Balance and Risk %.
Choose your direction (Long or Short) using the checkboxes.
The label will display your Entry, SL, TP, Coin Quantity, and Required Leverage in real-time.

Box Theory StrategyHere is an explanation of the Box Theory trading strategy.
The Core Philosophy
This strategy is based on the idea that the market is a battle between buyers and sellers, and that these groups often defend the same price levels they used previously. Instead of trying to predict every move, this method focuses on trading only at the "extremes" where the probabilities are highest, while avoiding the middle of the chart where price action is random.
1. The Setup: Drawing the Box
To use this strategy, you must define the "playing field" for the day before you take any trades.
Top of the Box: Draw a line at the Previous Day’s High.
Bottom of the Box: Draw a line at the Previous Day’s Low.
Center Line: Draw a line roughly in the middle of these two points.
This box represents the established range where the market recently found value.
2. The Three Zones & Rules
Once the box is drawn, the chart is divided into three zones. Each zone dictates a specific action.
Zone 1: The Top (Resistance / Sell Zone)
What it represents: This is where sellers previously stepped in and pushed the price down. It is a known area of supply.
The Rule: NO BUYING.
If the price rallies to this level, you should look for Short/Sell opportunities.
Why? Buying here means purchasing at a price that was previously rejected. The probability of a reversal (price going down) is high.
Zone 2: The Bottom (Support / Buy Zone)
What it represents: This is where buyers previously stepped in and pushed the price up. It is a known area of demand.
The Rule: NO SELLING.
If the price drops to this level, you should look for Long/Buy opportunities.
Why? Selling here means shorting into support. The probability of a bounce (price going up) is high.
Zone 3: The Middle (Indecision Zone)
What it represents: This is the area of noise and confusion. Neither buyers nor sellers have clear control here.
The Rule: DO NOT TRADE.
Why? In the middle of the range, the odds of the price going up or down are roughly 50/50. Trading here is considered gambling because you do not have a statistical edge.
3. Execution: How to Trade
The Entry
Short Setup: Wait for the price to touch or slightly pierce the Top of the Box. Enter a short position when you see the price failing to break out (e.g., leaving a wick and closing back inside the box).
Long Setup: Wait for the price to touch or slightly pierce the Bottom of the Box. Enter a long position when you see the price failing to break down (e.g., bouncing off the level).
Stop Loss (Risk Management)
This strategy offers a very clear invalidation point.
For Shorts: Place your Stop Loss just above the box.
For Longs: Place your Stop Loss just below the box.
Logic: If the price clearly breaks out of the box, the range is broken, and you want to exit the trade immediately with a small loss.
Take Profit (Targets)
First Target: The Center Line. This is a safe place to take some profit or move your stop loss to breakeven.
Main Target: The opposite side of the box (e.g., if you sold at the top, target the bottom).
4. Handling Gaps (The "Cheater Box")
If the market opens significantly higher or lower than the previous day's range (a large gap), the original box may be too far away to be useful.
Adjustment: In this scenario, you can draw a new box using the highest and lowest price points of the current trading session so far.
Once this new range is established, apply the same rules: Sell the high, Buy the low, and avoid the middle.

Hybrid Trend-Following Inside Bar BreakoutHybrid Trend-Following Inside Bar Breakout Strategy
The Hybrid Trend-Following Inside Bar Breakout Strategy is a rule-based trading system designed to capture strong directional moves while controlling risk during uncertain market conditions. It combines trend-following, price action, and volatility-based risk management into a single robust framework.
Core Concept
The strategy trades inside bar breakouts only in the direction of the dominant market trend. Inside bars represent periods of consolidation, and when price breaks out of this consolidation in a trending market, it often leads to impulsive moves with favorable risk–reward characteristics.
Key Components
1. Trend Filter
Uses 50 EMA and 200 EMA to define the market trend.
Bullish bias: 50 EMA above 200 EMA
Bearish bias: 50 EMA below 200 EMA
This filter prevents counter-trend trades and improves trade quality.
2. Volatility Filter
Compares fast ATR (14) with slow ATR (50).
Trades are taken only when volatility is expanding or above a minimum threshold.
This avoids low-volatility, choppy market conditions.
3. Inside Bar Breakout
An inside bar forms when the current candle’s high is lower than the previous candle’s high and the low is higher than the previous candle’s low.
A trade is triggered only when price breaks above or below the inside bar range in the direction of the trend.
4. Candle Quality Filter
Requires a minimum body-to-range ratio, ensuring that the breakout candle has strong momentum and is not driven by weak wicks.
Risk Management & Trade Management
Stop Loss (SL)
Placed using ATR-based dynamic stops, adapting to current market volatility.
Prevents tight stops in volatile conditions and wide stops in calm markets.
Partial Profit Taking
50% of the position is exited at 1.5R, locking in profits early.
This reduces psychological pressure and improves equity stability.
Trailing Stop
After partial profit is taken, the remaining position is managed with an ATR-based trailing stop.
Allows the strategy to capture large trend moves while protecting gains.
Cooldown Mechanism
After a losing trade, the system enters a cooldown period and skips a fixed number of bars.
This helps avoid revenge trading and overtrading during unfavorable market phases.
Why This Strategy Works
Trades only high-probability breakouts in trending markets
Adapts automatically to changing volatility
Combines price action precision with systematic risk control
Designed for consistent performance over long historical periods

Universe Structure & Trend Zone [All-in-One]**Overview**
The "Universe Structure & Trend Zone" is a comprehensive all-in-one trading toolkit designed to combine Institutional Trend Following with Smart Money Concepts (SMC/ICT). It helps traders identify the dominant trend direction while providing precise entry points based on Market Structure Breaks (MSB) and Order Blocks.
This script aims to filter out market noise by allowing trades only when Price Action aligns with the long-term trend (SMA Zone).
**Key Features**
1. **Market Structure Breaks (MSB) & ZigZag:**
- Detects structural shifts in price (Bullish/Bearish MSB).
- Uses a default Signal Length of 10 to filter out minor swings and focus on significant structural changes.
- Visualizes high and low pivot points.
2. **Smart Trend Zone (SMA 200 Filter):**
- Incorporates a 200-period SMA Zone (Institutional Level) to determine the macro trend.
- **Trend Filter Logic:** The indicator intelligently filters signals. It displays Bullish Order Blocks only when the price is trending *above* the SMA Zone, and Bearish Order Blocks only *below* it. This drastically reduces false signals in choppy markets.
3. **Order Blocks (OB) & Breaker Blocks (BB):**
- Automatically identifies high-probability Order Blocks and Breaker Blocks.
- Includes optional filters for Volume and Premium/Discount zones to validate the blocks.
- Features an auto-cleanup mechanism to remove invalid or broken boxes, keeping the chart clean.
4. **Hull Moving Average (HMA):**
- A fast-reacting 55-period HMA is included to visualize short-term momentum shifts (Green for Bullish, Red for Bearish).
5. **Smart Range (Support/Resistance):**
- Plots the dynamic Highest High and Lowest Low of the selected timeframe (default 4H) to show the current trading range and Equilibrium (EQ) level.
**How to Use**
* **Step 1:** Check the **SMA Zone** (Gray/Green/Red Band). If Price > Zone, look for Longs. If Price < Zone, look for Shorts.
* **Step 2:** Wait for a **Market Structure Break (MSB)** label in the direction of the trend.
* **Step 3:** Look for an entry at the retest of an **Order Block (OB)** or **Breaker Block (BB)**.
* **Step 4:** Use the HMA color change as a confirmation trigger or trailing stop guide.
**Settings**
* **Signal Length:** Default is 10 (Optimized for standard swings).
* **Trend Filter:** Enabled by default (Recommended to stay with the trend).
* **Display:** You can toggle MSB lines, Boxes, and Labels on/off to suit your visual preference.
**Disclaimer**
This indicator is for educational purposes only and does not constitute financial advice. Always use proper risk management.

Daily Open Shift The "Daily Open Shift" System (V2.0)
1. The Setup (Indicators & Timeframe)
• Timeframe: 15-Minute Chart (Execution).
• Key Levels: Daily Open (DO) or New York Open (NYO).
• Trend Indicators:
o 24 & 42 EMA Ribbon (Exponential Moving Averages).
o 30-Minute Supertrend.
________________________________________
2. Phase 1: Establish The Bias (The Filter)
This is the V2 upgrade. We do not trade against the day's opening momentum.
1. Mark the Open: Draw a horizontal line at the Daily Open (00:00) or Session Open.
2. The "First 2H" Rule: Observe the price action for the first 2 hours after the open.
o First 2H are Green/Bullish? → You are LONG BIAS only for the rest of the session. (Ignore all sell signals).
o First 2H are Red/Bearish? → You are SHORT BIAS only for the rest of the session. (Ignore all buy signals).
________________________________________
3. Phase 2: The Signal (The Switch)
Wait for the chart to confirm your bias technically.
1. The Switch: Price must cross and close a 15M candle on the correct side of the Daily Open.
o Longs: Price switches from below to above DO.
o Shorts: Price switches from above to below DO.
2. Indicator Confluence:
o EMAs: Must be crossed in your direction (Green for Long, Red for Short).
o 30M Supertrend: Must match your direction.
________________________________________
4. Phase 3: The Entry (The Trigger)
We never chase the breakdown. We wait for the price to come to us.
1. The Pullback: Wait for the price to retrace and touch/wick into the 24/42 EMA Ribbon.
2. The Confirmation: Watch the candle that touches the EMA.
o It must reject the EMA (wick off it) and close respecting the trend.
o Do not enter if the candle closes forcefully through the EMA, breaking structure.
3. Execution: Enter Market Order immediately on that candle close.
________________________________________
5. Phase 4: Risk Management (The Math)
This is the V2 upgrade. We aim for higher profitability.
1. Stop Loss (SL):
o Longs: Placed strictly below the lowest EMA band.
o Shorts: Placed strictly above the highest EMA band.
o Logic: If price crosses the EMA band completely, the trend is dead. Get out.
2. Take Profit (TP):
o FIXED 3R (Reward = 3x Risk).
o Example: If Risk is $100, TP is set to make $300.
o Rule: Do not move the TP. Do not close early. Let the math play out.
________________________________________
Summary Checklist (Print This)
Time: Is the First 2H bias clear? (Green=Buy / Red=Sell)
Switch: Did price close above/below the Daily Open?
Trend: Are EMAs crossed and Supertrend agreeing?
Patience: Did I wait for the price to pull back to the EMA band?
Trigger: Did the candle close respecting the EMA?
Execution: Market Entry + Stop Loss behind EMA + Fixed 3R Target.
Mindset: Am I at "2/10" emotion? Set the trade and walk away.

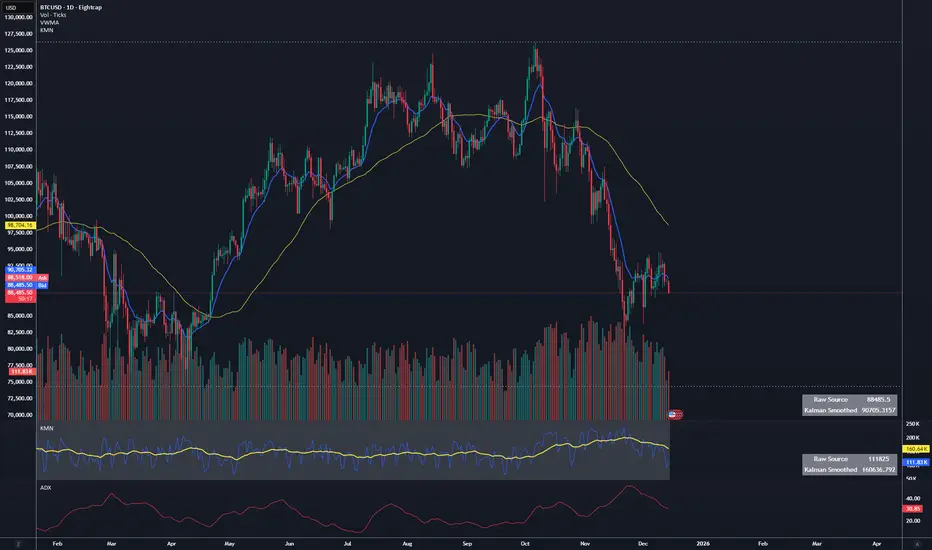
Kalman Smoother PanelPanel version of the Kalman smoothing indicator which I have setup myself to look at the volume but could be used for smoothing other noisy or erratic data values, it populates in a new pane below the main chart and has a small panel window of it's own to display the values that are output and the user is able to see the difference that way as well as in line chart format.
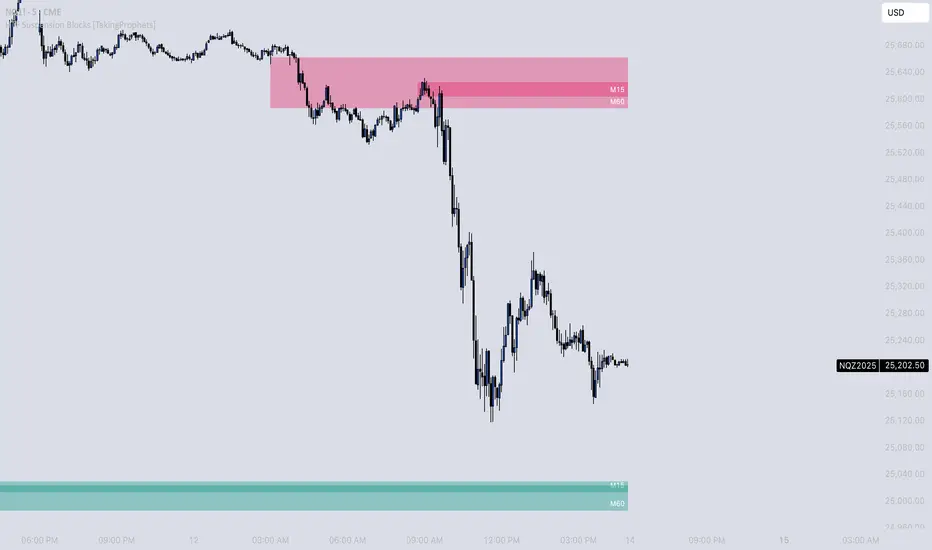
HTF Suspension Blocks [TakingProphets]-----------------------------------------------------------------------------------------------
HTF SUSPENSION BLOCKS
-----------------------------------------------------------------------------------------------
HTF Suspension Blocks bring ICT’s Suspension Block concept into a multi-timeframe workflow by detecting the 3-candle pattern on higher timeframes and projecting those zones directly onto your current execution chart.
Instead of only seeing Suspension Blocks on the timeframe they form, this script identifies valid HTF formations, draws their ranges on your lower timeframe, extends them forward, and manages invalidation automatically. You get higher-timeframe context while staying in your execution environment.
-----------------------------------------------------------------------------------------------
PURPOSE AND SCOPE
-----------------------------------------------------------------------------------------------
- Detect ICT-style Suspension Blocks on multiple higher timeframes (HTF 1 / HTF 2 / HTF 3)
- Project HTF blocks onto the current chart using bar-time anchored drawing
- Require measurable body-to-body separation defined in true ticks (instrument-aware)
- Auto-extend blocks forward in time until invalidation
- Optional Consequent Encroachment (50% equilibrium) inside each block
- Per-timeframe visibility limiting so charts stay clean and actionable
- Labels each block with the originating HTF (ex: M5 / M15 / M60)
- Alerts for:
- New HTF bullish / bearish block formation
- Price entering into any HTF bullish / bearish block
- Session-restricted alert windows (New York time)
-----------------------------------------------------------------------------------------------
WHAT IS A SUSPENSION BLOCK
-----------------------------------------------------------------------------------------------
A Suspension Block is a strict 3-candle displacement sequence defined by body-to-body gaps around a middle candle. This HTF variant uses the same model, but evaluates the pattern on a higher timeframe and then projects the zone onto your current chart.
Bullish Suspension Block logic:
- HTF Candle 1 close is BELOW HTF Candle 2 open by at least Minimum Body Separation
- HTF Candle 3 open is ABOVE HTF Candle 2 close by at least Minimum Body Separation
- HTF Candle 3 open is ABOVE HTF Candle 1 close to ensure a valid vertical span
- Block vertical span: Candle 1 close (low) to Candle 3 open (high)
- Block remains valid until price CLOSES below the block low (Candle 1 close)
Bearish Suspension Block logic (mirror conditions):
- HTF Candle 1 close is ABOVE HTF Candle 2 open by at least Minimum Body Separation
- HTF Candle 3 open is BELOW HTF Candle 2 close by at least Minimum Body Separation
- HTF Candle 3 open is BELOW HTF Candle 1 close to ensure a valid vertical span
- Block vertical span: Candle 1 close (high) to Candle 3 open (low)
- Block remains valid until price CLOSES above the block high (Candle 1 close)
All gap calculations are normalized using `syminfo.mintick` so the “ticks” setting behaves correctly across instruments.
-----------------------------------------------------------------------------------------------
GENERAL SETTINGS
-----------------------------------------------------------------------------------------------
- Minimum Body Separation (ticks)
- Minimum required body-to-body gap in HTF tick units
- Used for both:
- Candle 1 close to Candle 2 open separation
- Candle 2 close to Candle 3 open separation
- Examples:
- 0.25 = quarter-tick gap
- 1.0 = full tick gap
-----------------------------------------------------------------------------------------------
TIMEFRAMES
-----------------------------------------------------------------------------------------------
This script supports up to 3 higher timeframe sources. Each HTF has:
- Enable toggle
- Timeframe selector
- Per-timeframe Max Blocks visibility control
HTF 1 / HTF 2 / HTF 3:
- These are the timeframes the script scans for Suspension Blocks
- Blocks are drawn only when your current chart timeframe is LOWER than the selected HTF
- This prevents duplicate / redundant rendering when you’re already on the HTF or higher
Max Blocks per timeframe:
- Limits the number of most-recent blocks shown per side (bullish + bearish) for that HTF
- 0 = show all blocks for that timeframe
-----------------------------------------------------------------------------------------------
VISUALIZATION SETTINGS
-----------------------------------------------------------------------------------------------
Bullish Blocks:
- Toggle visibility
- Fill color controls opacity / emphasis
- Optional border with selectable style (Solid / Dashed / Dotted)
Bearish Blocks:
- Toggle visibility
- Fill color controls opacity / emphasis
- Optional border with selectable style (Solid / Dashed / Dotted)
Consequent Encroachment (CE):
- Optional 50% equilibrium line drawn inside each block
- Style options (Solid / Dashed / Dotted)
- Automatically extends as blocks extend
HTF Labels:
- Each block is labeled with its originating timeframe (ex: M5 / M15 / M60)
- Label styling includes:
- Text color
- Size (Tiny / Small / Normal / Large)
- Labels are intentionally hidden on non-visible blocks when visibility limiting is active
-----------------------------------------------------------------------------------------------
HOW HTF PROJECTION WORKS
-----------------------------------------------------------------------------------------------
- The script requests the last 3 candles of each selected HTF via `request.security()`
- It maps those HTF candles into the standard 3-candle Suspension Block model:
- Candle 1 = oldest
- Candle 2 = middle
- Candle 3 = most recent
- When a valid block forms:
- A box is created using `xloc.bar_time`
- The left side anchors to the HTF candle timestamp
- The right side projects forward to the current chart time
- Each HTF has its own independent storage set:
- Bull boxes, bear boxes
- High / low bounds
- CE lines
- Labels
-----------------------------------------------------------------------------------------------
BLOCK MANAGEMENT & INVALIDATION
-----------------------------------------------------------------------------------------------
- All blocks extend forward automatically to the current bar time
- Bullish invalidation:
- Block is removed when price CLOSES below the block low
- Bearish invalidation:
- Block is removed when price CLOSES above the block high
- When a block invalidates:
- The box is deleted
- Its CE line is deleted
- All stored references are removed from the set
This keeps the chart focused on active HTF zones only.
-----------------------------------------------------------------------------------------------
VISIBILITY LIMITING
-----------------------------------------------------------------------------------------------
Each timeframe’s “Max Blocks” setting controls how many blocks per side remain visible.
When Max Blocks > 0:
- The script calculates distance from current price to every stored block range
- It keeps the closest N blocks per side (bullish + bearish)
- Blocks not kept are made fully transparent:
- Hidden fill
- Hidden border
- Hidden CE line
- Hidden label text
This gives you the most relevant HTF structures near price without clutter.
-----------------------------------------------------------------------------------------------
ALERT SYSTEM
-----------------------------------------------------------------------------------------------
Alerts are optional and can be restricted to specific NY sessions.
Sessions (New York time):
- Session 1 (default: 09:30–16:00)
- Session 2 (optional)
- Session 3 (optional)
Alert types:
- HTF Bullish Block Formed
- Triggers when any enabled HTF forms a new bullish suspension block
- HTF Bearish Block Formed
- Triggers when any enabled HTF forms a new bearish suspension block
- Enter Bullish Block
- Triggers when price transitions from NOT inside any bullish HTF block to inside one
- Enter Bearish Block
- Triggers when price transitions from NOT inside any bearish HTF block to inside one
Messages:
- Fully customizable alert text inputs
- Script automatically appends ticker + current chart timeframe for context
-----------------------------------------------------------------------------------------------
BEST USE CASES
-----------------------------------------------------------------------------------------------
- Use HTF Suspension Blocks as “context zones” while executing on a lower timeframe
- Pair with ICT displacement, liquidity, PD arrays, and market structure for confluence
- Treat blocks as HTF inefficiency zones that can act as reaction points on retracements
- Use “enter block” alerts as a heads-up to shift into execution mode at HTF levels
-----------------------------------------------------------------------------------------------
DISCLAIMER
-----------------------------------------------------------------------------------------------
This indicator is provided for educational and analytical purposes only. It does not constitute financial advice. Trading involves risk, and past performance is not indicative of future results.
© TakingProphets
-----------------------------------------------------------------------------------------------
Suspension Blocks [TakingProphets]-----------------------------------------------------------------------------------------------
SUSPENSION BLOCKS
-----------------------------------------------------------------------------------------------
Suspension Blocks are a new ICT concept designed to highlight price inefficiencies created by displacement and body-to-body gaps across a precise 3-candle sequence. These structures represent areas where price was temporarily “suspended” before continuation, often acting as high-probability reaction zones on future revisits.
This indicator automatically detects, visualizes, manages, and invalidates Suspension Blocks in real time, while intelligently limiting chart clutter to only the most relevant structures near current price.
-----------------------------------------------------------------------------------------------
PURPOSE AND SCOPE
-----------------------------------------------------------------------------------------------
- Detect ICT-style Bullish and Bearish Suspension Blocks using strict 3-candle body relationships
- Require measurable body-to-body separation defined in true ticks (instrument-aware)
- Automatically draw and extend Suspension Blocks forward in time
- Invalidate blocks only when price decisively closes beyond the defining boundary
- Optionally display Consequent Encroachment (50% equilibrium) within each block
- Limit on-chart visibility to the closest N blocks per side relative to current price
- Provide session-based, directional alerting for new block formations
-----------------------------------------------------------------------------------------------
WHAT IS A SUSPENSION BLOCK
-----------------------------------------------------------------------------------------------
A Suspension Block is a 3-candle displacement pattern defined by body gaps on both sides of a middle candle.
Bullish Suspension Block logic:
- Candle 1 close is BELOW Candle 2 open by at least the Minimum Body Separation
- Candle 3 open is ABOVE Candle 2 close by at least the Minimum Body Separation
- Candle 3 open is ABOVE Candle 1 close to ensure a valid vertical range
- The block spans from Candle 1 close (low) to Candle 3 open (high)
- The block remains valid until price CLOSES below Candle 1 close
Bearish Suspension Block logic (mirror conditions):
- Candle 1 close is ABOVE Candle 2 open by at least the Minimum Body Separation
- Candle 3 open is BELOW Candle 2 close by at least the Minimum Body Separation
- Candle 3 open is BELOW Candle 1 close to ensure a valid vertical range
- The block spans from Candle 1 close (high) to Candle 3 open (low)
- The block remains valid until price CLOSES above Candle 1 close
All calculations are performed using true tick values via `syminfo.mintick` to ensure precision across instruments.
-----------------------------------------------------------------------------------------------
GENERAL SETTINGS
-----------------------------------------------------------------------------------------------
- Minimum Body Separation (ticks)
- Defines the minimum required body-to-body gap between candles
- Measured in true ticks (0.25 = quarter tick, 1.0 = full tick, etc.)
- Max Visible Blocks per Side
- Limits the number of bullish and bearish blocks displayed
- Only the closest blocks to current price remain visible
-----------------------------------------------------------------------------------------------
VISUALIZATION SETTINGS
-----------------------------------------------------------------------------------------------
- Bullish Suspension Blocks
- Toggle bullish block visibility
- Custom fill color with adjustable transparency
- Optional border with selectable line style (Solid / Dashed / Dotted)
- Bearish Suspension Blocks
- Toggle bearish block visibility
- Custom fill color with adjustable transparency
- Optional border with selectable line style (Solid / Dashed / Dotted)
- Consequent Encroachment (CE)
- Optional 50% equilibrium line drawn inside each block
- Custom color and line style
- Automatically extends with the block
Blocks dynamically extend to the current bar and are hidden or shown based on proximity to price to keep the chart clean and actionable.
-----------------------------------------------------------------------------------------------
BLOCK MANAGEMENT & INVALIDATION
-----------------------------------------------------------------------------------------------
- Each block is stored persistently and extended forward bar-by-bar
- Bullish blocks are invalidated only when price CLOSES below the block low
- Bearish blocks are invalidated only when price CLOSES above the block high
- Invalidated blocks and their CE lines are automatically removed
- Visibility logic ensures only the most relevant structures are emphasized
-----------------------------------------------------------------------------------------------
ALERT SYSTEM
-----------------------------------------------------------------------------------------------
- Optional alerts when new Suspension Blocks form
- Independent toggles for bullish and bearish alerts
- Fully customizable alert messages
- Alerts can be restricted to specific trading sessions:
- Session 1 (default: 09:30–16:00 NY)
- Session 2 (optional)
- Session 3 (optional)
- Alerts include ticker and timeframe context automatically
-----------------------------------------------------------------------------------------------
BEST USE CASES
-----------------------------------------------------------------------------------------------
- High-probability reaction zones after displacement
- Confluence with liquidity, PD arrays, and market structure
- Execution refinement within ICT-based models
- Intraday and higher-timeframe contextual bias
- Clean, rules-based identification of inefficiency zones
-----------------------------------------------------------------------------------------------
DISCLAIMER
-----------------------------------------------------------------------------------------------
This indicator is provided for educational and analytical purposes only. It does not constitute financial advice. Trading involves risk, and past performance is not indicative of future results.
© TakingProphets
-----------------------------------------------------------------------------------------------

Impulse %Impulse % — Liquidation Cascade Detector (BTC · 1H)
Impulse % identifies sharp impulsive price moves and liquidation cascades by measuring how much a candle’s range deviates from its historical average in percent.
How it works
Calculates the candle range (in %) relative to price and compares it to the average over N periods.
When the range exceeds the upper band, an Impulse is detected.
Inside each 1H candle, the indicator checks lower timeframes (1m / 5m) to classify the impulse phases:
PANIC — the first minutes of a violent move (forced liquidations, stop hunts).
CAUTION (Cascade) — continuation and “cleanup” phase with elevated risk.
Determines whether the impulse is against the trend using EMA 50 / EMA 200 — the most dangerous scenario.
Highlights risk zones to protect positions and filter new entries.
What it’s for
Avoid entering during liquidation cascades.
Exit at break-even or partially take profit during risky phases.
Recommended Settings — BTC (1H)
Calculation
Calculation TF: (empty = current)
Average Mode: By N bars
N (bars): 100
Range Type: High–Low
Bands
Upper Band (% of average): 130
Lower Band: Auto (same %)
Cascade (First Minutes)
Enable Cascade Filter: ON
When to trigger safety: Only against trend
PANIC (minutes): 3
CAUTION (minutes after PANIC): 15
Trend (EMA)
Use EMA Trend: ON
Fast EMA: 50
Slow EMA: 200
Lower TF Detection
Lower TF: 1m (or 5m if you prefer smoother signals)
Visualization
Style: Columns
Show Bands: ON
Show Band Lines & Mean: ON
How to read it (BTC · 1H)
Purple (PANIC): first minutes of liquidation — do not enter.
Yellow (CAUTION): cascade phase — high risk, manage/exit.
Normal color: no active cascade — strategy allowed.
Best practice:
1m/5m → real-time cascade detection
1H → decision level
4H → market context

Neosha Concept V4 (NY Time)
Imagine the financial market as a huge ocean. Millions of traders throw orders into it every second. But beneath all the noise, there is a powerful current that quietly controls where the waves move. That current is not a person, not a trader, and not random—it is an algorithm.
This algorithm is called the Interbank Price Delivery Algorithm (IPDA).
Think of it as the “navigation system” that guides price through the market.
IPDA has one job:
to move prices in a way that keeps the market efficient and liquid.
To do this, it constantly looks for two things:
1. Where liquidity is hiding
Liquidity is usually found above highs and below lows—where traders place stop losses. The algorithm moves price there first to collect that liquidity.
2. Where price became unbalanced
Sometimes price moves too fast and creates gaps or imbalances. IPDA returns to those areas later to “fix” the missing orders.
Once you start looking at the charts with this idea in mind, everything makes more sense:
Why price suddenly spikes above a high and crashes down
Why big moves leave gaps that price later fills
Why the market reverses right after taking stops
Why trends begin only after certain levels are hit
These are not accidents.
They are the algorithm doing its job.
Price moves in a repeating cycle:
Gather liquidity
Make a strong move (displacement)
Return to fix inefficiency
Deliver to the next target
Most beginners only see the candles.
But once you understand IPDA, you see the intention behind the candles.
Instead of guessing where price might go, you begin to understand why it moves there.
And once you understand the “why,” your trading becomes clearer, calmer, and far more accurate.

IFVG Pro v.1Detects IFVGs in real time.
Includes alerts for specific timeframes.
This is my first indicator so I will be continually working on it to make it better and more accurate. Thanks for trying it out!

Apex IndicatorThe Apex Indicator is a physics-based momentum tool designed to measure the 2nd Derivative (Acceleration) of both Price and Volume.
Unlike standard oscillators which often lag, this indicator uses Kinematics to identify the subtle shifts in momentum before price makes a major move. It answers the critical questions: Is the selling pressure fading? and Is there fresh fuel (Volume) entering to support a turn?
This script uses Hull Moving Average (HMA) smoothing for low-latency calculation, and Z-Score Normalization to force Price and Volume onto a shared, readable scale.
Visual Guide
The Histogram (Price Acceleration)
Bright Green: Strong Bullish Acceleration (High Velocity).
Dark Green: Developing Bullish Momentum (or Waning Bullishness depending on context).
Bright Red: Strong Bearish Acceleration (Panic/Dump).
Dark Red: Developing Bearish Momentum (or Waning Bearishness).
The Line (Volume Acceleration)
Yellow: Volume is accelerating (Interest is entering).
Purple: Volume is decelerating (Interest is leaving).
The Background Highlights
Green/Red Background: These mark Statistical Extremes (>1 Standard Deviation). While these show maximum power, they often mark the climax of a move rather than the start.
How to Trade: Reading the Subtleties
The power of the Apex Indicator is not in chasing the spikes, but in reading the Transitions.
1. The Turn (The Reversal Entry)
Don't wait for the explosion; look for the "braking" action.
The Setup: Price has been moving down strongly (Bright Red bars).
The Signal: The histogram shifts to Dark Red and begins moving up toward the zero line (less negative). This means the selling acceleration is dying.
The Trigger: A Dark Green bar prints, accompanied by the Volume Line turning Yellow/Rising.
Why it works: You are entering when the bearish energy is exhausted and fresh volume is stepping in to lift the price, often before the main breakout occurs.
2. The Second Wind (Trend Continuation)
The Setup: You are already in a trend (Green bars), but the bars fade to Dark Green or near Zero (a pullback or pause).
The Trigger: The next bar flips Bright Green and the Volume Line spikes Yellow.
Why it works: This confirms that the pause was just a breather, and buyers are stepping back on the gas.
3. The "Hollow Move" (Trap Avoidance)
The Scenario: Price is moving up (Green bars), but the Volume Line is Purple or dropping.
Interpretation: This is a drift, not a drive. Without volume acceleration support, these moves are prone to rapid reversal.
4. The Climax (Exits)
If the Background flashes Green (Alert Trigger), be aware that price acceleration has hit a statistical extreme (Z-Score > 1).
If you are in a position, this is often a good place to Take Profit, as maintaining that level of acceleration is mathematically difficult for the market to sustain.
Settings
Analysis Length (21): The lookback period for the HMA smoothing.
Normalization Lookback (21): The historical window used to calculate the Z-Score. A setting of 21 allows the indicator to self-adjust quickly to recent volatility conditions.

Smart Money Concepts [MHA Finverse]A comprehensive Smart Money Concepts (SMC) indicator designed to identify institutional trading behavior and market structure shifts. This tool helps traders align with "smart money" by detecting key supply and demand zones, structural breaks, and liquidity patterns.
Core Features
Market Structure Analysis
- Real-time Internal Structure: Detects short-term BOS (Break of Structure) and CHoCH (Change of Character) with customizable filters
- Swing Structure: Identifies major trend shifts and structural breaks on higher timeframes
- Adjustable pivot detection with customizable swing point visualization
- Strong/Weak High/Low identification for bias confirmation
Order Blocks (OB)
- Internal and Swing Order Blocks with independent control
- Volume-based metrics showing OB strength and percentage contribution
- Two filtering methods: ATR-based and Cumulative Mean Range
- Flexible mitigation options (Close or High/Low)
- Display up to 20 order blocks per type with auto-cleanup on mitigation
- Color-coded zones with transparency control
Liquidity Detection
- Equal Highs (EQH) and Equal Lows (EQL) identification
- Threshold-based detection using ATR calculation
- Visual confirmation lines connecting equal levels
- Adjustable sensitivity and bar confirmation settings
Fair Value Gaps (FVG)
- Multi-timeframe FVG detection
- Auto-threshold calculation based on price momentum
- Bullish and Bearish gap visualization
- Extendable gap boxes for tracking unfilled imbalances
Premium & Discount Zones
- Automated premium, equilibrium, and discount zone plotting
- Based on current swing range extremes
- Visual representation of optimal entry zones
- Helps identify potential reversal and continuation areas
Multi-Timeframe Levels
- Previous Daily, Weekly, and Monthly High/Low levels
- Customizable line styles (solid, dashed, dotted)
- Independent color controls for each timeframe
- Auto-adjusted labels (PDH, PDL, PWH, PWL, PMH, PML)
Display Modes
- Historical Mode: Shows all past structures and maintains drawing history
- Present Mode: Displays only current active structures for cleaner charts
Visual Themes
- Colored: Full color customization for all elements
- Monochrome: Clean grey-scale design for minimal distraction
Smart Features
- Confluence filter for internal structure to reduce noise
- Automatic candle coloring based on market bias
- 16 pre-configured alert conditions for all major signals
- Efficient rendering with automatic cleanup of broken structures
- Independent control over each feature for modular usage
Use Cases
- Identify institutional entry and exit points through order blocks
- Spot potential reversals at premium/discount zones
- Confirm trend direction with BOS and CHoCH signals
- Find liquidity grabs at equal highs and lows
- Trade imbalances at fair value gaps
- Align entries with multi-timeframe key levels
Settings Organization
All features are neatly organized into logical groups:
- Smart Money Concepts (general settings)
- Real Time Internal Structure
- Real Time Swing Structure
- Order Blocks
- EQH/EQL
- Fair Value Gaps
- Highs & Lows MTF
- Premium & Discount Zones
Note: This indicator works on all timeframes and instruments. For optimal results, combine multiple SMC concepts together to find high-probability setups with confluence.
Credits
Special thanks to Dau_tu_hieu_goc and BigBeluga for their code examples and inspiration that contributed to the development of this indicator.
Disclaimer
This indicator is for educational purposes only and does not constitute financial advice. Trading involves substantial risk of loss. Past performance does not guarantee future results. Always use proper risk management and conduct your own analysis before making trading decisions. The developer is not responsible for any trading losses incurred.
Happy Trading


MTF Alignment & Key Levelsso this one is specifically for the 1hr and 4hr time frame. but what it does is alert you once the monthly weekly and daily timeframes align with a trend in a certain direction wether its bearish or bullish but then it will mark out key levels on the 1hr and 4hr time frame to indicate when price breaks through that level to enter a trade in the direction of the higher timeframes alignment.

XAUUSD 1m SMC Zones (BOS + Flexible TP Modes + Trailing Runner)//@version=6
strategy("XAUUSD 1m SMC Zones (BOS + Flexible TP Modes + Trailing Runner)",
overlay = true,
initial_capital = 10000,
pyramiding = 10,
process_orders_on_close = true)
//━━━━━━━━━━━━━━━━━━━
// 1. INPUTS
//━━━━━━━━━━━━━━━━━━━
// TP / SL
tp1Pips = input.int(10, "TP1 (pips)", minval = 1)
fixedSLpips = input.int(50, "Fixed SL (pips)", minval = 5)
runnerRR = input.float(3.0, "Runner RR (TP2 = SL * RR)", step = 0.1, minval = 1.0)
// Daily risk
maxDailyLossPct = input.float(5.0, "Max daily loss % (stop trading)", step = 0.5)
maxDailyProfitPct = input.float(20.0, "Max daily profit % (stop trading)", step = 1.0)
// HTF S/R (1H)
htfTF = input.string("60", "HTF timeframe (minutes) for S/R block")
// Profit strategy (Option C)
profitStrategy = input.string("Minimal Risk | Full BE after TP1", "Profit Strategy", options = )
// Runner stop mode (your option 4)
runnerStopMode = input.string( "BE only", "Runner Stop Mode", options = )
// ATR trail settings (only used if ATR mode selected)
atrTrailLen = input.int(14, "ATR Length (trail)", minval = 1)
atrTrailMult = input.float(1.0, "ATR Multiplier (trail)", step = 0.1, minval = 0.1)
// Pip size (for XAUUSD: 1 pip = 0.10 if tick = 0.01)
pipSize = syminfo.mintick * 10.0
tp1Points = tp1Pips * pipSize
slPoints = fixedSLpips * pipSize
baseQty = input.float (1.0, "Base order size" , step = 0.01, minval = 0.01)
//━━━━━━━━━━━━━━━━━━━
// 2. DAILY RISK MANAGEMENT
//━━━━━━━━━━━━━━━━━━━
isNewDay = ta.change(time("D")) != 0
var float dayStartEquity = na
var bool dailyStopped = false
equityNow = strategy.initial_capital + strategy.netprofit
if isNewDay or na(dayStartEquity)
dayStartEquity := equityNow
dailyStopped := false
dailyPnL = equityNow - dayStartEquity
dailyPnLPct = dayStartEquity != 0 ? (dailyPnL / dayStartEquity) * 100.0 : 0.0
if not dailyStopped
if dailyPnLPct <= -maxDailyLossPct
dailyStopped := true
if dailyPnLPct >= maxDailyProfitPct
dailyStopped := true
canTradeToday = not dailyStopped
//━━━━━━━━━━━━━━━━━━━
// 3. 1H S/R ZONES (for direction block)
//━━━━━━━━━━━━━━━━━━━
htOpen = request.security(syminfo.tickerid, htfTF, open)
htHigh = request.security(syminfo.tickerid, htfTF, high)
htLow = request.security(syminfo.tickerid, htfTF, low)
htClose = request.security(syminfo.tickerid, htfTF, close)
// Engulf logic on HTF
htBullPrev = htClose > htOpen
htBearPrev = htClose < htOpen
htBearEngulf = htClose < htOpen and htBullPrev and htOpen >= htClose and htClose <= htOpen
htBullEngulf = htClose > htOpen and htBearPrev and htOpen <= htClose and htClose >= htOpen
// Liquidity sweep on HTF previous candle
htSweepHigh = htHigh > ta.highest(htHigh, 5)
htSweepLow = htLow < ta.lowest(htLow, 5)
// Store last HTF zones
var float htResHigh = na
var float htResLow = na
var float htSupHigh = na
var float htSupLow = na
if htBearEngulf and htSweepHigh
htResHigh := htHigh
htResLow := htLow
if htBullEngulf and htSweepLow
htSupHigh := htHigh
htSupLow := htLow
// Are we inside HTF zones?
inHtfRes = not na(htResHigh) and close <= htResHigh and close >= htResLow
inHtfSup = not na(htSupLow) and close >= htSupLow and close <= htSupHigh
// Block direction against HTF zones
longBlockedByZone = inHtfRes // no buys in HTF resistance
shortBlockedByZone = inHtfSup // no sells in HTF support
//━━━━━━━━━━━━━━━━━━━
// 4. 1m LOCAL ZONES (LIQUIDITY SWEEP + ENGULF + QUALITY SCORE)
//━━━━━━━━━━━━━━━━━━━
// 1m engulf patterns
bullPrev1 = close > open
bearPrev1 = close < open
bearEngulfNow = close < open and bullPrev1 and open >= close and close <= open
bullEngulfNow = close > open and bearPrev1 and open <= close and close >= open
// Liquidity sweep by previous candle on 1m
sweepHighPrev = high > ta.highest(high, 5)
sweepLowPrev = low < ta.lowest(low, 5)
// Local zone storage (one active support + one active resistance)
// Quality score: 1 = engulf only, 2 = engulf + sweep (we only trade ≥2)
var float supLow = na
var float supHigh = na
var int supQ = 0
var bool supUsed = false
var float resLow = na
var float resHigh = na
var int resQ = 0
var bool resUsed = false
// New resistance zone: previous bullish candle -> bear engulf
if bearEngulfNow
resLow := low
resHigh := high
resQ := sweepHighPrev ? 2 : 1
resUsed := false
// New support zone: previous bearish candle -> bull engulf
if bullEngulfNow
supLow := low
supHigh := high
supQ := sweepLowPrev ? 2 : 1
supUsed := false
// Raw "inside zone" detection
inSupRaw = not na(supLow) and close >= supLow and close <= supHigh
inResRaw = not na(resHigh) and close <= resHigh and close >= resLow
// QUALITY FILTER: only trade zones with quality ≥ 2 (engulf + sweep)
highQualitySup = supQ >= 2
highQualityRes = resQ >= 2
inSupZone = inSupRaw and highQualitySup and not supUsed
inResZone = inResRaw and highQualityRes and not resUsed
// Plot zones
plot(supLow, "Sup Low", color = color.new(color.lime, 60), style = plot.style_linebr)
plot(supHigh, "Sup High", color = color.new(color.lime, 60), style = plot.style_linebr)
plot(resLow, "Res Low", color = color.new(color.red, 60), style = plot.style_linebr)
plot(resHigh, "Res High", color = color.new(color.red, 60), style = plot.style_linebr)
//━━━━━━━━━━━━━━━━━━━
// 5. MODERATE BOS (3-BAR FRACTAL STRUCTURE)
//━━━━━━━━━━━━━━━━━━━
// 3-bar swing highs/lows
swHigh = high > high and high > high
swLow = low < low and low < low
var float lastSwingHigh = na
var float lastSwingLow = na
if swHigh
lastSwingHigh := high
if swLow
lastSwingLow := low
// BOS conditions
bosUp = not na(lastSwingHigh) and close > lastSwingHigh
bosDown = not na(lastSwingLow) and close < lastSwingLow
// Zone “arming” and BOS validation
var bool supArmed = false
var bool resArmed = false
var bool supBosOK = false
var bool resBosOK = false
// Arm zones when first touched
if inSupZone
supArmed := true
if inResZone
resArmed := true
// BOS after arming → zone becomes valid for entries
if supArmed and bosUp
supBosOK := true
if resArmed and bosDown
resBosOK := true
// Reset BOS flags when new zones are created
if bullEngulfNow
supArmed := false
supBosOK := false
if bearEngulfNow
resArmed := false
resBosOK := false
//━━━━━━━━━━━━━━━━━━━
// 6. ENTRY CONDITIONS (ZONE + BOS + RISK STATE)
//━━━━━━━━━━━━━━━━━━━
flatOrShort = strategy.position_size <= 0
flatOrLong = strategy.position_size >= 0
longSignal = canTradeToday and not longBlockedByZone and inSupZone and supBosOK and flatOrShort
shortSignal = canTradeToday and not shortBlockedByZone and inResZone and resBosOK and flatOrLong
//━━━━━━━━━━━━━━━━━━━
// 7. ORDER LOGIC – TWO PROFIT STRATEGIES
//━━━━━━━━━━━━━━━━━━━
// Common metrics
atrTrail = ta.atr(atrTrailLen)
// MINIMAL MODE: single trade, BE after TP1, optional trailing
// HYBRID MODE: two trades (Scalp @ TP1, Runner @ TP2)
// Persistent tracking
var float longEntry = na
var float longTP1 = na
var float longTP2 = na
var float longSL = na
var bool longBE = false
var float longRunEntry = na
var float longRunTP1 = na
var float longRunTP2 = na
var float longRunSL = na
var bool longRunBE = false
var float shortEntry = na
var float shortTP1 = na
var float shortTP2 = na
var float shortSL = na
var bool shortBE = false
var float shortRunEntry = na
var float shortRunTP1 = na
var float shortRunTP2 = na
var float shortRunSL = na
var bool shortRunBE = false
isMinimal = profitStrategy == "Minimal Risk | Full BE after TP1"
isHybrid = profitStrategy == "Hybrid | Scalp TP + Runner TP"
//━━━━━━━━━━ LONG ENTRIES ━━━━━━━━━━
if longSignal
if isMinimal
longEntry := close
longSL := longEntry - slPoints
longTP1 := longEntry + tp1Points
longTP2 := longEntry + slPoints * runnerRR
longBE := false
strategy.entry("Long", strategy.long)
supUsed := true
supArmed := false
supBosOK := false
else if isHybrid
longRunEntry := close
longRunSL := longRunEntry - slPoints
longRunTP1 := longRunEntry + tp1Points
longRunTP2 := longRunEntry + slPoints * runnerRR
longRunBE := false
// Two separate entries, each 50% of baseQty (for backtest)
strategy.entry("LongScalp", strategy.long, qty = baseQty * 0.5)
strategy.entry("LongRun", strategy.long, qty = baseQty * 0.5)
supUsed := true
supArmed := false
supBosOK := false
//━━━━━━━━━━ SHORT ENTRIES ━━━━━━━━━━
if shortSignal
if isMinimal
shortEntry := close
shortSL := shortEntry + slPoints
shortTP1 := shortEntry - tp1Points
shortTP2 := shortEntry - slPoints * runnerRR
shortBE := false
strategy.entry("Short", strategy.short)
resUsed := true
resArmed := false
resBosOK := false
else if isHybrid
shortRunEntry := close
shortRunSL := shortRunEntry + slPoints
shortRunTP1 := shortRunEntry - tp1Points
shortRunTP2 := shortRunEntry - slPoints * runnerRR
shortRunBE := false
strategy.entry("ShortScalp", strategy.short, qty = baseQty * 50)
strategy.entry("ShortRun", strategy.short, qty = baseQty * 50)
resUsed := true
resArmed := false
resBosOK := false
//━━━━━━━━━━━━━━━━━━━
// 8. EXIT LOGIC – MINIMAL MODE
//━━━━━━━━━━━━━━━━━━━
// LONG – Minimal Risk: 1 trade, BE after TP1, runner to TP2
if isMinimal and strategy.position_size > 0 and not na(longEntry)
// Move to BE once TP1 is touched
if not longBE and high >= longTP1
longBE := true
// Base SL: BE or initial SL
float dynLongSL = longBE ? longEntry : longSL
// Optional trailing after BE
if longBE
if runnerStopMode == "Structure trail" and not na(lastSwingLow) and lastSwingLow > longEntry
dynLongSL := math.max(dynLongSL, lastSwingLow)
if runnerStopMode == "ATR trail"
trailSL = close - atrTrailMult * atrTrail
dynLongSL := math.max(dynLongSL, trailSL)
strategy.exit("Long Exit", "Long", stop = dynLongSL, limit = longTP2)
// SHORT – Minimal Risk: 1 trade, BE after TP1, runner to TP2
if isMinimal and strategy.position_size < 0 and not na(shortEntry)
if not shortBE and low <= shortTP1
shortBE := true
float dynShortSL = shortBE ? shortEntry : shortSL
if shortBE
if runnerStopMode == "Structure trail" and not na(lastSwingHigh) and lastSwingHigh < shortEntry
dynShortSL := math.min(dynShortSL, lastSwingHigh)
if runnerStopMode == "ATR trail"
trailSLs = close + atrTrailMult * atrTrail
dynShortSL := math.min(dynShortSL, trailSLs)
strategy.exit("Short Exit", "Short", stop = dynShortSL, limit = shortTP2)
//━━━━━━━━━━━━━━━━━━━
// 9. EXIT LOGIC – HYBRID MODE
//━━━━━━━━━━━━━━━━━━━
// LONG – Hybrid: Scalp + Runner
if isHybrid
// Scalp leg: full TP at TP1
if strategy.opentrades > 0
strategy.exit("LScalp TP", "LongScalp", stop = longRunSL, limit = longRunTP1)
// Runner leg
if strategy.position_size > 0 and not na(longRunEntry)
if not longRunBE and high >= longRunTP1
longRunBE := true
float dynLongRunSL = longRunBE ? longRunEntry : longRunSL
if longRunBE
if runnerStopMode == "Structure trail" and not na(lastSwingLow) and lastSwingLow > longRunEntry
dynLongRunSL := math.max(dynLongRunSL, lastSwingLow)
if runnerStopMode == "ATR trail"
trailRunSL = close - atrTrailMult * atrTrail
dynLongRunSL := math.max(dynLongRunSL, trailRunSL)
strategy.exit("LRun TP", "LongRun", stop = dynLongRunSL, limit = longRunTP2)
// SHORT – Hybrid: Scalp + Runner
if isHybrid
if strategy.opentrades > 0
strategy.exit("SScalp TP", "ShortScalp", stop = shortRunSL, limit = shortRunTP1)
if strategy.position_size < 0 and not na(shortRunEntry)
if not shortRunBE and low <= shortRunTP1
shortRunBE := true
float dynShortRunSL = shortRunBE ? shortRunEntry : shortRunSL
if shortRunBE
if runnerStopMode == "Structure trail" and not na(lastSwingHigh) and lastSwingHigh < shortRunEntry
dynShortRunSL := math.min(dynShortRunSL, lastSwingHigh)
if runnerStopMode == "ATR trail"
trailRunSLs = close + atrTrailMult * atrTrail
dynShortRunSL := math.min(dynShortRunSL, trailRunSLs)
strategy.exit("SRun TP", "ShortRun", stop = dynShortRunSL, limit = shortRunTP2)
//━━━━━━━━━━━━━━━━━━━
// 10. RESET STATE WHEN FLAT
//━━━━━━━━━━━━━━━━━━━
if strategy.position_size == 0
longEntry := na
shortEntry := na
longBE := false
shortBE := false
longRunEntry := na
shortRunEntry := na
longRunBE := false
shortRunBE := false
//━━━━━━━━━━━━━━━━━━━
// 11. VISUAL ENTRY MARKERS
//━━━━━━━━━━━━━━━━━━━
plotshape(longSignal, title = "Long Signal", style = shape.triangleup,
location = location.belowbar, color = color.lime, size = size.tiny, text = "L")
plotshape(shortSignal, title = "Short Signal", style = shape.triangledown,
location = location.abovebar, color = color.red, size = size.tiny, text = "S")


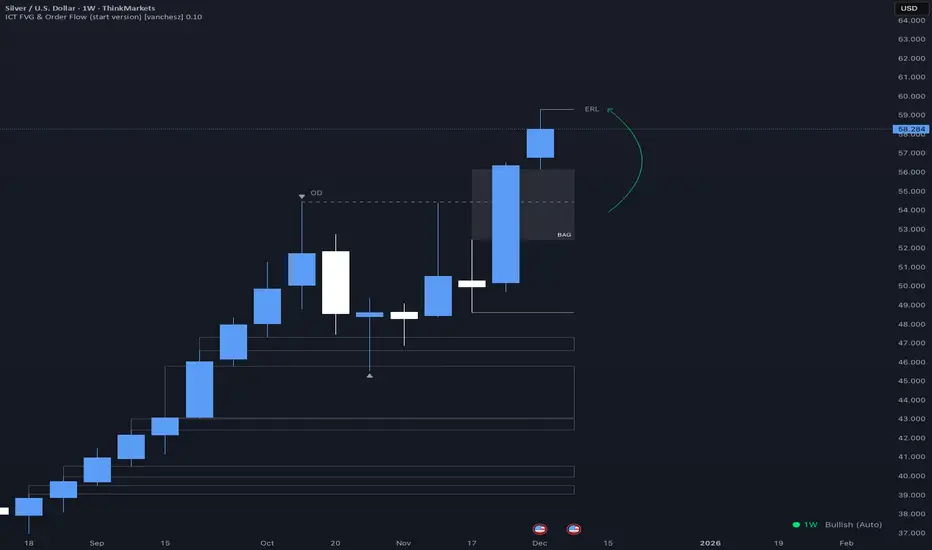
ICT FVG & Order Flow (start version) [vanchesz]Overview
Master liquidity with precision. This indicator brings the iCT trading concept to life by automatically detecting liquidity pools, fair value gaps, and key swing points. It shows you exactly where price is likely to move next — from Internal Range Liquidity (IRL) to External Range Liquidity (ERL). With built-in multi-timeframe validation, it helps you stay one step ahead of the market.
Concept
Markets move where liquidity is. According to iCT theory, price usually sweeps internal liquidity (IRL) first and then hunts for external liquidity (ERL). By mapping this process in real time, the indicator provides a clear framework for understanding market structure, liquidity grabs, and directional bias.
High Probability Leg
Context States
Key Features
Detects the High-Probability Leg (HPL) — the leg containing a fair value gap (FVG)
Highlights unmitigated FVGs within the current context.
Marks swing points (SP), IRL levels, and ERL targets automatically.
Identifies IRL rejections when liquidity is taken inside the leg
Multi-timeframe sweep check – if a single candle takes both IRL and ERL, the indicator zooms into a lower timeframe to confirm which liquidity was swept first
Flexible settings for swing points, look back bar count, depth, colors, and style
How to use
Start from the monthly chart to define the macro trend.
Analyze the latest order flow leg:
Bullish FVG = bullish context, Bearish FVG = bearish context
Step down to the daily timeframe and repeat the analysis.
Wait for price to reject from IRL (the indicator highlights it automatically).
Drop to a lower timeframe for entries — use timeframe alignment to select the right LTF.
Enter with the FVG model, targeting liquidity within the leg.
Place take profit inside the context — e.g., never above ERL(in a bullish setup).
Pro version gives you
Alerts for all context events (New context, New FVG, IRL rejection, Context failing by 2CR, ERL/SP sweep
Check of context failing by 2CR (two candle rejection)
Suggestions for every context state
This indicator is provided solely for educational and informational purposes.
It does not constitute financial advice, trading signals, or a recommendation to buy or sell any instrument.
Ashok 07 Dec 25 updated scriptTried to fix the bugs in previous script. Even now improvements are needed, but for now it looks reasonably profiting.

