Previous Day/Week High & Low + 50% w/ Alerts| by Octopu$
📈 Previous Day/Week High & Low + 50% w/ Alerts| by Octopu$
This Indicator includes Previous Day High and Low Levels and 50% (Half of High & Low)
As well as Previous Week High and Low Levels ((Half of High & Low))
And also Pre-Market Session High and Low.
All of them with Built-in alerts.
Can be used in any timeframe with any ticker.
(Using SPY 5m just as an example:)
www.tradingview.com
SPY
Features:
• D High: Green Top Line
• D Low: Red Bottom Line
• D 50%: White 50% Line
• Week High and Low: Blue Top and Bottom Lines
• Pre-Market and Afterhours Session: Gray Lines
• Labels for Identification
Options:
• Toggle on/off for Day High, Low and 50%
• Toggle on/off for DWeek High, Low and 50%
• Toggle on/off for PM and AH Sessions
• Show/Hide the Labels with names
• Show/Hide the Lines themselves
• Fully Customizable Style and Color
Alerts:
• Triggers for Day (above or below level)
• Triggers for Week (above or below level)
Notes:
v1.0
Release of the Indicator
Changes and updates can come in the future for additional functionalities or per requests.
Did you like it? Shoot me a message! I'd appreciate if you dropped by to say thanks.
- Octopu$
🐙
Conditional

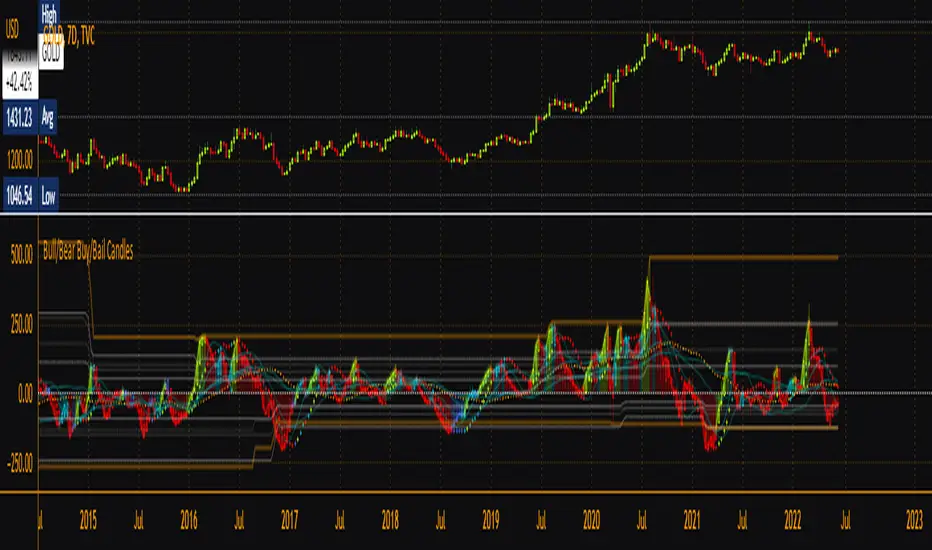
Bull/Bear Buy/Bail CandlesBased on BullBearPower indicator, this is a heavily modified version with colored candles to show when bulls or bears are buying or bailing. Includes Fibonacci Levels based on Highest/Lowest value in variable length, along with optional second timeframe and alternative calculation for candles and linear regression curves for increased versatility. Green = bullish /long, Aqua = still-bullish albeit weakening, blue = weak albeit strengthening and red = weak/short. Perfect as a confirmation indicator for those looking to time markets.
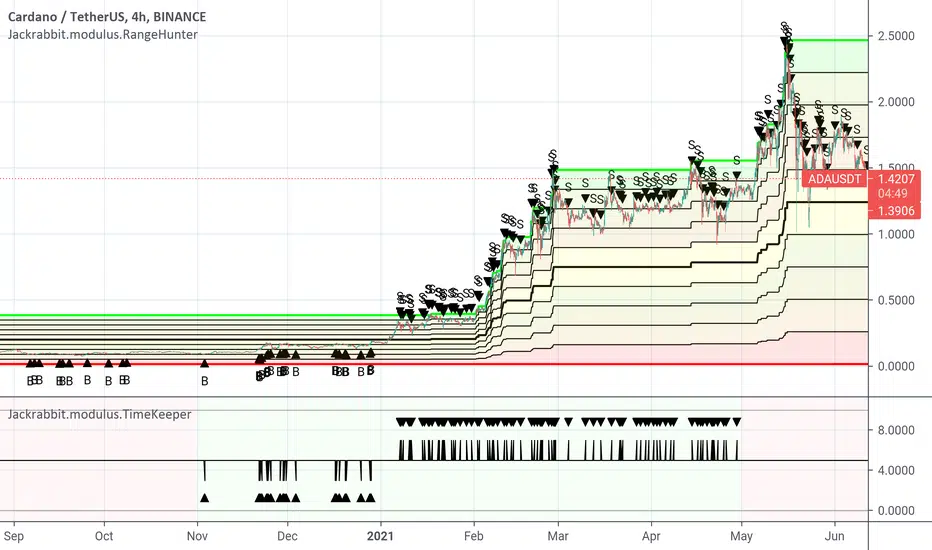
Jackrabbit.modulus.TimeKeeperThis is the Time Keeper for the Jackrabbit suite and modulus framework.
The entire modulus framework has been built upon taking historical data and working with the "flow" of that data, no matter what state the market is in. This has often lead to missed opportunities and an asset may be serverely channel locked from the historical data. Many coins still suffer this from the Black Thursday market drop.
This module interrupts the "flow" of historical data and allow the ability to trade is if the past didn't exist. This can be a very important step for the DCA module in avoiding long term channeled situations. There are many other benefits to this module as well with respect to time trading limitations.
The downside is that historical data is completely disregarded. Care must be used in the placement of this module within your IoI chain.
Only the signal line is displayed.
Times are based upons TradingView, not your local timezone.
Red backgrounds are when the trading action is outside the time limits of the module. Green is when trading action is in the limits of the module.
Start and end times are user configurable.
The Jackrabbit modulus framework is a plug in play paradigm built to operate through TradingView's indicator on indicatior (IoI) functionality. As such, this script receives a signal line from the previous script in the IoI chain, and evaluates the buy/sell signals appropriate to the current analysis.
This script is by invitation only. To learn more about accessing this script, please see my signature or send me a PM. Thank you.
Bayes Probability Index by DGTWhat is Probability?
It is a measure for calculating the chances or the possibilities of the occurrence of a random event. In simple words, it calculates the chance of the favorable outcome amongst the entire possible outcomes. Mathematically, if you want to answer what is probability, it is defined as the ratio of the number of favorable events to the total number of possible outcomes of a random events.
Is this enough? May be or may be not
Let’s consider an example,
A simple probability question may ask: "What is the probability of Amazon.com's stock price falling?"
How about if we extend our question a step further by asking: "What is the probability of AMZN stock price falling given that the Dow Jones Industrial Average (DJIA) index fell earlier?"
Now we are ready to consider conditional probability and Bayes' Theorem is where we could find answer to this question
Bayes' Theorem
Bayes' theorem, named after 18th-century British mathematician Thomas Bayes, is a mathematical formula for determining conditional probability. Conditional probability is the likelihood of an outcome occurring, based on prior knowledge of conditions or another related event occurring. Bayes' theorem provides a way to revise existing predictions or theories (update probabilities) given new or additional evidence. Bayes' theorem thus gives the probability of an event based on new information that is, or may be related, to that event
Formula For Bayes' Theorem
P(A|B) = P(B∣A) * P(A) /P(B)
= P(B∣A) * P(A) / (P(B∣A)* P(A) + P(B∣A’)* P(A’) )
where
A and B are events and P is probability
P(A|B) is the posterior probability, the probability of A after taking into account B
P(A) is the prior probability, the probability of A belief
P(A’) is the prior probability, the probability of A disbelief : P(A’)=1- P(A)
P(B) is the prior probability, the probability of B belief
P(B∣A) is the conditional probability or likelihood, the degree of belief in B given that proposition of A belief (A true)
P(B∣A’) is the conditional probability or likelihood, the degree of belief in B given that proposition of A disbelief (A false)
Bitcoin was the first-ever cryptocurrency, designed by Satoshi Nakamoto. In its likeness, all other cryptocurrencies were then created. The relationship between Bitcoin and altcoins remains something crypto analyst watch closely. This study aims to display the likelihood of bullish movement for ALTS-USDT pairs taking into consideration of bullish move probability of BTC-USDT pair
What to look for:
Percentage Value of the Conditional Probability and/or Simple Probability. When value is above %50 than bullish move is more probable, conversely when the value is below %50 bearish move is more likely
Limitations : Conditional Probability Line will be shown for daily time frame only, Simply Probability Line would be available for all time frames
Conditional Probability is calculated with the condition of BTC-USDT pair so using Conditional Probability is suggested with ALTS-USDT pairs.
Indicators aim to generate a potential signal/indication of an upcoming opportunity, but, the Indicators themselves do not guarantee the future movement of a given financial instrument, and are most useful when used in combination with other techniques.
Trading success is all about following your trading strategy and the indicators should fit within your trading strategy, and not to be traded upon solely
Disclaimer : The script is for informational and educational purposes only. Use of the script does not constitutes professional and/or financial advice. You alone the sole responsibility of evaluating the script output and risks associated with the use of the script. In exchange for using the script, you agree not to hold dgtrd TradingView user liable for any possible claim for damages arising from any decision you make based on use of the script

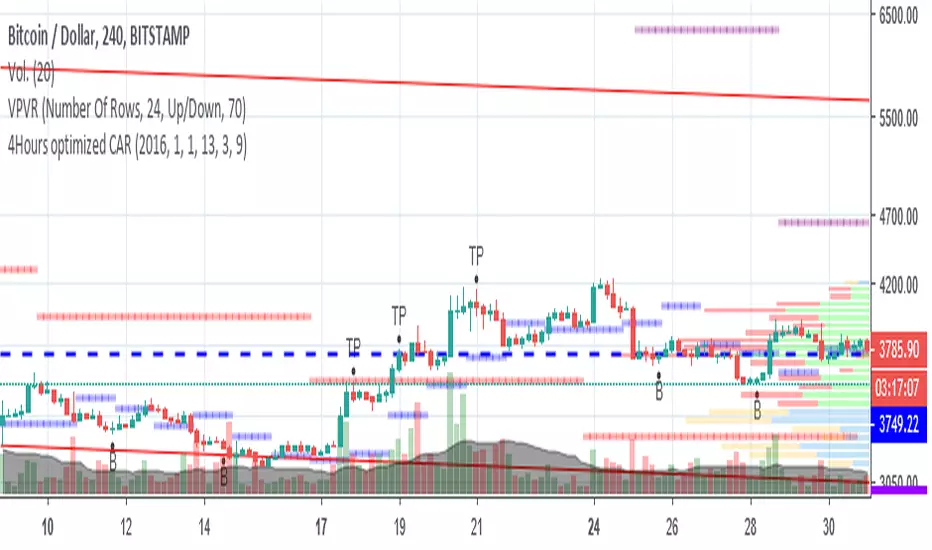
4Hours-optimized Crypto Alert ReloadedUPDATE:
*Added Pivot Levels for a better market lecture.
Advice, try to filter the early B signals by pivot strength.
Stay tunned!