D-ETH

Top 5 coins cummulated Upvol/Dnvol and Money FlowThis script reads price and volume information for the top 5 coins (on 9 exchanges, a total of 29 pairs), calculates the cummulative upvolume and downvolume according to the Money Flow (MFI) formula, and shows upvolume and downvolume separately on the chart as a green and a red line.
The coins used are BTC, ETH, LTC, XRP and EOS. They are the top 5 coins by daily volume, as of 24th of February 2019.
Because of the many security() calls needed, the script is VERY slow, so have lots of patience.
I find it useful as a broad crypto market indicator - for example to compare the current pump with the pumps in the past.
Can also calculate the aggregated Money Flow (MFI) if you check that option in the indicator's configuration. Make sure to wait for recalculation and rescale the chart afterwards - MFI has a value from 0 to 100 and you may need to zoom in.

ETH HawkEye Aggregated Volume IndicatorThis is combined Aggregated ETH Exchange Volume by Neobutane with HawkEye volume clone indicator by LazyBear.
Indicator includes aggregated raw ETH volume from 7 user selectable fiat and tether exchanges on USD, USDT, BTC, EUR, GBP, JPY pairs + Exponential MA + hawkeye bar coloring where: green is bullish volume , red - bearish and white - volume neutral to the market:
Bitfinex
Coinbase
Bitstamp
Kraken
Binance
Poloniex
Bittrex
*There is a TV bug that doesn't display a whole volume history if some pair was added later than date intended to be analysed by operator eg, if you want to watch older data you should exclude all secondary pairs that were added later and switch off "newer" exchanges like Binance.

Current volatilityHello everyone.
Today an other small indicator that show the current volatility .
It works on all tickers ( crypto-currencies / others ) .
Method :
- ((high-low) * 100) / open
Hope it will be useful for you :)

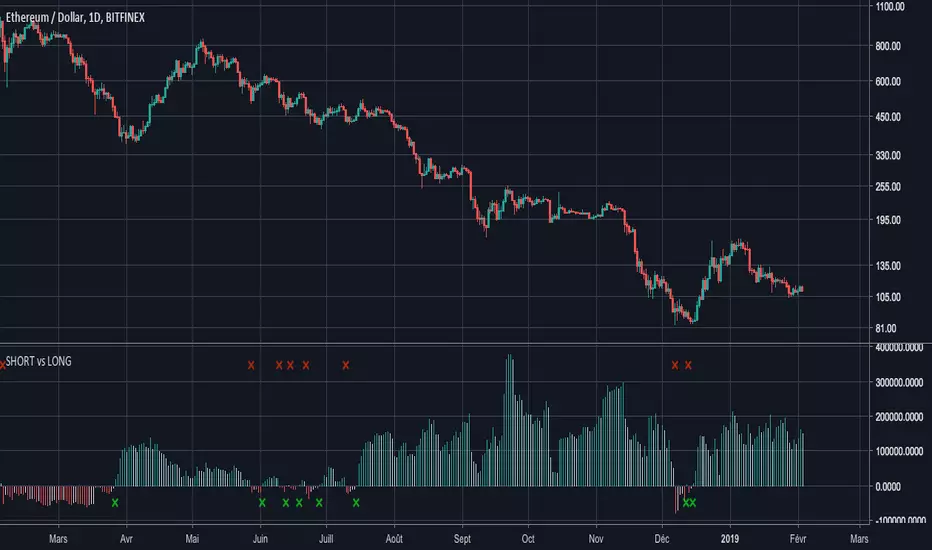
ETHUSDSHORTS - ETHUSDLONGS : balance of powerHello everyone,
I noticed that many people try to compare SHORTS and LONG positions (see:ETHUSDSHORTS and ETHUSDLONGS ), and the available indicators don't sufficiently highlight the balance of power .
That's why I programmed this indicator to answer this need ( which I also have ! ).
His ETHUSDSHORTS - ETHUSDLONGS crossover indicator e of power
I think you will understand quickly how it works, it's easy :
- If the histogram is negative, the color is red and that means that there are more BTCUSDSHORTS than ETHUSDLONGS
- If the histogram is positive, the color is green and that means that there are more ETHUSDLONGS than ETHUSDSHORTS
A small cross (red or green) appears when the power balance is reversed.
Have a good day.
Coinmarketcap - Live CryptoMarketCap TOP 20Hello everyone,
I hope you are fine.
Today an other important indicator : the TOP 20 crypto market cap !
It's better if you use it on BTC/USD to have more historical data.
Next cryptocurrencies have been used for this indicator :
BTC
ETH
XRP
EOS
BCH
LTC
USDT
TRX
XLM
BSV
ADA
BNB
XMR
IOTA
DASH
NEO
ETC
XEM
USDC
ZEC
Thank you and have a good day :)

CCV Crypto Margin RatiosWorks for ETH, BTC and XRP. Shows the percentage of longs and shorts open. In upper zone, longs are high and you should seek shorts. In the middle zone, longs are low, shorts are high and you should seek longs. In the lower zone, shorts are low and longs are high. This will correlate with longs in upper zone.
Updates likely but unlikely to add other pairs in the interest of keeping load times.


CCV Crypto Margin Positions Via BitfinexAllows you to change between multiple assets to see open longs versus shorts. Includes BTC, ETH, LTC, TRX and more. You can also choose the quote pair of USD or BTC to get an idea for Bitmex assets as well. If you choose BTC on a BTC quote the USD positions will appear. All other assets will show the BTC paired positions.
Like and follow for more free scripts in the future.

BTC ETH RatioBTCUSD / ETHUSD Ratio.
You might find patterns when to move from BTC to ETH and vice versa.
# Open Source
The code is open source @ github.com and uses the commonpine library github.com

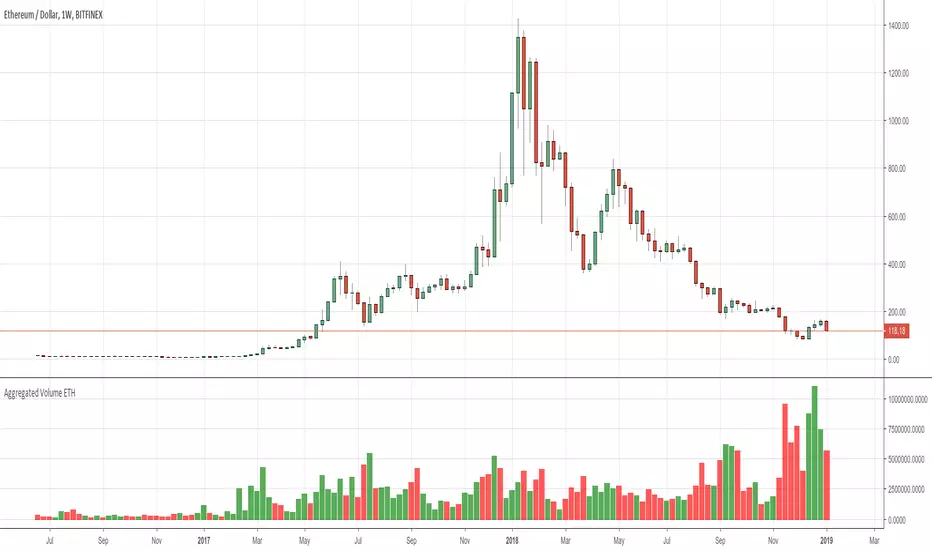
Aggregated Volume ETHAggregates the ETH/fiat volume from multiple exchanges into a single indicator.
# Exchanges and Pairs
Included are only exchanges supported by TradingView:
* Binance
* Bitstamp
* Bittrex
* Coinbase
* Gemini
* itBit
* Bitfinex
* Kraken
* Poloniex
* BitMEX
Excluded low volume exchanges (not in CMC Top):
* CEX . IO
* Coinfloor
Excluded exchange due to volume calculation by TV:
* HitBTC
Many other top exchanges are not included, because they are not supported by TradingView.
# Inputs
By default the spot exchanges are selected. You can select also the other margin trading and derivatives exchanges.
# Contribute
Feel free to share any ideas and issues you have.
# Open Source
The code is open source @ github.com and uses the commonpine library github.com
SSABU TOTAL / BTC / ETH / USDT Dominance
✅ TOTAL / BTC / ETH / USDT Dominance (total market cap / beat / ethernet / share) indicator.
This indicator is a supplementary indicator for the market share of TOTAL Market Cap / BTC / ETH / USDT.
You can check the above occupation rate in real time through the check box of the input. By default, only the dominance of the bit is set to come out.
If you want to see a different share of the bit, check the check box in the input box.
The above screen shot shows only the dominance of the default setting bit.
✅ TOTAL / BTC / ETH / USDT Dominance (총 마캣캡 / 비트 / 이더 / 유에스디티 점유율) 지표입니다.
본 지표는 TOTAL Market Cap / BTC / ETH / USDT의 점유율을 확인 할 수 있는 보조지표 입니다.
인풋의 체크박스를 통하여 위의 점유율을 실시간으로 확인 할 수 있고 기본으로는 비트의 도미넌스만 나오도록 설정하였습니다.
비트 외의 다른 점유율을 보고 싶으시면 인풋에서 체크박스 체크해주시면 확인 가능합니다.
위의 스크린샷은 기본설정인 비트의 도미넌스만 적용한 모습입니다.
✅ 매매에 도움되는 다른 보조지표
Basel ver 2.21

MACD + Stochastic + RSI StrategyMy strategy uses a combination of three indicators MACD Stochastic RSI.
The Idea is to buy when (MACD > Signal and RSI > 50 and Stochastic > 50) occures at the same time
This strategy works well on stocks and cryptos especially during market breaking up after consolidation
The best results are on Daily charts, so its NOT a scalping strategy. But it can work also on 1H charts.
The strategy does not have any stops and profit targets, so we can take all the market can give us at the moment.
The exit point only when MACD goes under Signal
Its Preformance is quite stable.
So, use it, trade it.
If it will help you to imprive your trading results, please donate me
BTC: 12kd1F8buWisUBdq27BBwRkUvzW7Ey3og5

Total Volume for BTC or ETHBITMEX:ETHUSD BITSTAMP:BTCUSD Script includes cumulative Bitcoin volume from exchanges such as Binance, Bitfinex, Bithumb, Coinbase and more
As default, volume is shown based on the number of Bitcoin moved
If volume increases day over day the color will be blue, if it dereases the color will be red. This is not related to price
You can currently switch between ETH or BTC by putting those abbreviations in on the settings inputs
You can also switch to a USD output
You can remove Bitmex data as this exchange is highly leveraged contracts, default includes Bitmex data
Some delays in loading as the indicator pulls data from multiple exchanges
Future updates may include availability of other coins or additional exchanges added

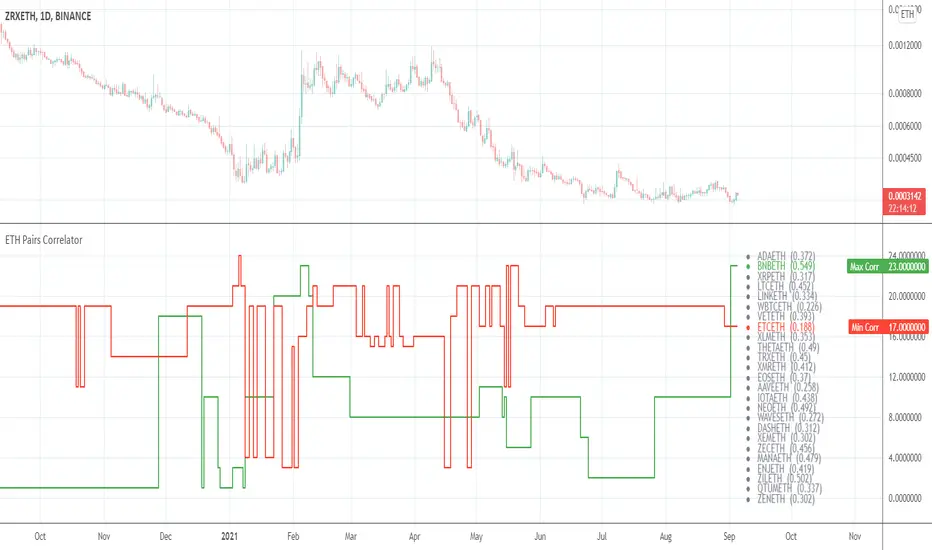
ETH Pairs CorrelatorHey there!
This tool helps to identify the best positive and negative correlated pairs from 38 */ETH cryptocurrency pairs.
By default it will find the best correlations for your current ticker.
If you are a newbie in Correlation Analysis you can find a brief explanation here .
Settings
Lookback for correlations (default: 14 )
Option to use or not to use current ticker (default: true )
Custom ticker (default: BTCUSDT )
Choose as many pairs as you want from 38 available pairs.
Available pairs
ADAETH
BATETH
BCDETH
BCHETH
BNBETH
BSVETH
BTGETH
DASHETH
DGBETH
EOSETH
ETCETH
HOTETH
ICXETH
IOTAETH
LSKETH
LTCETH
MKRETH
NANOETH
NEOETH
NPXSETH
OMGETH
ONTETH
QKCETH
QTMETH
REPETH
TRXETH
TUSDETH
VETETH
WAVESETH
XEMETH
XLMETH
XMRETH
XRPETH
XTZETH
XVGETH
ZECETH
ZILETH
ZRXETH
Good luck!
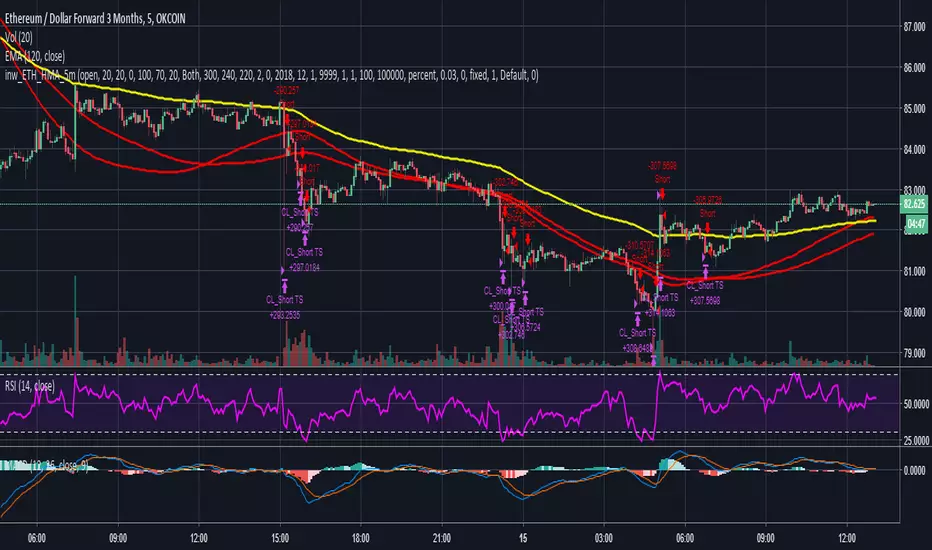
Relative Estimated Price KivanÇ version (Strategy) By Wicksell Thanks to the great work of KIVANÇ in the Relative Estimated Price REP by KIVANÇ fr3762, it has adapted modifications in the Lookback bar length, transformed into strategy, where a line determines a relative average price of XBTUSD, BTCUSD, ETHUSD and BCH.
the line is a calculation, where it involves reading previous candles where it determines what the current price should be.
When the REP line is above the candle, open buy and close sell, when it is below, open sell and close buy.
When setting which currency, do not forget to change the settings where they are:
1 - XBTUSD
2 - BTCUSD
3 - ETHUSD
4 - BCHBTC
may also be modified:
the Lookback bar length, stop loss settings, test date.
The best results are in the 1H time, with the default settings, but try to modify the data and if you find better results, I would be grateful if you post here.
pivot point strategy(lirshah)The pivot point levels are composed of a pivot point, two higher resistance levels known as R1 and R2, and two lower pivot point supports known as S1 and S2.
Each resistance level is considered a pivot point.
this strategy gives signals based on valid pivot points( reactionary price level) and it has a good results on the variety of pairs in different markets.

ETHUSD Total VolumesHello traders!
This tool shows you ETHUSD total trade volumes from the all (well, almost) cryptocurrency exchanges on different timeframes.
Supported timeframes
"1"
"3"
"5"
"10"
"15"
"30"
"45"
"60" - 1 hour
"120" - 2 hours
"180" - 3 hours
"240" - 4 hours
"300" - 5 hours
"360" - 6 hours
"420" - 7 hours
"480" - 8 hours
"540" - 9 hours
"600" - 10 hours
"660" - 11 hours
"720" - 12 hours
"780" - 13 hours
"840" - 14 hours
"900" - 15 hours
"960" - 16 hours
"1020" - 17 hours
"1080" - 18 hours
"1140" - 19 hours
"1200" - 20 hours
"1260" - 21 hours
"1320" - 22 hours
"1380" - 23 hours
"D"
"2D"
"3D"
"W"
"M"
How to get access
Buy for only 25$ to get lifetime access to this indicator
Like and follow for more cool indicators!
Happy Trading!

Crypto Correlations HeatmapHello friends,
This tool is designed for crypto traders who want a fast, visual way to understand how different coins move relative to each other. It builds a correlation heatmap between your current chart symbol and a customizable list of crypto pairs, helping you immediately see which assets tend to move together, move opposite, or behave independently.
🛠️ How It Works
You provide a comma-separated watchlist of cryptocurrency tickers (for example, a list of USDT or USD-margined pairs). The script then:
Filters this list using your chosen Display Mode - All pairs, or only BTC, ETH, USDT, or USDC-related pairs.
Splits long watchlists into pages of up to 40 tickers , so you can smoothly navigate large universes of coins using the page selector.
For each symbol on the active page, it calculates the Pearson correlation over a user-defined lookback period, based on your selected Correlation Source (close, alternative price averages, or other supported inputs via the custom source module).
The results are rendered as a color-coded heatmap: color and intensity reflect both the strength and direction of correlation with your chart symbol.
You can switch between multiple professional color palettes to fine-tune how positive, negative, and neutral correlations are visually separated on the chart.
🔥 Key Features
Custom watchlist input via a simple text area (paste long lists directly from your exchange or screener)
Pagination support - view up to 40 tickers per page for stable performance
Flexible Display Modes : All pairs, BTC pairs, ETH pairs, USDT pairs, USDC pairs
Adjustable correlation lookback length
Advanced correlation source selector via the custom source module
Multiple color palettes : Blue/Red, Blue/White/Red, Green/Pink, Green/Red, Green/Yellow/Red, Purple/Orange, Spectral, Viridis
Clear visual mapping of correlation strength and sign using color intensity and hue
👋 Good luck and happy trading!


U&Dif price has moved up since 1 to 3 candles ago = buy
if price has moved down since 1 to 3 candles ago = sell
has internal SL & TP
tested on
BITFINEX:ETHUSD
BITFINEX:BTCUSD
BITFINEX:LTCUSD
BITFINEX:ETHBTC
4 hour charts
