Các chỉ số, chiến lược và thư viện
Historical Volatility Percentile tells you the percentage of the days from the past year (252 trading days) that have lower volatility than the current volatility. I included a simple moving average as a signal line to show you how volatile the stock is at the moment. I have included simple colors to let you know when to enter or exit a position. Buy when...
The other way to build bands around price that uses Mean Absolute Deviation instead of Standard Deviation. MAD is also a measure of variability, but less frequently used. MAD is better for use with distributions other than the Gaussian. MAD is always less than or equal to Standard Deviation and the resulting bands are more tighter for the same parameters if we...
Market: Stocks and ETF's This overlay shows the deviation of the exponential moving average of the mid candle price of the currently loaded chart, away from the exponential moving average of the S&P and DOW combined and averaged mid candle price. The top and bottom lines also give a visual perspective of what a certain percentage (default 1%) looks like on the...
XBT/ETH Deviation histogram on BitMEX XBT/XBTH20/ETH/ETHH20
If you like the script please come back and leave me a comment or find me on the interwebs. I get notified you "liked" it... but I have no idea if you actually use it. So, let me know =) The script uses the open price as the mean and calculates the standard deviation from the open price on a per candle basis - Goal: - To establish a mean based on the Open Price...
The Mean Deviation Index (MDX) is used to see how much price is deviating from the mean. This indicator takes both volatility and mean deviation in consideration. It uses the standard deviation of the ATR to filter an EMA, and uses this as the mean. It then only plots > or < 0 if price is more than one x ATR away from the mean. If index is positive, the...
This is Exponential Deviation Bands. It is a price band indicator based on exponential deviation rather than the more traditional standard deviation, as you find in the well-known Bollinger Bands calculation. As compared to standard deviation bands, exponential deviation bands apply more weight to recent data and generate fewer breakouts. There fore it is a much...
This adds volatility bands to the Variable Index Dynamic Average (VIDYA). The bands are calculated using the exponential moving average of the standard deviation of the VIDYA. Thanks to everget for programming the VIDYA for tradingview.
Introduction The standard deviation measure the dispersion of a data set, in short this metric will tell you if your data is on average closer or farther away from the mean. Its one of the most important tools in statistics and living without it is pretty much impossible, without it you can forget about Bollinger-bands, CCI, and even the LSMA (ouch this hurt)...
bitFlyer price deviation percent between FXBTCJPY and BTCJPY. bitFlyerのBTCFXとBTC現物の価格乖離(%)を表示します。
Bitfinex-Bitmex Deviation BTC price deviation between Bitfinex and Bitmex.
An idea I had today morning so I had to write. It seems to detect trends well. It has three phases like a semaphor, painting the chart bars of green, yellow or red. === Bar Color Meaning === Green: uptrend Yellow: don't care Red: downtrend I think it can be useful! Thanks!
Hello traders and developers! I was wondering how built-in "dev" function in Pine is calculated so I made a little research. I examined 7 samples: 0) "dev" function itself 1) "dev" according to its description: series - sma(series) 2) Mean Absolute Deviation 3) ratio of the absolute difference from 1) divided by period 4) ratio of the difference from 1)...
Phase Change Index script. This indicator was developed and described by M. H. Pee (Stocks & Commodities V.22:5 (28-37): Phase Change Index). Other indicators of M. H. Pee:
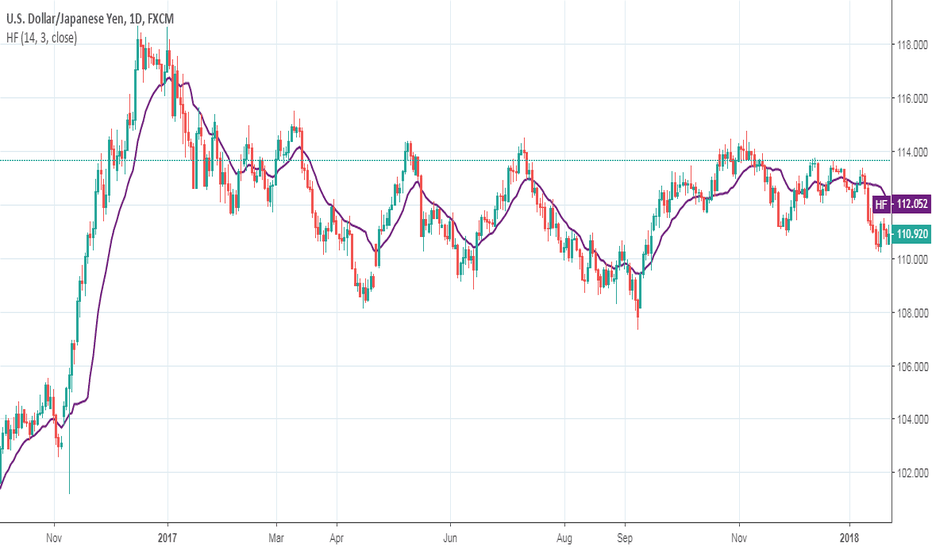
Hampel Filter script. This indicator was originally developed by Frank Rudolf Hampel (Journal of the American Statistical Association, 69, 382–393, 1974: The influence curve and its role in robust estimation). The Hampel filter is a simple but effective filter to find outliers and to remove them from data. It performs better than a median filter.
Ehlers Fisherized Deviation-Scaled Oscillator script. This indicator was originally developed by John F. Ehlers (Stocks & Commodities V. 36:11: Probability - Probably A Good Thing To Know).
Ehlers Deviation-Scaled Moving Average indicator script. This indicator was originally developed by John F. Ehlers (Stocks & Commodities V. 36:8: The Deviation-Scaled Moving Average).


![BITMEX XBT/ETH Deviation [mado] ETHH20: BITMEX XBT/ETH Deviation [mado]](https://s3.tradingview.com/0/0MifOECJ_mid.png)


![Exponential Deviation Bands [ChuckBanger] BTCUSD: Exponential Deviation Bands [ChuckBanger]](https://s3.tradingview.com/v/vhq11sQF_mid.png)


![[RESEARCH] Mean Absolute Deviation BTCUSD: [RESEARCH] Mean Absolute Deviation](https://s3.tradingview.com/q/qXc06HaE_mid.png)


