XXMonk Sequence Price Grid (Manual Origin + U)⭐ XXMonk Sequence Grid – Harmony Price Levels (1–144 Sequence Engine)
Algorithmic Sequence Mapping for Price Displacement
The XXMonk Sequence Grid is a precision mapping tool designed to project algorithmic price levels using harmonic numerical sequences derived from the ICT-inspired time/price symmetry concept.
This indicator takes a user-defined Origin (EQ level) and generates symmetrical expansion bands above and below price using any combination of the following sequence values:
These levels act as algorithmic rails that price frequently reacts to, respects, or expands toward — providing traders with a structural framework to interpret displacement, liquidity objectives, and sequence-based expansions.
🔷 Core Features
✔ Manual Origin (EQ Level)
Set any midpoint — daily open, session equilibrium, dealing range midpoint, your own anchor, etc.
✔ Manual U Value (Unit Size)
No restrictions. Enter any point value (ex: 0.25, 1, 5, 12.5, 25…) to scale the sequence to your instrument.
✔ Full Sequence Control
Toggle ON/OFF each individual harmonic sequence:
Micro ranges → 1, 3, 5
Intermediate → 8, 13, 21
Macro ranges → 34, 55, 89, 144
✔ Individual Line Colors
Every sequence level has its own color input for full customization.
✔ Static Lines (Do Not Move With Cursor)
Lines anchor from the first bar and extend infinitely to the right.
✔ Automatic Labels on Right Side
These levels often align with:
Liquidity pools
Displacement endpoints
PD array boundaries
Algorithmic expansion levels
Reversal zones
Session highs/lows
Volatility-based fractals
Price frequently travels sequence-to-sequence, creating a predictable harmonic structure.
Educational

Alloyz Traders_RSI by Sagar BRSI for Intraday purpose with moving average and volume weightage price added in RSI.

Scalping EMA9/15 This indicator is designed for high-accuracy intraday scalping based on a refined version of the popular EMA9–EMA15 trend-following technique.
It filters weak or premature entries by requiring a retest of the EMA zone before generating a Buy/Sell signal — drastically reducing false breakouts.

Killzones (EST)Asian Range
19:00 – 00:00 EST
Consolidation, liquidity build
London Open
02:00 – 05:00 EST
Initial expansion, Judas Swing
New York Open
07:00 – 10:00 EST
Main move, SMT, MSS setups
NY Lunch/Reversal
11:30 – 13:00 EST
Rebalancing, exit window

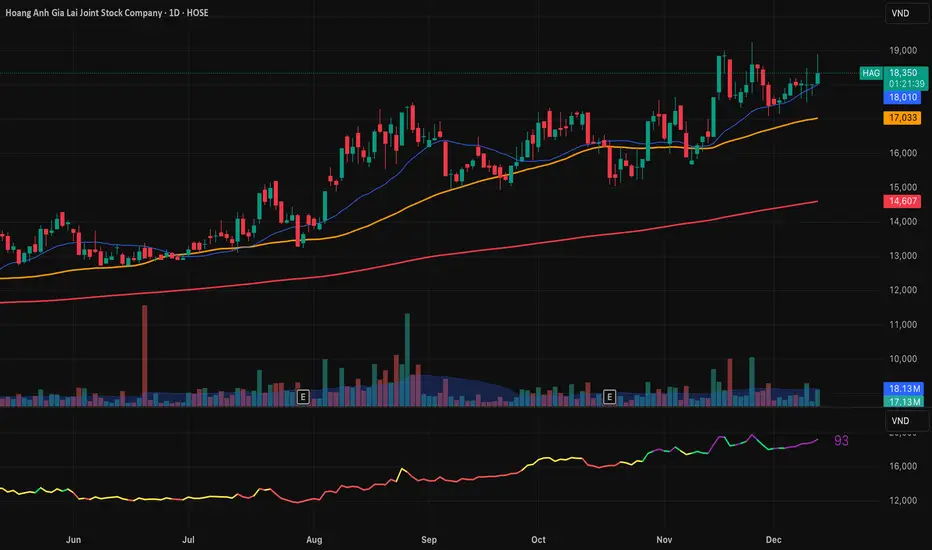
RS Rating Vietnam - IBD Style (AlphaStock Edition)Description: This implies the Relative Strength (RS) Rating specifically optimization for the Vietnam Stock Market, inspired by Investor's Business Daily (IBD) methodology.
How it works: Unlike the standard RSI (which measures internal momentum), this RS Rating compares a stock's performance against a benchmark index (Reference Index: VNMIDCAP or VNINDEX) over the last 12 months.
Calculation Formula: The rating is based on weighted performance (ROC):
40% weight: Latest 3 months (1 Quarter)
20% weight: 6 months
20% weight: 9 months
20% weight: 12 months
Features:
Auto-Scaling RS Line: The line automatically adjusts to fit the price chart, removing the need for manual fixed scales.
Benchmark Comparison: Compares stock Alpha vs. VNMIDCAP (default) to detect leaders even when the general market is skewed by large-cap stocks.
Color Coded:
Purple: Rating > 90 (Strong Buy/Leader)
Green: Rating > 80
Yellow: Rating > 60
Red: Rating < 60
Smart Display: Shows historical Rating values in the Data Window when hovering over past candles.
Credits: Designed by Admin AlphaStock.
RS Rating Viet Nam by Admin AlphaStockSo sanh vs VNMIDCAP
Bạn có thể thay đổi BenchMark trong Code thành VNINDEX hay bất kỳ chỉ số nào

VCAI Volume & Liquidity Map LiteVCAI Volume & Liquidity Map Lite visualises recent market participation using a horizontal liquidity/volume histogram plotted beside current price.
It shows where trading activity has clustered, where the chart is thin, and how much of that activity came from buying vs selling pressure.
This Lite edition keeps the tool simple and fast:
Yellow = buy-side volume (aggressive buyers / upward pressure)
Purple = sell-side volume (aggressive sellers / downward pressure)
Thicker sections = higher traded volume at that price
POC line (purple) marks the price with the highest volume concentration
Value Area lines (yellow dashed) mark where ~70% of volume has traded
Bars extend outward to the right of price for a clean, unobstructed chart
Lookback setting controls how many candles the map is built from
Use it to quickly identify:
high-interest price zones
low-liquidity areas where price can move fast
likely reaction levels
where momentum may slow, reverse, or break through
Designed as a lightweight, open-source tool for anyone wanting a clean liquidity/volume map without complex settings.
Part of the VCAI Lite Series.

Breakout Scanner (Screener)Breakout Scanner (Screener style — single indicator to drop in Screener tab)

Disoxis Capital Club📊 Strategy B✅This indicator has been exclusively developed for Disoxis Capital Club members, combining advanced volume-weighted analytics with institutional trading concepts.
The indicator automatically resets at the start of each trading session and uses volume-weighted statistical calculations to ensure accuracy that aligns with professional trading platforms. All visual elements, including customizable color schemes and line styles, have been optimized for clarity and real-time decision-making. Designed specifically for active intraday traders within the Disoxis Capital Club community, this indicator incorporates time-based filtering capabilities and session-specific analytics to help identify high-probability trading opportunities.
The tool displays key institutional levels through clean visual representation, making it easier to recognize market behavior around volume-weighted price zones. Whether you're analyzing futures, forex, or equity markets, this indicator provides the technical foundation needed to align your trading with smart money movements and institutional order flow patterns.

RTH Yesterday & Today Premarket Levels## **RTH Yesterday & Today Premarket Levels**
This indicator plots the most commonly used **institutional reference levels** for intraday trading:
* **Yesterday’s Regular Trading Hours (RTH) High**
* **Yesterday’s Regular Trading Hours (RTH) Low**
* **Yesterday’s Regular Trading Hours (RTH) Close**
* **Today’s Premarket High**
* **Today’s Premarket Low**
All levels are drawn as **straight horizontal lines with labels** and remain fixed throughout the current session.
---
### **How Levels Are Calculated**
**Yesterday’s Levels (RTH only)**
* Computed strictly from **Regular Trading Hours (09:30–16:00 exchange time)**.
* Extended-hours data is **excluded** to avoid distortion.
* Captures true institutional highs, lows, and closing price.
**Today’s Premarket Levels (PM only)**
* Computed strictly from **today’s premarket session (04:00–09:29)**.
* Resets daily and does not include prior days.
* Levels finalize once premarket ends and extend across the regular session.
---
### **Key Features**
* Exactly **5 fixed reference levels**, no historical clutter
* **Non-repainting**: levels do not change once established
* **No zig-zags or plots**; only clean horizontal lines
* Customizable **line colors and thickness**
* Labels clearly identify each level:
* Y High
* Y Low
* Y Close
* PM High
* PM Low
---
### **Best Use Cases**
* Intraday trading (1m, 5m, 15m)
* VWAP and momentum strategies
* Gap-and-go or fade setups
* Support/resistance validation
* Options trading and scalping
These levels often act as **decision points, liquidity magnets, and rejection zones** during the regular session.
---
### **Required Settings**
* Use **intraday timeframes**
* Enable **Extended Hours** in TradingView’s symbol settings
* Designed for **US equities** using exchange time
---
### **Trader Notes**
This script is intentionally minimalist. It shows only the **most relevant prior-day and premarket price references** used by professional traders, avoiding noise from multi-day indicators or derived averages.

Stage 2 Pullback Swing indicatorThis scanner is built for swing traders who want high-probability pullbacks inside strong, established uptrends. It targets names in a confirmed Stage 2 bull phase (Weinstein model) that have pulled back 10–30% from a recent swing high on light selling volume, while still respecting fast EMAs.
Goal: find powerful uptrending stocks during controlled dips before the next leg higher.
What it looks for
Strong prior uptrend: price above the 50 and 200 SMAs, momentum positive over multiple timeframes
Confirmed Stage 2: price above a rising 30-week MA on the weekly chart
Pullback depth: 10–30% off recent swing highs—not too shallow, not broken
Pullback quality: range contained, no panic selling, trend structure intact
EMA behavior: price near EMA10 or EMA20 at signal time
Volume contraction: sellers fading throughout the pullback
Bullish shift: green candle back in trend direction
Why this matters
This setup hints at institutions defending positions during a temporary dip. Strong stocks pull back cleanly with declining volume, then resume the primary trend. This script alerts you when those conditions align.
Best way to use
Filter a strong universe before applying—quality tickers only
Pair with clear trade plans: risk defined by prior swing low or ATR
Trigger alerts instead of hunting charts manually
Intended for
Swing traders who want momentum continuation setups
Traders who prefer entering on controlled retracements
Anyone tired of chasing extended breakouts

DeM Trend Bias Strength with Alerts (RB Trading)This tool is built to help users understand trend direction, exhaustion, and momentum shifts on the daily timeframe. It highlights when a market is transitioning from weakness to strength or strength to weakness by displaying color-coded bias bars. The script does not forecast future outcomes and should be used as an analytical aid.
Intended Usage
• Timeframe: Daily
• Instruments: Works on most FX pairs and liquid markets
• Style: Trend and bias evaluation
• Purpose: Identify early signs of momentum recovery within ongoing trends
How It Works
Bias Rotation Engine
The script measures directional pressure and smooths it into a bar display that changes color as conditions shift.
• Green bars show rising strength conditions
• Red bars show declining strength conditions
• Transitional periods often appear near market turning points and consolidation zones
This helps users visually separate healthy directional trends from weakening phases.
Trend Alignment Filter
The bars are designed to be interpreted alongside moving averages or broader trend tools. When the bars turn higher while price respects an upward structure, it often supports continuation themes. When the bars weaken during downward phases, it highlights potential areas where the trend retains control.
Identifying Exhaustion and Recovery
Repeated cycles in the bar display can highlight areas where:
• Downside pressure is fading before an upswing
• Upside pressure is fading before a pullback
• Consolidation is forming before a breakout
These transitions tend to align with moments shown in the image where the arrows mark bias shifts occurring before price acceleration.
How to Use It
• Wait for a clear color rotation before making any decisions
• Confirm with the daily trend and price structure
• Avoid using the tool by itself for entries
• Combine with support and resistance, moving averages, and candle structure
• Not intended for scalping or intraday signals
Why Daily Chart Works Best
The daily timeframe smooths out noise and gives the strength bars enough data to reveal genuine trend transitions. Higher timeframes also reduce false rotations that are common in lower timeframes.
Notes
The script does not predict or guarantee price movement. It processes historical inputs to help the user understand directional conditions. Each trader should apply their own risk plan and confirm levels before acting on any idea.


Vib ORB Range (Free)Vib ORB Range (Free) plots the Opening Range High and Low for the session based on a user-defined start time and duration.
This tool is designed for traders who want a clean, no-noise display of the ORB zone without extra indicators or automation.
Features:
Customizable Opening Range start time
Customizable Opening Range duration
Automatically resets daily
Plots ORB High, ORB Low, and optional ORB Midline
Shaded range zone for improved clarity
Works on all timeframes and markets
How to Use:
Set the ORB start time (default 9:30 New York)
Set the ORB duration (default 15 minutes)
The indicator will draw the ORB zone once the range completes
Use the outlines or shaded zone to visually identify potential breakout areas
This free tool is intended as a simple, reliable ORB visualizer without alerts, filters, or strategy logic.

Aroon High R02 - With RR Exit + TP Toggle + VWAPWhat this indicator is for
This is a trend-continuation breakout trading indicator designed to:
Catch strong upside momentum
Enter only after confirmation
Manage risk using fixed SL, RR-based trailing SL, and optional TP
Filter bad trades using VWAP
It’s meant for intraday & positional trading on indices and stocks.


YSD RSIYSD RSI
This indicator is an enhanced version of the traditional Relative Strength Index (RSI), designed to provide deeper insight into market momentum and trend quality. While the classic RSI focuses primarily on the ratio of recent gains to losses, this strengthened variant incorporates additional layers of analysis to capture subtler shifts in price behavior. By applying refined smoothing techniques, integrating volatility awareness, and emphasizing the consistency of directional movement, the indicator aims to reduce noise and highlight more reliable momentum signals. As a result, it not only identifies overbought and oversold conditions with greater precision but also reacts more intelligently to changing market environments. Traders can use this improved RSI to detect early trend reversals, filter out false signals, and gain a more comprehensive understanding of underlying price dynamics compared to the standard RSI.

30-Minute High and Low30-Minute High and Low Levels
This indicator plots the previous 30-minute candle’s high and low on any intraday chart.
These levels are widely used by intraday traders to identify key breakout zones, liquidity pools, micro-range boundaries, and early trend direction.
Features:
• Automatically pulls the previous 30-minute candle using higher-timeframe HTF requests
• Displays the HTF High (blue) and HTF Low (red) on lower-timeframe charts
• Works on all intraday timeframes (1m, 3m, 5m, 10m, etc.)
• Levels stay fixed until the next 30-minute bar completes
• Ideal for ORB strategies, scalping, liquidity sweeps, and reversal traps
Use Cases:
• Watch for breakouts above the 30-minute high
• Monitor for liquidity sweeps and fakeouts around the high/low
• Treat the mid-range as a magnet during consolidation
• Combine with VWAP or EMA trend structure for high-precision intraday setups
This indicator is simple, fast, and designed for traders who rely on HTF micro-structure to guide intraday execution.

VWolf – Slope GuardOVERVIEW
Slope Guard combines a momentum core (WaveTrend + RSI/MFI + QQE family) with a directional bias (EMA/DEMA and a DEMA-slope filter). Trade direction can be constrained by the Supertrend regime (Normal or Pivot). Risk is managed with ATR-based stops and targets, optional Supertrend-anchored dynamic levels, and a two-stage take-profit that can shift the stop to break-even after the first partial. The strategy supports explicit Backtest and Forward-test windows and adapts certain thresholds by market type (Forex vs. Stocks).
RECOMMENDED USE
Markets: Forex and equities; use Market Type to properly scale the DEMA-slope gate.
Timeframes: M15–H4 for intraday-swing and H1–D1 for slower swing; avoid ultra-low TFs without tightening ADX/QQE.
Assets: Instruments with persistent trends and orderly pullbacks; avoid flat ranges without sufficient ADX.
Strengths
Multi-layer confluence: trend bias + momentum + regime + strength.
Flexible risk engine: ATR vs. Supertrend anchoring, staged exits, and automatic break-even.
Clean research workflow: separated Backtest and Forward-test windows.
Precautions
Structural latency: Pivot-based constructs confirm with delay; validate with Forward-test.
Filter interaction: QQE Strict + ADX + WT zero-line can become overly selective; calibrate by asset/TF.
Overfitting risk: Prefer simple, portable parameter sets and validate across symbols/TFs.
CONCLUSION
Slope Guard is a “trend + momentum” framework with risk control at its core. By enforcing a baseline bias, validating momentum with the Vuman composite, and offering ATR or Supertrend-anchored exits—plus staged profits and break-even shifts—it seeks to capture the core of directional swings while compressing drawdowns. Keep testing windows isolated, start with moderate filters (QQE Normal, ADX ~20–25), and only add stricter gates (WT zero-line, DEMA slope) once they demonstrably improve stability without starving signals.
FOR MORE INFORMATION VISIT vwolftrading.com

VWolf - Shadow PulseOVERVIEW
The Trend Momentum Breakout Strategy is a rule-based trading system designed to identify high-probability entries in trending markets using a combination of trend confirmation, momentum filtering, and precise trigger conditions. The strategy is suitable for intermediate to advanced traders who prefer mechanical systems with clear entry/exit logic and configurable risk management options.
At its core, this strategy seeks to enter pullbacks within strong trends, capitalizing on momentum continuation after brief pauses in price movement. By integrating multiple moving averages (MAs) for trend validation, ADX (Average Directional Index) as a strength filter, and Stochastic RSI as an entry trigger, the strategy filters out weak trends and avoids overextended market conditions. Exit logic is based on a customizable fixed stop-loss (SL) and take-profit (TP) framework, with optional dynamic risk-reduction mechanisms powered by the Supertrend indicator.
This strategy is designed to perform best in clearly trending markets and is especially effective in avoiding false breakouts or choppy sideways action thanks to its ADX-based filtering. It can be deployed across a variety of asset classes, including forex, stocks, cryptocurrencies, and indices, and is optimized for intra-day to swing trading timeframes.
RECOMMENDED USE
This strategy is designed to be flexible across multiple markets, but it performs best under certain conditions:
Best Suited For:
Trending markets with clear directional momentum.
High-volume instruments that avoid erratic price action.
Assets with intraday volatility and swing patterns.
Recommended Asset Classes:
Forex pairs (e.g., EUR/USD, GBP/JPY)
Cryptocurrencies (e.g., BTC/USD, ETH/USDT)
Major indices (e.g., S&P 500, NASDAQ, DAX)
Large-cap stocks (especially those with consistent liquidity)
Suggested Timeframes:
15-minute to 1-hour charts for intraday setups.
4-hour and daily charts for swing trading.
Lower timeframes (1–5 min) may generate too much noise unless fine-tuned.
Market Conditions to Avoid:
Ranging or sideways markets with low ADX values.
Assets with irregular price structures or low liquidity.
News-heavy periods with unpredictable price spikes.
CONCLUSION
This strategy stands out for its robust and modular approach to trend-following trading, offering a high level of customization while maintaining clear logic and structural discipline in entries and exits. By combining three distinct layers of confirmation—trend identification (via configurable moving averages), trend strength validation (via the DMI filter), and timing (via the Stochastic RSI trigger)—it aims to reduce noise and increase the probability of entering trades with directional bias and momentum on its side.
Its flexibility is one of its strongest points: users can tailor the strategy to fit various trading styles and market conditions. Whether the trader prefers conservative setups using only the slowest moving average, or more aggressive entries requiring full alignment of fast, medium, and slow MAs, the system adjusts accordingly. Likewise, exit management offers both static and dynamic methods—such as ATR-based stop losses, Supertrend-based adaptive exits, and partial profit-taking mechanisms—allowing risk to be managed with precision.
This makes the strategy particularly suitable for trend-driven markets, such as major currency pairs, indices, or volatile stocks that demonstrate clear directional moves. It is not ideal for sideways or choppy markets, where multiple filters may reduce the number of trades or result in whipsaws.
From a practical standpoint, the strategy also incorporates real-world trading mechanics, like time-based filters and account risk control, which elevate it from a purely theoretical model to a more execution-ready system.
In summary, this is a well-structured, modular trend strategy ideal for intermediate to advanced traders who want to maintain control over their system parameters while still benefiting from layered signal confirmation. With proper calibration, it has the potential to become a reliable tool in any trader’s arsenal—particularly in markets where trends emerge clearly and sustainably.
FOR MORE INFORMATION VISIT vwolftrading.com

VWolf - Raptor ClawOVERVIEW
The 'VWolf - Raptor Claw' is a straightforward scalping strategy designed for high-frequency trades based on the Stochastic RSI indicator. It focuses exclusively on identifying potential trend reversals through stochastic cross signals in extreme zones, without the need for additional confirmations. This makes it highly responsive to market movements, capturing rapid price shifts while maintaining simplicity.
This strategy is best suited for highly liquid and volatile markets like forex, indices, and major cryptocurrencies, where quick momentum shifts are common. It is ideal for experienced scalpers who prioritize fast entries and exits, but it can also be adapted for swing trading in lower timeframes.
Entry Conditions:
Long Entry:Stochastic RSI crosses above the oversold threshold (typically 20), indicating a potential bullish reversal.
Short Entry:Stochastic RSI crosses below the overbought threshold (typically 80), indicating a potential bearish reversal.
Exit Conditions:
Stop Loss: Set at the minimum (for longs) or maximum (for shorts) within a configurable lookback window to reduce risk.
Take Profit: Defined by a risk-reward ratio (RRR) input to optimize potential gains relative to risk.
CONCLUSION
The 'VWolf - Raptor Claw' strategy is perfect for traders seeking a simple yet aggressive approach to the markets. It capitalizes on sharp momentum shifts in extreme zones, relying on precise stop loss and take profit settings to capture rapid profits while minimizing risk. This approach is highly effective in high-volatility environments where quick decision-making is essential.
FOR MORE INFORMATION VISIT vwolftrading.com

VWolf - Quantum DriftOVERVIEW
The Quantum Drift strategy is a sophisticated, highly customizable trading approach designed to identify market entries and exits by leveraging multiple technical indicators. The strategy uniquely combines the Dynamic Exponential Moving Average (DEMA), QQE indicators, Volume Oscillator, and Hull Moving Average (HULL), enabling precise detection of trend direction, momentum shifts, and volatility adjustments. It stands out due to its adaptability across different market conditions by allowing significant user customization through various input parameters.
RECOMMENDED USE
Markets: Ideal for Forex and Stocks due to the strategy's volatility-sensitive and trend-following nature.
Timeframes: Best suited for medium to higher timeframes (15m, 1H, 4H), where clearer trend signals and less noise occur, enhancing strategy reliability.
CONCLUSION
The Quantum Drift strategy is tailored for intermediate to advanced traders seeking a versatile and adaptive system. Its strength lies in combining momentum, volatility, and trend-following components, providing robust entry and exit signals. However, its effectiveness relies significantly on accurate parameter tuning by traders familiar with the underlying indicators and market behavior.
FOR MORE INFORMATION VISIT vwolftrading.com

VWolf – Pivot VumanSkewOVERVIEW
This strategy blends a lightweight trend scaffold (EMA/DEMA) with a skew-of-volatility filter and VuManchu/WaveTrend momentum signals. It’s designed to participate only when trending structure, momentum alignment, and volatility asymmetry converge, while delegating execution management to either a standard SuperTrend or a Pivot-based SuperTrend. Position sizing is risk‑based, with optional two‑step profit taking and automatic stop movement once price confirms in favor.
RECOMMENDED USE
Markets: Designed for Forex and equities, and readily adaptable to indices or liquid futures.
Timeframes: Performs best from 15m to 4h where momentum and trend layers both matter; daily can be used for confirmation/context.
Conditions: Trending or range‑expansion phases with clear volatility asymmetry. Avoid extremely compressed sessions unless thresholds are relaxed.
Strengths
Multi‑layer confluence (trend + skew + momentum) reduces random signals.
Dual SuperTrend modes provide flexible trailing and regime control.
Built‑in hygiene (ADX/DMI, lockout after loss, ATR gap) curbs over‑trading.
Risk‑% sizing and two‑step exits support consistent, plan‑driven execution.
Precautions
Over‑tight thresholds can lead to missed opportunities; start from defaults and tune gradually.
High sensitivity in momentum settings may overfit to a single instrument/timeframe.
In very low volatility, ATR‑gap or skew filters may block entries—consider adaptive thresholds.
CONCLUSION
VWolf – Pivot VumanSkew is a disciplined trend‑participation strategy that waits for directional structure, volatility asymmetry, and synchronized momentum before acting. Its execution layer—selectable between Normal and Pivot SuperTrend—keeps management pragmatic: scale out early when appropriate, trail intelligently, and defend capital with volatility‑aware stops. For users building a diversified playbook, Pivot VumanSkew serves as a trend‑continuation workhorse that can be tightened for precision or relaxed for higher participation depending on the market’s rhythm.
