Trade By Design – Free Edition (v0.1)A clean, high-performance session & liquidity framework designed to bring structure, clarity, and precision to your intraday trading.
This indicator is inspired by the Trade Travel Chill – Trade By Design methodology and provides a free, simplified version of the core concepts—ideal for day traders seeking to understand market structure, session behavior, and intraday liquidity dynamics.
🔍 What This Indicator Does
The Free Edition automatically maps the most important intraday levels and contextual factors that drive daily price delivery.
Key Features:
• HOW / LOW
• IHOD / ILOD / 50% Asia
• HOD / LOD
• PVSRA Candles
• Vector candles
• Perp autooverride
⚠️ Version Notice (v0.1 – Early Release)
This is an early, not all features are active yet.
This version focuses purely on the core structure, keeping everything lightweight and easy to use.
⚠️ Disclaimer
This is an unofficial free re-creation inspired by public concepts taught in the Trade By Design methodology.
It is not endorsed, affiliated with, or sponsored by TradeTravelChill.club or its owners.
If you enjoy this indicator and want the complete methodology, mentorship, and full system, please support the original creators by purchasing the official course at:
👉 tradetravelchill.club
Đường Trung bình trượt Hàm mũ (EMA)


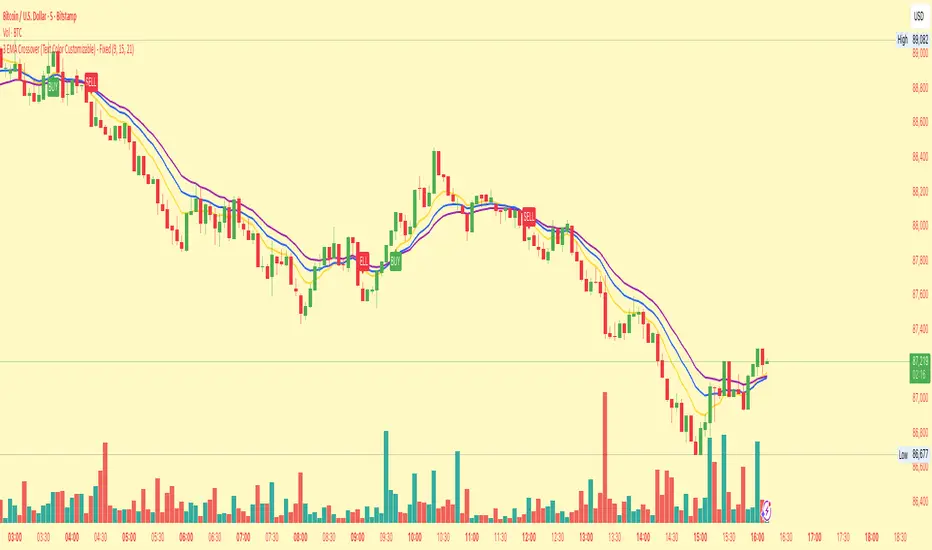
3 EMA Crossover (Text Color Customizable) - Fixed3 Ema crossover 9/15/21
it will generate buy and sell signal on crossover.
Anchor SafeSwing Gold StrategyOverview:
The Anchor SafeSwing Gold Strategy is designed for users who prefer structured, rule-based swing trading on XAUUSD. It focuses on identifying high-quality trade setups rather than frequent entries.
This strategy analyzes the market using multiple technical indicators and methods—including trend analysis, multi-chart confirmation, and support/resistance evaluation—to identify potential swing points. It also incorporates a dynamic approach to risk management through adaptive stop-loss and take-profit logic.
How the Strategy Works
1. Multi-Chart & Trend Analysis:
The strategy evaluates trend direction using several indicators and multiple charts. This helps determine whether the trend favors long or short setups.
2. Buy/Sell Conditions:
a. Buy Conditions: When the broader trend is identified as bullish, the strategy waits for the formation of a strong support zone before considering a long position.
b. Sell Conditions: When the trend is bearish, it waits for a confirmed resistance zone before initiating short positions.
3. Dynamic Take-Profit Logic
The strategy uses adaptive take-profit behavior based on evolving market conditions. It monitors new support/resistance structures and various overbought/oversold signals to dynamically exit trades.
4. Dynamic and Configurable Stop-Loss:
A flexible stop-loss system adjusts according to volatility and market structure.
Users can modify the stop-loss threshold in the settings based on their own risk tolerance and account size.
Trading Frequency :
This strategy focuses on select, high-quality setups. As a result, trade frequency is relatively low and may vary depending on market conditions. Backtesting may show roughly several trades per month, but actual live performance can differ.
Important Notes
All trading involves risk, and users should evaluate the strategy and adjust settings according to their own risk management preferences.

Triple 9 Bias filter Triple 9 Bias – Precision Multi-Timeframe Directional Filter
Technical Overview
The Triple 9 Bias is a precision multi-timeframe directional filter built exclusively for 5-minute (and lower) trading.
It stacks three EMA-9 trend directions (4H + 1H + 15m) as Primary confluence and uses only the 4H RSI-14 as Secondary confirmation.
Integrity Check: Zero repaint · Zero lookahead · Works identically on any chart timeframe.
The Trading Rule (Simple)
Long Trades: Only trade longs when all three EMA-9s are UP + 4H RSI > 50
Short Trades: Only trade shorts when all three EMA-9s are DOWN + 4H RSI < 50
Otherwise — stand aside.
Display Components
A. Plotted Higher-Timeframe EMAs (No Repainting)
All values are pulled from closed higher-timeframe bars.
4H EMA 9 (Red step-line)
1H EMA 9 (Purple step-line)
15m EMA 9 (Orange step-line)
B. Locked Dashboard (Bottom-Right)
Clean table split into Primary and Secondary sections for instant bias reading.
Colour Logic:
🟢 Lime = UP / BUY
🔴 Red = DOWN / SELL
Background Logic:
Full Green: Only when all three EMA-9s are UP
Full Red: Only when all three EMA-9s are DOWN
Gray: Otherwise = no trade
Indicator Breakdown
3.1. Primary Confluence – EMA 9 Slope
4H EMA 9 direction (compared 10 bars back)
1H EMA 9 direction (compared 6 bars back)
15m EMA 9 direction (compared 6 bars back)
3.2. Secondary Confluence
4H RSI-14 vs 50 level (BUY if >50, SELL if <50)
High-Probability Signal: When Primary = all three “UP” and Secondary = “BUY” → highest-probability bullish bias (and vice-versa for bearish).

Price Action - EMA ClusterAligned with Al Brooks' multi-timeframe analysis in his series, this plots three EMA20 lines on 5m charts: current (line), 15m (stepline), and 60m (stepline). Visible only on 5m timeframe for clarity. EMAs act as dynamic trend channels—price above signals bull bias, below bear. Test extremes: Pullbacks to EMA often offer second-leg entries in trends. Customize colors for better visualization of always-in direction.

Strict Weekly 50/200 WMA Signals True Weekly Only-Strict Weekly 50/200 WMA Signals True Weekly Only => also on other time frames than weekly (like daily, etc.) always indicates the indicators based on the weekly chart
-especially useful for Crypto
-gives buy and sell signals when the 200 WMA or the 50 WMA are crossed
-typically above the 50 WMA indicates a bull market
-reaching below the 200 WMA indicates a bear market and typically for investors with a longer time frame (>2-4 years) a good entry point

EMA Velocity Dual TF Momentum 1h (v2)BINANCE:SOLUSDT
The result is calculated on futures x10
### EMA Velocity Dual TF Momentum (v2) – Public Description
**Overview**
EMA Velocity Dual TF Momentum (v1) is a trend-following momentum strategy that uses the *speed of change* of Exponential Moving Averages (EMA) on two timeframes: the chart timeframe 1h.
The strategy looks for moments when both timeframes point in the same direction and the short‑term momentum is significantly stronger than usual, then manages trades with configurable ATR filtering, stop‑loss / take‑profit and early exit logic.
---
### Core Idea (high level, without formulas)
- On the **lower timeframe** (LTF), the strategy tracks how fast the EMA is moving (its “velocity”) and detects **impulse bars** where this velocity is unusually strong compared to its recent history.
- On the **higher timeframe** (HTF), it also measures EMA velocity and requires that the HTF trend direction is **aligned** with the LTF (both bullish or both bearish), if enabled.
- A **long trade** is opened when:
- LTF EMA velocity is positive (upward momentum),
- LTF momentum is strong enough (impulse),
- HTF EMA velocity is also upwards (if HTF filter is enabled),
- and ATR‑based volatility is above the minimum threshold.
- A **short trade** is opened in the symmetric situation (downward momentum on both timeframes).
- Positions are closed using configurable stop‑loss and take‑profit, and can be partially exited, moved to break‑even and trailed using early‑exit options.
---
### Inputs and Parameters
#### Trend & Momentum (Lower Timeframe)
- **`LTF EMA length (emaLenLTF)`**
Length of the EMA on the chart timeframe used to measure short‑term trend and momentum. Smaller values react faster; larger values are smoother and slower.
- **`LTF velocity lookback (velKLTF)`**
Lookback for computing EMA “velocity” on LTF. Controls how sensitive the momentum calculation is to recent price changes.
- **`LTF impulse lookback bars (impLookback)`**
Window size used to estimate the “normal” average absolute velocity. The strategy compares current momentum against this baseline to detect strong impulse moves.
- **`LTF |velocity| multiplier vs average (impMult)`**
Multiplier for defining what counts as a strong impulse. Higher values = fewer but stronger signals; lower values = more frequent, weaker impulses.
#### Trend & Momentum (Higher Timeframe)
- **`Use higher timeframe alignment (useHTF)`**
If enabled, trades are only taken when the higher‑timeframe EMA velocity confirms the same direction as the lower timeframe.
- **`HTF timeframe (htf_tf)`**
Higher timeframe used for confirmation (e.g. 60 minutes). Defines the “macro” context above the chart timeframe.
- **`HTF EMA length (emaLenHTF)`**
Length of the EMA on the higher timeframe. Controls how smooth and slow the higher‑timeframe trend filter is.
- **`HTF velocity lookback (velKHTF)`**
Lookback for the EMA velocity on HTF. Smaller values react quicker to changes in the higher‑timeframe trend.
#### Volatility / ATR Filter
- **`Use ATR filter (useAtrFilter)`**
Enables a volatility filter based on Average True Range. When active, trades are allowed only if market volatility is not too low.
- **`ATR Period (atrPeriod)`**
Lookback period for ATR calculation. Shorter periods react faster to recent volatility shifts; longer ones are more stable.
- **`ATR Min % for trading (atrMinPerc)`**
Minimum ATR as a percentage of price required to trade. Filters out very quiet, choppy periods where the strategy is more likely to be whipsawed.
#### Risk Management
- **`Use stops (SL/TP) (useStops)`**
Enables fixed stop‑loss and take‑profit exits. If disabled, positions are managed only by early exit logic and manual closing.
- **`Stop Loss % (stopLossPerc)`**
Distance of the protective stop from entry, in percent. Higher values give trades more room but increase risk per trade.
- **`Take Profit % (takeProfitPerc)`**
Distance of the primary profit target from entry, in percent. Controls the reward‑to‑risk profile of each trade.
#### Early Exit / Break‑Even / Trailing
- **`Enable early exit module (useEarlyExit)`**
Master switch for all early exit features: partial profit taking, break‑even stops and trailing exits.
- **`Take partial profit at +% (close 50%) (partialTP)`**
Profit level (in %) at which the strategy closes a partial portion of the position (e.g. 50%), locking in gains while leaving a runner.
- **`Trailing TP distance (%) (trailTP)`**
Distance (in %) for dynamic trailing stop after entry. When positive, the strategy trails the price to protect profits as the move extends.
- **`Break-even stop after +% profit (useBreakEven)`**
Enables automatic move of the stop to the entry price once a certain profit threshold is reached.
- **`Break-even activation (+%) (breakEvenPerc)`**
Profit level (in %) at which the stop is moved to break‑even. Higher values require a larger unrealized profit before break‑even protection kicks in.
#### Visuals
- **`Show labels (showLabels)`**
Toggles on‑chart labels that mark long and short entry signals for easier visual analysis.
- **`Label offset (labelOffset)`**
Horizontal offset (in bars) for placing labels relative to the signal bar. Used only for visual clarity; does not affect trading logic.
---
Если нужно, могу на основе этого текста сразу подготовить компактную версию (ограниченную по символам) специально под поле описания публичного скрипта в TradingView.

EMA Velocity Volatility Clamp (v1)A strategy based on the rate of price change using EMA.
Configured for the 5M Solana.
BINANCE:SOLUSDT

SMC Trend Filter Strategy (EMA50/EMA200 + FVG)Overview
This strategy implements a multi-timeframe Smart Money Concept (SMC) trading system designed for intraday and swing trading.
It combines a Daily trend filter, Break of Structure (BOS) detection, Order Block (OB) zones, Fair Value Gap (FVG) confirmation, and an ATR-based trailing stop system to achieve structured and rule-based entries.
The strategy is fully automated for backtesting and allows users to evaluate SMC concepts without repainting or discretionary interpretation.
- Core Components
1. Higher-Timeframe Trend Filter (Daily EMA50/EMA200)
The strategy retrieves D1 data and determines market direction using EMA50 and EMA200:
Uptrend → EMA50 > EMA200
Downtrend → EMA50 < EMA200
Trades are only taken in the direction of the Daily trend to avoid counter-trend setups.
2. Market Structure & Break of Structure (BOS)
The strategy identifies swing highs/lows and detects when price breaks beyond them:
Bullish BOS: price closes above previous swing high
Bearish BOS: price closes below previous swing low
This forms the foundation of SMC market structure recognition.
3. Order Block Zone (OB)
Upon detecting a BOS, the strategy marks the previous candle as a potential Order Block:
For bullish BOS → OB = previous candle’s high/low
For bearish BOS → OB = previous candle’s high/low
The OB zone is visualized using a semi-transparent box extended forward

Aquas TrendIt’s a trend-following crossover system with:
A local fast/slow EMA cross for timing entries
A higher-timeframe EMA filter to only trade in the dominant trend
An ATR-based volatility filter so it only trades when the market is moving
ATR-based stop loss and take profit with fixed RR
It tries to catch swings in the direction of the larger trend and ignore chop.
MTRA Pro+ ScreenerMTRA Pro+ Screener an analysis tool that provides traders with critical market structure information on up to 10 instruments simultaneously. This indicator consolidates momentum direction, trend analysis, range relationships, and volatility metrics into a single dashboard.
## Key Features
- Customizable display with adjustable positioning, colors, and sizing
**Momentum & Trend Tracking**
- Real-time momentum direction via 5-period SMA slope analysis
- Short-term trend direction using 10-period SMA slope analysis
- Color-coded visual representation for quick interpretation
**Range Relationship Analysis**
- Current bar analysis relative to previous period (Inside, Outside, 2Up, 2Dn)
- Three-period historical view of recent price action patterns
- Immediate identification of breakout and consolidation scenarios
**ATR-Based Volatility Analysis**
- Real-time ATR percentage calculations showing current range vs. average
- Visual distinction between normal (<100% ATR) and extended (>100% ATR) conditions
- Identification of potential exhaustion zones for risk management
**Intraday ATR Levels**
- Dynamic support/resistance levels based on current timeframe ATR
- Real-time upper and lower boundaries for precise entries/exits
- Customizable line styles integrated with price scale
## Practical Applications
- **Context Assessment**: Quickly gauge market conditions across multiple intraday timeframes
- **Exhaustion Detection**: Identify overextended moves when ATR exceeds 100%
- **Confluence Analysis**: Spot potential setups when timeframes align
- **Risk Management**: Some traders will use ATR levels for dynamic stops and position sizing
- **Breakout Confirmation**: Distinguish false breakouts from genuine momentum shifts
## Configuration Options
- Full dashboard positioning and color customization
- Individual timeframe toggles
- Adjustable ATR periods and sensitivity thresholds
- Multiple line styles for level visualization

HTF BIAS FILTER🧭HTF Bias Filter Indicator: 5 in 1 indicator
Technical Overview
The Bias Filter is a comprehensive multi-timeframe tool designed to confirm directional bias using five key indicators before entering a trade. It plots higher-timeframe Moving Averages directly on the chart and provides an immediate status summary via a static dashboard.
The more confluence on the dashboard, the greater the probability of the direction of the trade.
1. 📊 Display Components
A. Plotted Lines
The indicator uses the request.security function to draw Moving Averages from higher timeframes onto your current chart:
1H EMA 21 (Purple): The 21-period Exponential Moving Average calculated on the 1-Hour (60 min) chart. Plotted using a step-line style.
4H EMA 50 (Red): The 50-period Exponential Moving Average calculated on the 4-Hour (240 min) chart. Plotted using a step-line style.
B. Directional Dashboard
A fixed-position summary table is anchored to the bottom-right corner of the chart, providing a quick glance at the current status of all five filters.
2. 🎨 Colour Logic
Each of the five indicators is assigned a colour based on its current directional signal. The more indicators that show the same colour (confluence), the stronger the signal and the higher the likelihood of a high-probability trade.
🟢 Green indicators are signaling UP/BUY (Bullish momentum or trend).
🔴 Red indicators are signaling DOWN/SELL (Bearish momentum or trend).
⚫ Gray indicators are signaling Mixed or flat directions (neutral or undecided).
Note: The dashboard's main header color is determined by a strict confluence logic (All four 4H filters must align for Green/Red), while individual indicator colors follow the simple rules above.
3. 📋 Indicator Breakdown and Logic
The dashboard provides the direction of five different filters.
3.1. Higher-Timeframe (HTF) Trend Indicators
These two signals determine the immediate slope and direction of the primary Moving Averages:
4H EMA 50:
Timeframe: 4-Hour (240 min)
Logic: Compares the current EMA value to the value two bars ago on the 4H chart.
Output: UP ↑, DOWN ↓, or FLAT ⏸
1H EMA 21:
Timeframe: 1-Hour (60 min)
Logic: Compares the current EMA value to the value two bars ago on the 1H chart.
Output: UP ↑, DOWN ↓, or FLAT ⏸
3.2. 4-Hour Confluence Filters
These three indicators provide supplementary confirmation on Volume, Price Position, and Momentum, all calculated on the 4-Hour (240 min) chart:
4H OBV (Smoothed):
Timeframe: 4-Hour (240 min)
Logic: Direction is based on the current value of the 21-bar smoothed On-Balance Volume (OBV) compared to its value nine bars ago.
Output: UP ↑, DOWN ↓, or FLAT ⏸
4H ATR DIR (EMA Proxy):
Timeframe: 4-Hour (240 min)
Logic: Determines the price position by comparing the current Close price against the 4H EMA 50.
Output: BUY 🟢 (Close > EMA 50), SELL 🔴 (Close < EMA 50), or FLAT ⏸️ (Close = EMA 50).
4H RSI (14):
Timeframe: 4-Hour (240 min)
Logic: Momentum check comparing the 14-period Relative Strength Index (RSI) value against the 50 level.
Output: BUY 🟢 (RSI > 50), SELL 🔴 (RSI < 50), or FLAT ⏸️ (RSI = 50).

HybridWhales DAY TRADINGThis indicator offers a streamlined view of prevailing market trends on lower timeframes, empowering day traders to execute their strategies with greater precision
It incorporates two widely used exponential moving averages (EMAs)—the 50-period and 200-period—alongside an 800-period EMA, which effectively mirrors the 200-period EMA on the next higher timeframe. This setup provides enhanced flexibility, delivering multi-timeframe insights without the need to switch charts manually.
In addition, the indicator highlights essential intraday levels for quick reference:
Daily Open, denoted in yellow
Monday Highs, marked in red
Monday Lows, indicated in green
The indicator's core strength lies in its ability to detect market maker activity through color-coded candlesticks, based on volume analysis. Candles exhibiting significantly higher volume than the average of the prior eight candles are colored green (for bullish closes) or red (for bearish closes), signaling active market maker positioning—either entering shorts or longs.
Candles with moderately elevated volume (above average but not extreme) are shaded blue (bullish) or pink (bearish), suggesting market makers are accumulating short or long positions.
Interpretation is key: Red or pink candles (bearish) imply that market makers have initiated long positions, with price likely to revisit and fill these areas in the future. Conversely, green or blue candles (bullish) indicate market makers establishing shorts, anticipating a eventual pullback to these levels
To pinpoint the precise zones where price may return, the indicator places a white marker on each colored candle at its 50% retracement level, representing a fair value gap or imbalance.
Overall, this tool enables traders to spot market maker footprints, identify critical support and resistance zones, gauge weekly ranges, and assess potential momentum. While it fosters stronger confluence in analysis, results are not guaranteed and depend on individual trading execution.

Vital Wave 20-50Simplicity is almost always the most effective approach, and here I’m giving you a trend-following system that exploits the bullish bias of traditional markets and their trending nature, with very basic rules.
Rules (long entries only)
• Market entry: When the EMA 20 crosses above the EMA 50 (from below)
• Main market exit: When the EMA 20 crosses below the EMA 50 (from above)
• Fixed Stop Loss: Placed at the price level of the Lower Bollinger Band at the moment the trade is entered.
In my strategy, the primary exit is when the EMA 20 crosses below the EMA 50. However, this crossover can sometimes take a while to occur, and in the meantime the price may have already dropped significantly. The Stop Loss based on the Lower Bollinger Band is designed to limit losses in case the market moves sharply against the position without giving the bearish crossover signal in time. Having two exit conditions makes the strategy much more robust in terms of risk management.
Risk Management:
• Initial capital: $10,000
• Position size: 10% of available capital per trade
• Commissions: 0.1% on traded volume
• Stop Loss: Based on the Lower Bollinger Band
• Take Profit / Exit: When EMA 20 crosses below EMA 50
Recommended Markets:
XAUUSD (OANDA) (Daily)
Period: January 3, 1833 – November 23, 2025
Total Profit & Loss: +$6,030.62 USD (+57.57%)
Maximum Drawdown: $541.53 USD (3.83%)
Total Trades: 136
Winning Trades (Win Rate): 36.03% (49/136)
Profit Factor: 2.483
XAUUSD (OANDA) (12-hour)
Period: March 19, 2006 – November 23, 2025
Total Profit & Loss: +$1,209.56 USD (+11.89%)
Maximum Drawdown: $384.58 USD (3.61%)
Total Trades: 97
Winning Trades (Win Rate): 35.05% (34/97)
Profit Factor: 1.676
XAUUSD (OANDA) (8-hour)
Period: March 19, 2006 – November 23, 2025
Total Profit & Loss: +$1,179.36 USD (+11.81%)
Maximum Drawdown: $246.88 USD (2.32%)
Total Trades: 147
Winning Trades (Win Rate): 31.97% (47/147)
Profit Factor: 1.626
Tesla (NASDAQ) (4-hour)
Period: June 29, 2010 – November 23, 2025
Total Profit & Loss (Absolute): +$11,687.90 USD (+116.88%)
Maximum Drawdown: $922.05 USD (6.50%)
Total Trades: 68
Winning Trades (Win Rate): 39.71% (27/68)
Profit Factor: 4.156
Tesla (NASDAQ) (3-hour)
Total Profit & Loss: +$11,522.33 USD (+115.22%)
Maximum Drawdown: $1,247.60 USD (8.80%)
Total Trades: 114
Winning Trades: 33.33% (38/114)
Profit Factor: 2.811
Additional Recommendations
(These assets have shown good trending behavior with the same strategy across multiple timeframes):
• NVDA (15 min, 30 min, 1h, 2h, 3h, 4h, 6h, 8h, 12h, Daily)
• NFLX (1h, 2h, 3h, 4h, 6h, 8h, 12h, Daily)
• MA (1h, 2h, 3h, 4h, 6h, 8h, 12h, Daily)
• META (1h, 2h, 3h, 4h, 6h, 8h, 12h, Daily)
• AAPL (1h, 2h, 3h, 4h, 6h, 8h, 12h, Daily)
• SPY (12h, Daily)
About the Code
The user can modify:
• EMA periods (20 and 50 by default)
• Bollinger Bands length (20 periods)
• Standard deviation (2.0)
Visualization
• EMA 20: Blue line
• EMA 50: Red line
• Green background when EMA20 > EMA50 (bullish trend)
• Red background when EMA20 < EMA50 (bearish trend)
Important Note:
We can significantly increase the profit factor and overall profitability by risking a fixed percentage per trade instead of a fixed amount. This would prevent losses from fluctuating with changes in volatility.
This could be implemented by reducing position size or adjusting leverage based on the volatility percentage required for each trade, but I’m not sure if this is fully possible in Pine Script. In my other script, “ Golden Cross 50/200 EMA ,” I go deeper into this topic and provide examples.
I hope you enjoy this contribution. Best regards!

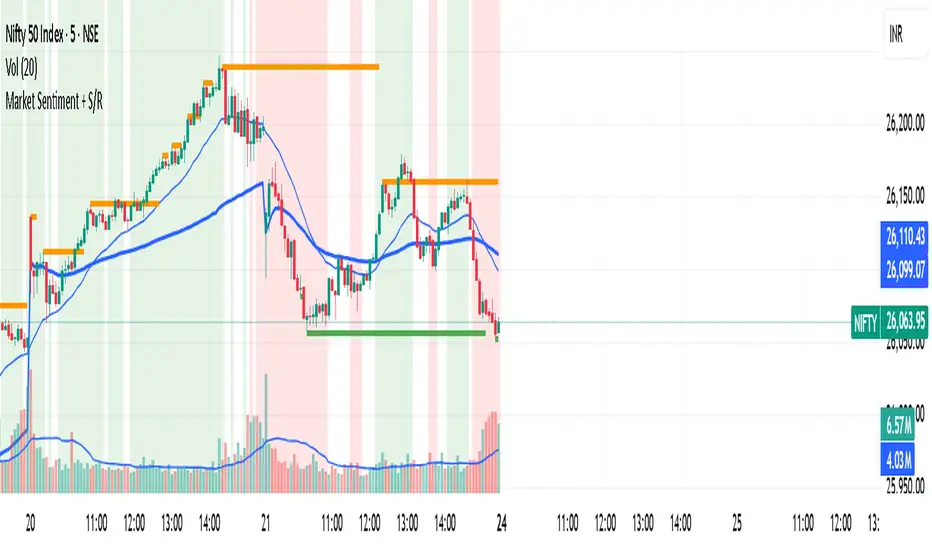
Market Sentiment + S/R KPRThis script is having VWAP and moving average cross overs. and also support and resistence.
HTF EMA Ribbon Bias by HammerGeekThis indicator displays a higher-timeframe EMA-ribbon bias directly on any lower-timeframe chart. It uses four EMAs (5, 9, 13, 21) computed on the selected higher timeframe and detects the directional “stacking” of those EMAs to determine trend bias:
Bullish: EMAs are strictly stacked 5 > 9 > 13 > 21 (fully separated, no overlap)
Bearish: EMAs are strictly stacked 5 < 9 < 13 < 21
Neutral: Any overlap, crossing, or mixed order between the four EMAs
The indicator shades the background to show the bias: green for bullish, red for bearish, yellow for neutral. A built-in toggle lets you choose whether the bias should update live from the current higher-timeframe candle (faster, but may repaint) or only after the higher-timeframe candle closes (slower, but non-repainting).
Designed for traders who want clean, instantly readable higher-timeframe context—especially when working on lower-timeframe charts such as 30m, 15m, or 5m.
All settings can be modified to suit users' desires.

MTF EMA Directional Bias -1hr and 4hr A compact, fixed-position table (bottom-right corner) that shows the current slope direction of two higher-timeframe EMAs:
4H EMA 50 → direction over the last 2 bars (UP ↑, DOWN ↓, or FLAT ⏸)
1H EMA 21 → direction over the last 2 bars (UP ↑, DOWN ↓, or FLAT ⏸)
Background color logic:
Green → both 4H and 1H EMAs are sloping upward
Red → both 4H and 1H EMAs are sloping downward
Gray → mixed or flat directions (no confluence)
Additionally draws the actual 1H EMA-21 (purple) and 4H EMA-50 (red) as step-lines on the chart.

Tripwire Pro+Tripwire – Trail-Based Trend Direction Indicator
OVERVIEW
Tripwire is a powerful, volatility-adaptive trailing indicator designed to keep traders on the right side of momentum while offering signals and alerts based on the users settings and filters.
CONCEPT & INSPIRATION
This indicator is directly inspired from the Zombie9Trail by Frosty (creator of the Zombie Pack and TickHunter for NinjaTrader).
When all filters are turned off, Tripwire replicates the core behavior of Zombie9Trail — delivering the same razor-sharp trailing logic.
Most of Frosty's testing has been done from the 1 minute time frame, while I have personally found for my style of trading the 5 minute time frame works better for me.
WHAT THIS VERSION ADDS — TradingView Enhancements
• Optional multi-layer trend filters (21, 34, 170 EMA) to separate high-probability pullbacks from actual trend changes
• Clean Buy/Sell/Pullback signal labels with alert conditions
• Real-time dashboard showing current trail value, trend state, and filter status
• Fully customizable ATR length, multiplier, source, and visual styling
• All values exported as plots — perfect for CSV download and strategy development
HOW TO USE
Filters ON (recommended for trend-following) → Take signals in the direction of the higher-timeframe trend. Great for staying in strong moves and avoiding fake outs.
Filters OFF (pure Zombie9Trail mode) → Possibly catch early reversals and ride new trends
CREDIT & RESPECT
Core trailing methodology and original genius: Frosty — creator of Zombie9Trail / Zombie Pack / TickHunter (NinjaTrader).
This TradingView adaptation was built in direct homage to his NinjaTrader work and with his encouragement. Everything beyond the base trailing logic (filters, dashboard, alerts, exportable plots, visual polish) is original.
DISCLAIMER
For educational and informational purposes only. Not financial advice. Past performance is no guarantee of future results. Test thoroughly.

9/21 EMA Trend TOP rIGHT CORNER INDICATORCrossover indicator for the 9 & 21 EMA. Buy Sell for cross up or down respectively. Daily, weekly and Monthly trend.

GBPUSD Weekly Cross LinesThis indicator tracks 20/50 EMA crossovers on GBPUSD (Weekly timeframe) and displays the crossover points across all symbols and timeframes, allowing traders to visually align current price action with key historical turning points in GBPUSD.
The script works by detecting bullish (20 EMA crossing above 50 EMA) and bearish (20 EMA crossing below 50 EMA) signals since 2010, using request.security() to source data from GBPUSD weekly candles, even if the indicator is applied to AAPL, EURJPY, BTCUSD, or any other asset.
Each crossover is marked with a vertical line that persists across all charts, offering a powerful way to:
Compare current market context with GBPUSD’s historical trend shifts
Observe intermarket correlations
Align trading timing across multiple assets
Spot macro trend transitions that ripple across global markets

