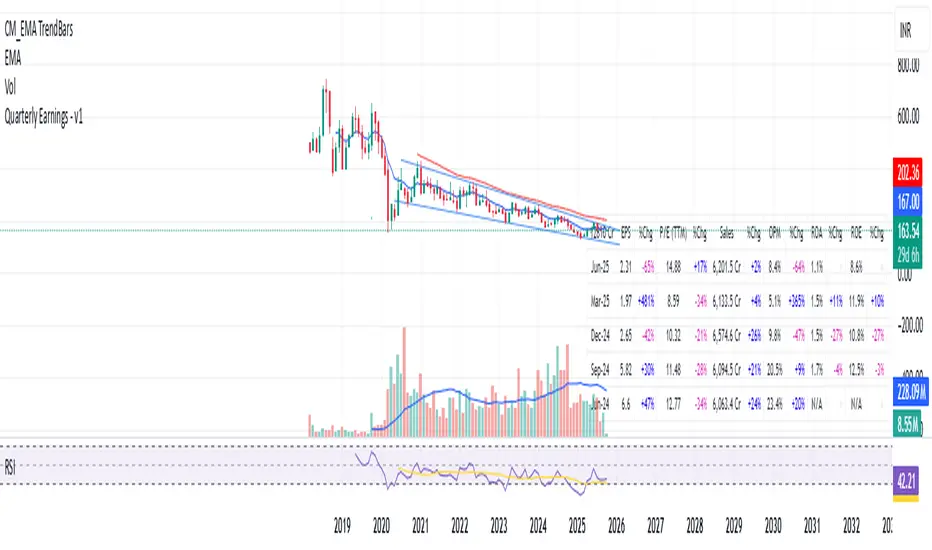
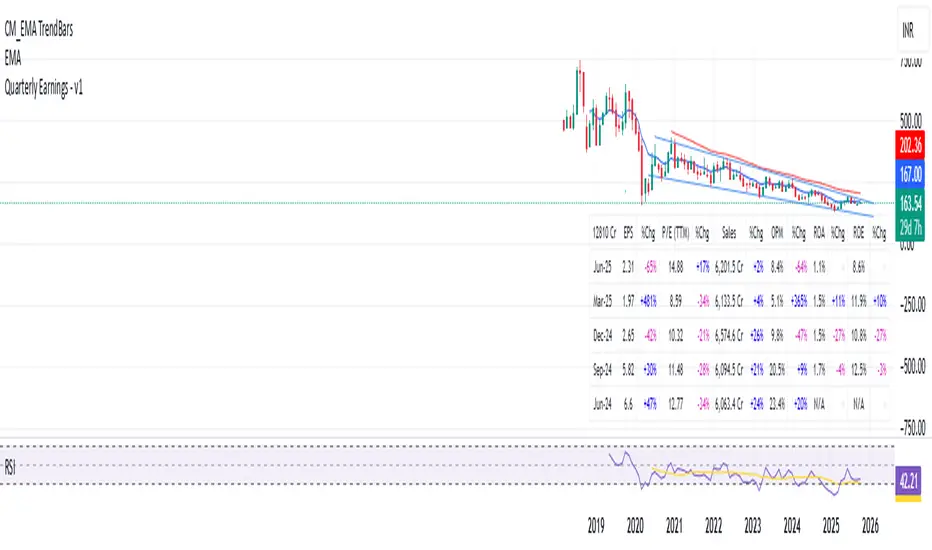
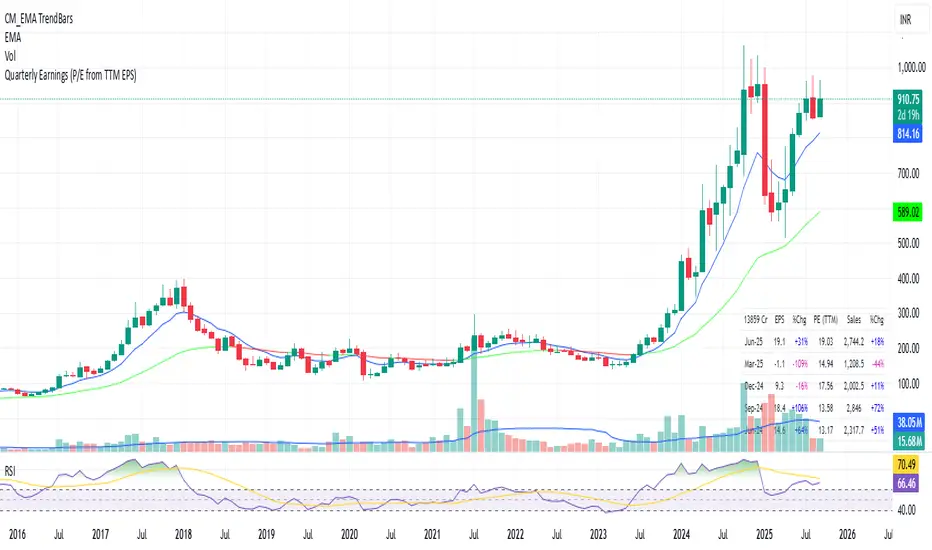
Quarterly Earnings - v1This script shows company fundamentals in a TradingView table: Earnings Per Share (EPS), Price-to-Earnings Ratio (P/E, TTM), Sales (in Crores), Operating Margin (OPM %), Return on Assets (ROA %), and Return on Equity (ROE %).
Phân tích Cơ bản
Quarterly Earnings - v1This script shows company fundamentals in a TradingView table: Earnings Per Share (EPS), Price-to-Earnings Ratio (P/E, TTM), Sales (in Crores), Operating Margin (OPM %), Return on Assets (ROA %), and Return on Equity (ROE %).
Quick Valuation V.1.0 (Ibo)This Pine Script indicator performs a Quick Discounted Cash Flow (DCF)-style Valuation to estimate the intrinsic value of a stock.
It calculates a projected Fair Value and a Margin of Safety based on user inputs or automatically pulled financial data from TradingView (like revenue, growth, margin, and exit P/E). It also automatically computes a Discount Rate using a modified CAPM model.
Key Features
Valuation Output: Calculates a target Fair Value and the resulting Margin of Safety.
Data Flexibility: Automatically pulls essential fundamentals (Revenue, Margins, Shares Outstanding, etc.) but allows the user to override any value (revenue, growth, P/E, shares, etc.) via the settings.
Automated Discount Rate: Calculates the Discount Rate (Cost of Equity) using the current 10-Year Real Yield and a computed or user-defined Beta.
Clear Display: Presents all input metrics, calculated values, and data sources (TradingView or User Input) in a neat table on the chart.

DCA vs One-ShotCompare a DCA strategy by choosing the payment frequency (daily, weekly, or monthly), and by choosing whether or not to pay on weekends for cryptocurrency. You can add fees and the reference price (opening, closing, etc.).

CMC Macro Regime PanelOverview (what it is):
A macro‑regime gate built entirely from TradingView-native symbols (CRYPTOCAP, FRED, DXY/VIX, HYG/LQD). It aggregates central‑bank liquidity (Fed balance sheet − RRP − Treasury General Account), USD strength, credit conditions, stablecoin flows/dominance, tech beta and BTC–NDX co‑move into one normalized score (CLRC). The panel outputs Risk‑ON/OFF regimes, an Early 3/5 pre‑signal, and an automatic BTC vs ETH vs ALTs preference. It is intentionally scoped to Daily & Weekly reads (no intraday timing). Publish with a clean chart and a clear description as per TradingView rules.
TradingView
Why we also use other TradingView screens (and why that is compliant)
This script pulls data via request.security() from official TV symbols only; users often want to open the raw series on separate charts to sanity‑check:
CRYPTOCAP indices: TOTAL, TOTAL2, TOTAL3 (market cap aggregates) and dominance tickers like BTC.D, USDT.D. Helpful for regime & rotation (ALTs vs BTC). TradingView provides definitions for crypto market cap and dominance symbols.
TradingView
+3
TradingView
+3
TradingView
+3
FRED releases: WALCL (Fed assets, weekly), RRPONTSYD (ON RRP, daily), WTREGEN (TGA, weekly), M2SL (M2, monthly). These are the official macro sources exposed on TV.
FRED
+3
FRED
+3
FRED
+3
Risk proxies: TVC:DXY (USD index), TVC:VIX (implied vol), AMEX:HYG/AMEX:LQD (credit), NASDAQ:NDX (tech beta), BINANCE:ETHBTC. VIX/NDX relationship is well-documented; VIX measures 30‑day expected S&P500 vol.
TradingView
+2
TradingView
+2
Compliance note: Using multiple screens is optional for users, but it explains/justifies how components work together (a requirement for public scripts). Keep publication chart clean; use extra screens only to illustrate in the description.
TradingView
How it works (high level)
Liquidity block (Weekly/Monthly)
Net Liquidity = WALCL − RRPONTSYD − WTREGEN (YoY z‑score). WALCL is weekly (as of Wednesday) via H.4.1; RRP is daily; TGA is a Fed liability series. M2 YoY is monthly.
FRED
+3
FRED
+3
FRED
+3
Risk conditions (Daily)
DXY 3‑month momentum (inverted), VIX level (inverted), Credit (HYG/LQD ratio or HY OAS). VIX is a 30‑day constant‑maturity implied vol index per Cboe methodology.
Cboe
+1
Crypto‑internal (Daily)
Stablecoins (USDT+USDC+DAI 30‑day log change), USDT dominance (20‑day, inverted), TOTAL3 (63‑day momentum). Dominance symbols on TV follow a documented formula.
TradingView
Beta & co‑move (Daily)
NDX 63‑day momentum, BTC↔NDX 90‑day correlation.
All components become z‑scores (optionally clipped), weighted, missing inputs drop and weights renormalize. We never use lookahead; we confirm on bar close to avoid repainting per Pine docs (barstate.isconfirmed, multi‑TF).
TradingView
+2
TradingView
+2
What you see on the chart
White line (CLRC) = macro regime score.
Background: Green = Risk‑ON, Red = Risk‑OFF, Teal = Early 3/5 (pre‑signal).
Table: shows each component’s z‑score and the Preference: BTC / ETH / ALTs / Mixed.
Signals & interpretation
Designed for Daily (1D) and Weekly (1W) only.
Regime gates (default Fast preset):
Enter ON: CLRC ≥ +0.8; Hold ON while ≥ +0.5.
Enter OFF: CLRC ≤ −1.0; Hold OFF while ≤ −0.5.
0 / ±1 reading: CLRC is a standardized composite.
~0 = neutral baseline (no macro edge).
≥ +1 = strong macro tailwind (≈ +1σ).
≤ −1 = strong headwind (≈ −1σ).
Early 3/5 (teal): a fast pre‑signal when at least 3 of 5 daily checks align: USDT.D↓, DXY↓, VIX↓, HYG/LQD↑, ETHBTC↑ or TOTAL3↑. It often precedes a full ON flip—use for pre‑positioning rather than full sizing.
BTC/ETH/ALTs selector (only when ON):
ALTs when BTC.D↓ and (ETHBTC↑ or TOTAL3↑) ⇒ rotate down the risk curve.
BTC when BTC.D↑ and ETHBTC↓ ⇒ keep it concentrated.
ETH when ETHBTC↑ while BTC.D flat/up ⇒ add ETH beta.
(Dominance mechanics are documented by TV.)
TradingView
Dissonance (incompatibility) rules — when to stand down
Use these overrides to avoid false comfort:
CLRC > +1 but USDT.D↑ and/or VIX spikes day‑over‑day → downgrade to Neutral; wait for USDT.D to stabilize and VIX to cool (VIX is a fear gauge of 30‑day expectation).
Cboe Global Markets
CLRC > +1 but DXY↑ sharply (USD squeeze) → size below normal; require DXY momentum to roll over.
CLRC < −1 but Early 3/5 = true two days in a row → start reducing underweights; look for ON flip within a few bars.
NetLiq improving (W) but credit (HYG/LQD) deteriorating (D) → treat as mixed regime; prefer BTC over ALTs.
How to use (step‑by‑step)
A. Read on Daily (1D) — main regime
Open CRYPTOCAP:TOTAL3, 1D (panel applied).
Wait for bar close (use alerts on confirmed bar). Pine docs recommend barstate.isconfirmed to avoid repainting on realtime bars.
TradingView
If ON, check Preference (BTC / ETH / ALTs).
Then drop to 4H on your trading pair for micro entries (this indicator itself is not for intraday timing).
B. Confirm weekly macro (1W) — once per week)
Review WALCL/RRP/TGA after the H.4.1 release on Thursdays ~4:30 pm ET. WALCL is “Weekly, as of Wednesday”; M2 is Monthly—so do not expect daily responsiveness from these.
Federal Reserve
+2
FRED
+2
Recommended check times (practical schedule)
Daily regime read: right after your chart’s daily close (confirmed bar). For consistent timing across crypto, many users set chart timezone to UTC and read ~00:05 UTC; you can change chart timezone in TV’s settings.
TradingView
In‑day monitoring: optional spot checks 16:00 & 20:00 UTC (DXY/VIX move during US hours), but act only after the daily bar confirms.
Weekly macro pass: Thu 21:30–22:30 UTC (after H.4.1 4:30 pm ET) or Fri after daily close, to let weekly FRED series propagate.
Federal Reserve
Limitations & data latency (be explicit)
Higher‑TF data & confirmation: FRED weekly/monthly series will not reflect intraday risk in crypto; we aggregate them for regime, not for entry timing.
Repainting 101: Realtime bars move until close. This script does not use lookahead and follows Pine guidance on multi‑TF series; still, always act on confirmed bars.
TradingView
+1
Public‑library compliance: Title EN‑only; description starts in EN; clean chart; justify component mash‑up; no lookahead; no unrealistic claims.
TradingView
Alerts you can use
“Macro Risk‑ON (entry)” — fires on ON flip (confirmed bar).
“Macro Risk‑OFF (entry)” — fires on OFF flip.
“Early 3/5” — fires when the teal pre‑signal appears (not a regime flip).
“Preference change” — BTC/ETH/ALTs toggles while ON.
Publish note: Alerts are fine; just avoid implying guaranteed accuracy/performance.
TradingView
Background research (why these inputs matter)
Liquidity → Crypto: Fed H.4.1 timing and series definitions (WALCL, RRP, TGA) formalize the “net liquidity” concept used here.
FRED
+3
Federal Reserve
+3
FRED
+3
Stablecoins ↔ Non‑stable crypto: empirical work shows bi‑directional causality between stablecoin market cap and non‑stable crypto cap; stablecoin growth co‑moves with broader crypto activity.
Global liquidity link: world liquidity positively relates to total crypto market cap; lagged effects are observed at monthly horizons.
VIX/Uncertainty effect: fear shocks impair BTC’s “safe haven” behavior; VIX is a meaningful risk‑off read.

ICT 369 Sniper MSS Indicator (HTF Bias) - H2LThis script is an ICT (Inner Circle Trader) concept-based trading indicator designed to identify high-probability reversal or continuation setups, primarily focusing on intraday trading using a Higher Timeframe (HTF) directional bias.
Here are the four core components of the indicator:
Higher Timeframe (HTF) Bias Filter (Market Structure Shift - MSS): It determines the overall trend by checking if the current price has broken the most recent high or low swing point of a larger timeframe (e.g., 4H). This establishes a Bullish or Bearish bias, ensuring trades align with the dominant trend.
Fair Value Gap (FVG) and OTE: It identifies price imbalances (FVGs) and calculates the Optimal Trade Entry (OTE) levels (50%, 62%, 70.5%, etc.) within those gaps, looking for price to retrace into these specific areas.
Kill Zones (Timing): It incorporates specific time windows (London and New York Kill Zones, based on NY Time) where institutional trading activity is high, only allowing entry signals during these defined periods.
Signal and Targets: It triggers a Long or Short signal when all criteria are met (HTF Bias, FVG, OTE retracement, and Kill Zone timing). It then calculates and plots suggested trade levels, including a Stop Loss (SL) and three Take Profit targets (TP1, TP2, and a dynamic Runner Target based on the weekly Average True Range or ATR).
In summary, it's a comprehensive tool for traders following ICT principles, automating the confluence check across trend, structure, liquidity, and timing.

Macro & Earnings Dashboard — NY Fed CalendarMacro & Earnings Dashboard — NY Fed Calendar
This is an overlay indicator designed to provide a quick, real-time overview of the most critical upcoming US economic data releases and corporate earnings reports directly on your TradingView chart. It functions as a dynamic dashboard, removing the need to constantly check external calendars.
Key Features
1. Real-Time Economic Calendar (Bottom-Right Table)
The dashboard tracks the time remaining until the next release of five major, high-impact economic indicators. The data for these dates is pre-loaded directly from the New York Fed Economic Indicators Calendar (currently loaded for October through December 2025).
The tracked events include:
CPI (Consumer Price Index)
PPI (Producer Price Index)
Employment Situation (Non-Farm Payrolls / Unemployment Rate)
Interest Rate Decision (FOMC Meetings)
Consumer Sentiment (University of Michigan Survey)
2. Corporate Earnings Tracker (Top-Right Table)
This table uses TradingView's built-in data to calculate the estimated days remaining until the next Earnings Per Share (EPS) report for a curated list of high-profile NASDAQ tickers:
AAPL, NVDA, GOOG, TSLA, MSFT, AMZN, META
3. Color-Coded Urgency
The "Days" column for both macro and earnings tables uses a traffic light system to instantly communicate how soon the event is:
Red: The event is scheduled for Today or Tomorrow (0–1 day away).
Orange: The event is scheduled for the current week (within 6 days).
Teal: The event is more than a week away.
Gray: The date is currently unavailable or outside the loaded calendar range.

Quarterly EarningsEarnings Per Share (EPS), Price-to-Earnings Ratio (P/E, TTM), Sales (in Crores), Operating Margin (OPM %), Return on Assets (ROA %), and Return on Equity (ROE %). Each metric includes its absolute value and quarter-over-quarter or year-over-year percentage change.

Quarterly EarningsThis Pine script shows quarterly EPS, Sales, and P/E (TTM-based) in a styled table.
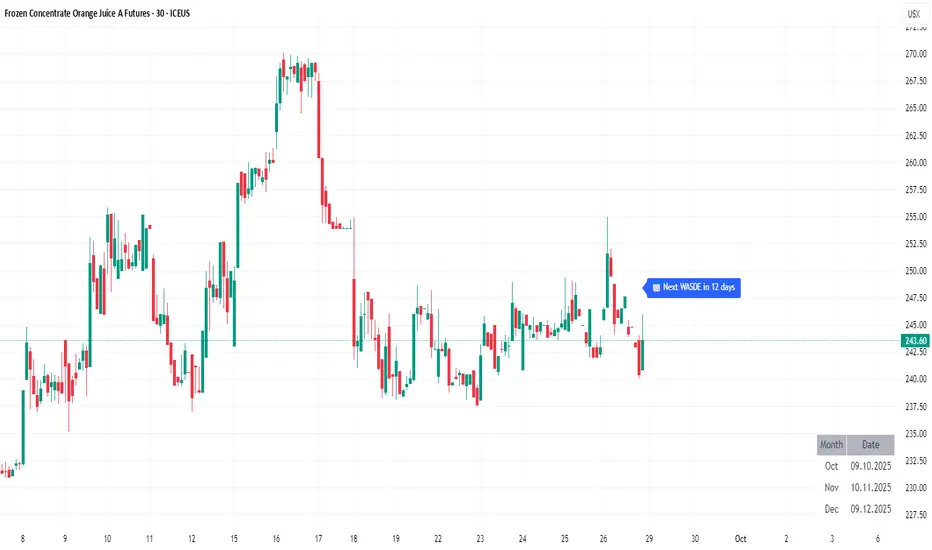
WASDE DatesOverview
WASDE Dates — a small, focused event indicator that displays confirmed USDA WASDE release dates for 2025 on the chart and marks each release day. The indicator is designed to be a lightweight timing tool for traders who want clean visual reminders and optional alerts around USDA WASDE publications.
Features
• Shows official WASDE release dates for 2025 in a compact chart table.
• Draws on-chart markers and a dotted vertical line on WASDE release days.
• Two alert conditions you can enable in TradingView: "WASDE Day Alert" and "WASDE 24h Reminder".
• Simple table position control (Top/Bottom, Left/Right) in the indicator settings.
• Minimal, self-contained code — no external data feeds or permissions required.
How to use
1. Apply the indicator to any chart and timeframe.
2. Use the indicator settings to choose table position.
3. Enable Alerts (if desired) via TradingView Alerts → choose “WASDE Day Alert” or “WASDE 24h Reminder”.
4. This version contains 2025 confirmed dates only — verify dates for live trading and enable alerts as needed.
Design & rationale
This indicator is intentionally not a technical trading signal. It is an event scheduler focused on clarity and low overhead: combine it with your existing setup to avoid being surprised by WASDE publications and to quickly inspect price action around these event dates.
Limitations & disclaimer
• This script shows **confirmed 2025** WASDE dates only. It does not provide trading advice or entry/exit signals. Use at your own risk.
• Double-check official USDA publishing times before executing trades.
• No external links or contact information are included in this description to comply with TradingView publishing rules.
Feature outlook (V2)
Planned V2 (future release): enhanced countdown (days → hours/minutes), optional inclusion of estimated 2026 dates marked as (TBC), and an invite-only/protected advanced version with reaction overlays (T+1/T+3) and extended alert options. V2 will be announced on this script page when ready.
Changelog
v1 — public release: 2025 confirmed dates, release markers, alerts, table position control.
NY 14:30 High/Low - 1mThis indicator automatically draws horizontal lines for the High (green) and Low (red) of the 14:30 (Lisbon) candle on the 1-minute chart.
It is designed for traders who want to quickly identify the New York open levels (NY Open), allowing you to:
Visualize the NY market opening zone.
Use these levels as intraday support or resistance.
Plan entries and exits based on breakouts or pullbacks.
Features:
Works on any 1-minute chart.
Lines are drawn immediately after the 14:30 candle closes.
Lines extend automatically to the right.
Simple and lightweight, no complex variables or external dependencies.
Daily reset, always showing the current day’s levels.
Recommended Use:
Combine with support/resistance zones, order blocks, or fair value gaps.
Monitor price behavior during the NY open to identify breakout or rejection patterns.

ORB 15m + MAs (v4.1)Session ORB Live Pro — Pre-Market Boxes & MA Suite (v4.1)
What it is
A precision Opening Range Breakout (ORB) tool that anchors every session to one specific 15-minute candle—then projects that same high/low onto lower timeframes so your 1m/5m levels always match the source 15m bar. Perfect for scalpers who want session structure without drift.
What it draws
Asia, Pre-London, London, Pre-New York, New York session boxes.
On 15m: only the high/low of the first 15-minute bar of each window (optionally persists for extra bars).
On 5m: mirrors the same 15m range, visible up to 10 bars.
On 1m: mirrors the same 15m range, visible up to 15 bars.
Levels update live while the 15m candle is forming, then lock.
Fully editable windows (easy UX)
Change session times with TradingView’s native input.session fields using the familiar format HHMM-HHMM:1234567. You can tweak each window independently:
Asia
Pre-London
London
Pre-New York
New York
Multi-TF logic (no guesswork)
Designed to show only on 1m, 5m, 15m (by default).
15m = ground truth. Lower timeframes never “recalculate a different range”—they mirror the 15m bar for that session, exactly.
Alerts
Optional breakout alerts when price closes above/below the session range.
Clean visuals
Per-session color controls (box + lines). Boxes extend only for the configured number of bars per timeframe, keeping charts uncluttered.
Built-in MA suite
SMA 50 and RMA 200.
Three extra MAs (SMA/EMA/RMA/WMA/HMA) with selectable color, width, and style (line, stepline, circles).
Why traders like it
Consistency: Lower-TF ranges always match the 15m source bar.
Speed: You see structure immediately—no waiting for N bars.
Control: Edit session times directly; tune how long boxes stay on chart per TF.
Clarity: Minimal, purposeful plotting with alerts when it matters.
Quick start
Set your session times via the five input.session fields.
Choose how long boxes persist on 1m/5m/15m.
Enable alerts if you want instant breakout notifications.
(Optional) Configure the MA suite for trend/bias context.
Best for
Intraday traders and scalpers who rely on repeatable session behavior and demand exact cross-TF alignment of ORB levels.

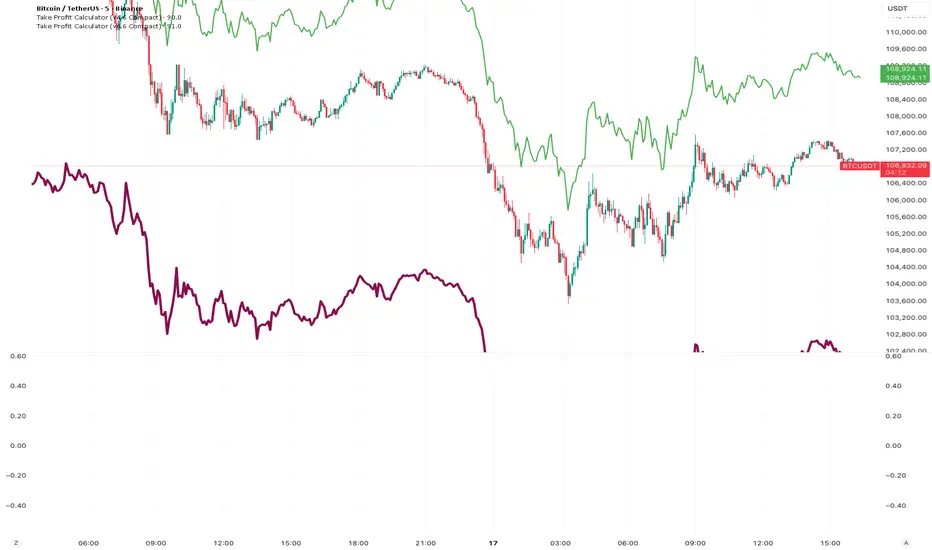
Take Profit CalculatorRelease Notes: Take Profit Calculator v1.0
Introduction
Introducing the Real-Time Take Profit Calculator, a dynamic tool for TradingView designed to instantly calculate and display your target exit price. This indicator eliminates the need for manual calculations, allowing scalpers and day traders to see their profit targets directly on the chart as the market moves.
Key Features
Dynamic Target Calculation: The take-profit line is not static. It recalculates on every tick, moving with the current price to show you the exact target based on a real-time entry point.
Full Trade Customization:
Margin: Set the amount of capital (in USDT) you are allocating to the trade.
Leverage: Input your desired leverage to accurately calculate the total position size.
Desired Profit: Specify your target profit in USDT, and the indicator will calculate the corresponding price level.
Long & Short Support: Easily switch between "Long" and "Short" trade directions. The indicator will adjust the calculation and the visual style accordingly.
Customizable Display:
Change the color and width of the take-profit line for both long and short scenarios.
Toggle a price label on or off for a cleaner chart view.
How to Use
Add to Chart: Apply the "Take Profit Calculator" indicator to your chart.
Open Settings: Double-click the indicator name or the line itself to open the settings panel.
Enter Your Parameters: Under "Trade Parameters," fill in your Margin, Leverage, and Desired Profit.
Select Direction: Choose either "Long" or "Short" from the Trade Direction dropdown.
Analyze: The horizontal line on your chart now represents the exact price you need to reach
Elliott Wave Auto (Impulse + Correction) — stable deleteAutomatic pivot detection: The script identifies swing highs and swing lows using ta.pivothigh and ta.pivotlow.
Impulse wave labeling (1–5):
Detects 5 alternating pivots and labels them as waves 1 to 5.
Uses green/red labels for impulse and correction legs.
Connects waves with blue lines for visual clarity.
Corrective wave labeling (A–B–C):
Detects the next 3 alternating pivots after wave 5.
Labels them as A, B, C with orange lines connecting them.
Dynamic cleanup:
Stores labels and lines in arrays.
Deletes previous drawings automatically before redrawing, keeping the chart clean.
Optional pivot markers:
Plots tiny triangles for detected pivots (green for lows, red for highs).
Information table:
Displays the direction (Bullish/Bearish) and percentage move of the 1–5 impulse waves.
Pine Script v5 compliant:
Uses str.tostring() and array-based deletion to avoid tostring() or line.deleteall() errors.
If you want, I can also add an alert feature to notify you when a full impulse + corrective wave pattern completes. This makes it actionable for trading.

FRANJAS POR FECHAS - RSDescription:
This indicator allows you to highlight specific dates on your chart with vertical background stripes, similar to a session indicator.
Input your dates in the format DD.MM.YYYY (you can separate them with commas, spaces, line breaks, or semicolons).
The script automatically normalizes the format and applies a shaded vertical band for each matching day.
Works on daily and intraday charts: in intraday, the shading will cover the full trading day.
Options available to adjust the color and transparency of the stripes.
Optional dotted lines can be enabled at the start and end of each highlighted day.
This is useful for marking important events such as FOMC meetings, earnings releases, economic data announcements, or any custom list of key dates you want to track directly on your chart.

Small Business Economic Conditions - Statistical Analysis ModelThe Small Business Economic Conditions Statistical Analysis Model (SBO-SAM) represents an econometric approach to measuring and analyzing the economic health of small business enterprises through multi-dimensional factor analysis and statistical methodologies. This indicator synthesizes eight fundamental economic components into a composite index that provides real-time assessment of small business operating conditions with statistical rigor. The model employs Z-score standardization, variance-weighted aggregation, higher-order moment analysis, and regime-switching detection to deliver comprehensive insights into small business economic conditions with statistical confidence intervals and multi-language accessibility.
1. Introduction and Theoretical Foundation
The development of quantitative models for assessing small business economic conditions has gained significant importance in contemporary financial analysis, particularly given the critical role small enterprises play in economic development and employment generation. Small businesses, typically defined as enterprises with fewer than 500 employees according to the U.S. Small Business Administration, constitute approximately 99.9% of all businesses in the United States and employ nearly half of the private workforce (U.S. Small Business Administration, 2024).
The theoretical framework underlying the SBO-SAM model draws extensively from established academic research in small business economics and quantitative finance. The foundational understanding of key drivers affecting small business performance builds upon the seminal work of Dunkelberg and Wade (2023) in their analysis of small business economic trends through the National Federation of Independent Business (NFIB) Small Business Economic Trends survey. Their research established the critical importance of optimism, hiring plans, capital expenditure intentions, and credit availability as primary determinants of small business performance.
The model incorporates insights from Federal Reserve Board research, particularly the Senior Loan Officer Opinion Survey (Federal Reserve Board, 2024), which demonstrates the critical importance of credit market conditions in small business operations. This research consistently shows that small businesses face disproportionate challenges during periods of credit tightening, as they typically lack access to capital markets and rely heavily on bank financing.
The statistical methodology employed in this model follows the econometric principles established by Hamilton (1989) in his work on regime-switching models and time series analysis. Hamilton's framework provides the theoretical foundation for identifying different economic regimes and understanding how economic relationships may vary across different market conditions. The variance-weighted aggregation technique draws from modern portfolio theory as developed by Markowitz (1952) and later refined by Sharpe (1964), applying these concepts to economic indicator construction rather than traditional asset allocation.
Additional theoretical support comes from the work of Engle and Granger (1987) on cointegration analysis, which provides the statistical framework for combining multiple time series while maintaining long-term equilibrium relationships. The model also incorporates insights from behavioral economics research by Kahneman and Tversky (1979) on prospect theory, recognizing that small business decision-making may exhibit systematic biases that affect economic outcomes.
2. Model Architecture and Component Structure
The SBO-SAM model employs eight orthogonalized economic factors that collectively capture the multifaceted nature of small business operating conditions. Each component is normalized using Z-score standardization with a rolling 252-day window, representing approximately one business year of trading data. This approach ensures statistical consistency across different market regimes and economic cycles, following the methodology established by Tsay (2010) in his treatment of financial time series analysis.
2.1 Small Cap Relative Performance Component
The first component measures the performance of the Russell 2000 index relative to the S&P 500, capturing the market-based assessment of small business equity valuations. This component reflects investor sentiment toward smaller enterprises and provides a forward-looking perspective on small business prospects. The theoretical justification for this component stems from the efficient market hypothesis as formulated by Fama (1970), which suggests that stock prices incorporate all available information about future prospects.
The calculation employs a 20-day rate of change with exponential smoothing to reduce noise while preserving signal integrity. The mathematical formulation is:
Small_Cap_Performance = (Russell_2000_t / S&P_500_t) / (Russell_2000_{t-20} / S&P_500_{t-20}) - 1
This relative performance measure eliminates market-wide effects and isolates the specific performance differential between small and large capitalization stocks, providing a pure measure of small business market sentiment.
2.2 Credit Market Conditions Component
Credit Market Conditions constitute the second component, incorporating commercial lending volumes and credit spread dynamics. This factor recognizes that small businesses are particularly sensitive to credit availability and borrowing costs, as established in numerous Federal Reserve studies (Bernanke and Gertler, 1995). Small businesses typically face higher borrowing costs and more stringent lending standards compared to larger enterprises, making credit conditions a critical determinant of their operating environment.
The model calculates credit spreads using high-yield bond ETFs relative to Treasury securities, providing a market-based measure of credit risk premiums that directly affect small business borrowing costs. The component also incorporates commercial and industrial loan growth data from the Federal Reserve's H.8 statistical release, which provides direct evidence of lending activity to businesses.
The mathematical specification combines these elements as:
Credit_Conditions = α₁ × (HYG_t / TLT_t) + α₂ × C&I_Loan_Growth_t
where HYG represents high-yield corporate bond ETF prices, TLT represents long-term Treasury ETF prices, and C&I_Loan_Growth represents the rate of change in commercial and industrial loans outstanding.
2.3 Labor Market Dynamics Component
The Labor Market Dynamics component captures employment cost pressures and labor availability metrics through the relationship between job openings and unemployment claims. This factor acknowledges that labor market tightness significantly impacts small business operations, as these enterprises typically have less flexibility in wage negotiations and face greater challenges in attracting and retaining talent during periods of low unemployment.
The theoretical foundation for this component draws from search and matching theory as developed by Mortensen and Pissarides (1994), which explains how labor market frictions affect employment dynamics. Small businesses often face higher search costs and longer hiring processes, making them particularly sensitive to labor market conditions.
The component is calculated as:
Labor_Tightness = Job_Openings_t / (Unemployment_Claims_t × 52)
This ratio provides a measure of labor market tightness, with higher values indicating greater difficulty in finding workers and potential wage pressures.
2.4 Consumer Demand Strength Component
Consumer Demand Strength represents the fourth component, combining consumer sentiment data with retail sales growth rates. Small businesses are disproportionately affected by consumer spending patterns, making this component crucial for assessing their operating environment. The theoretical justification comes from the permanent income hypothesis developed by Friedman (1957), which explains how consumer spending responds to both current conditions and future expectations.
The model weights consumer confidence and actual spending data to provide both forward-looking sentiment and contemporaneous demand indicators. The specification is:
Demand_Strength = β₁ × Consumer_Sentiment_t + β₂ × Retail_Sales_Growth_t
where β₁ and β₂ are determined through principal component analysis to maximize the explanatory power of the combined measure.
2.5 Input Cost Pressures Component
Input Cost Pressures form the fifth component, utilizing producer price index data to capture inflationary pressures on small business operations. This component is inversely weighted, recognizing that rising input costs negatively impact small business profitability and operating conditions. Small businesses typically have limited pricing power and face challenges in passing through cost increases to customers, making them particularly vulnerable to input cost inflation.
The theoretical foundation draws from cost-push inflation theory as described by Gordon (1988), which explains how supply-side price pressures affect business operations. The model employs a 90-day rate of change to capture medium-term cost trends while filtering out short-term volatility:
Cost_Pressure = -1 × (PPI_t / PPI_{t-90} - 1)
The negative weighting reflects the inverse relationship between input costs and business conditions.
2.6 Monetary Policy Impact Component
Monetary Policy Impact represents the sixth component, incorporating federal funds rates and yield curve dynamics. Small businesses are particularly sensitive to interest rate changes due to their higher reliance on variable-rate financing and limited access to capital markets. The theoretical foundation comes from monetary transmission mechanism theory as developed by Bernanke and Blinder (1992), which explains how monetary policy affects different segments of the economy.
The model calculates the absolute deviation of federal funds rates from a neutral 2% level, recognizing that both extremely low and high rates can create operational challenges for small enterprises. The yield curve component captures the shape of the term structure, which affects both borrowing costs and economic expectations:
Monetary_Impact = γ₁ × |Fed_Funds_Rate_t - 2.0| + γ₂ × (10Y_Yield_t - 2Y_Yield_t)
2.7 Currency Valuation Effects Component
Currency Valuation Effects constitute the seventh component, measuring the impact of US Dollar strength on small business competitiveness. A stronger dollar can benefit businesses with significant import components while disadvantaging exporters. The model employs Dollar Index volatility as a proxy for currency-related uncertainty that affects small business planning and operations.
The theoretical foundation draws from international trade theory and the work of Krugman (1987) on exchange rate effects on different business segments. Small businesses often lack hedging capabilities, making them more vulnerable to currency fluctuations:
Currency_Impact = -1 × DXY_Volatility_t
2.8 Regional Banking Health Component
The eighth and final component, Regional Banking Health, assesses the relative performance of regional banks compared to large financial institutions. Regional banks traditionally serve as primary lenders to small businesses, making their health a critical factor in small business credit availability and overall operating conditions.
This component draws from the literature on relationship banking as developed by Boot (2000), which demonstrates the importance of bank-borrower relationships, particularly for small enterprises. The calculation compares regional bank performance to large financial institutions:
Banking_Health = (Regional_Banks_Index_t / Large_Banks_Index_t) - 1
3. Statistical Methodology and Advanced Analytics
The model employs statistical techniques to ensure robustness and reliability. Z-score normalization is applied to each component using rolling 252-day windows, providing standardized measures that remain consistent across different time periods and market conditions. This approach follows the methodology established by Engle and Granger (1987) in their cointegration analysis framework.
3.1 Variance-Weighted Aggregation
The composite index calculation utilizes variance-weighted aggregation, where component weights are determined by the inverse of their historical variance. This approach, derived from modern portfolio theory, ensures that more stable components receive higher weights while reducing the impact of highly volatile factors. The mathematical formulation follows the principle that optimal weights are inversely proportional to variance, maximizing the signal-to-noise ratio of the composite indicator.
The weight for component i is calculated as:
w_i = (1/σᵢ²) / Σⱼ(1/σⱼ²)
where σᵢ² represents the variance of component i over the lookback period.
3.2 Higher-Order Moment Analysis
Higher-order moment analysis extends beyond traditional mean and variance calculations to include skewness and kurtosis measurements. Skewness provides insight into the asymmetry of the sentiment distribution, while kurtosis measures the tail behavior and potential for extreme events. These metrics offer valuable information about the underlying distribution characteristics and potential regime changes.
Skewness is calculated as:
Skewness = E / σ³
Kurtosis is calculated as:
Kurtosis = E / σ⁴ - 3
where μ represents the mean and σ represents the standard deviation of the distribution.
3.3 Regime-Switching Detection
The model incorporates regime-switching detection capabilities based on the Hamilton (1989) framework. This allows for identification of different economic regimes characterized by distinct statistical properties. The regime classification employs percentile-based thresholds:
- Regime 3 (Very High): Percentile rank > 80
- Regime 2 (High): Percentile rank 60-80
- Regime 1 (Moderate High): Percentile rank 50-60
- Regime 0 (Neutral): Percentile rank 40-50
- Regime -1 (Moderate Low): Percentile rank 30-40
- Regime -2 (Low): Percentile rank 20-30
- Regime -3 (Very Low): Percentile rank < 20
3.4 Information Theory Applications
The model incorporates information theory concepts, specifically Shannon entropy measurement, to assess the information content of the sentiment distribution. Shannon entropy, as developed by Shannon (1948), provides a measure of the uncertainty or information content in a probability distribution:
H(X) = -Σᵢ p(xᵢ) log₂ p(xᵢ)
Higher entropy values indicate greater unpredictability and information content in the sentiment series.
3.5 Long-Term Memory Analysis
The Hurst exponent calculation provides insight into the long-term memory characteristics of the sentiment series. Originally developed by Hurst (1951) for analyzing Nile River flow patterns, this measure has found extensive application in financial time series analysis. The Hurst exponent H is calculated using the rescaled range statistic:
H = log(R/S) / log(T)
where R/S represents the rescaled range and T represents the time period. Values of H > 0.5 indicate long-term positive autocorrelation (persistence), while H < 0.5 indicates mean-reverting behavior.
3.6 Structural Break Detection
The model employs Chow test approximation for structural break detection, based on the methodology developed by Chow (1960). This technique identifies potential structural changes in the underlying relationships by comparing the stability of regression parameters across different time periods:
Chow_Statistic = (RSS_restricted - RSS_unrestricted) / RSS_unrestricted × (n-2k)/k
where RSS represents residual sum of squares, n represents sample size, and k represents the number of parameters.
4. Implementation Parameters and Configuration
4.1 Language Selection Parameters
The model provides comprehensive multi-language support across five languages: English, German (Deutsch), Spanish (Español), French (Français), and Japanese (日本語). This feature enhances accessibility for international users and ensures cultural appropriateness in terminology usage. The language selection affects all internal displays, statistical classifications, and alert messages while maintaining consistency in underlying calculations.
4.2 Model Configuration Parameters
Calculation Method: Users can select from four aggregation methodologies:
- Equal-Weighted: All components receive identical weights
- Variance-Weighted: Components weighted inversely to their historical variance
- Principal Component: Weights determined through principal component analysis
- Dynamic: Adaptive weighting based on recent performance
Sector Specification: The model allows for sector-specific calibration:
- General: Broad-based small business assessment
- Retail: Emphasis on consumer demand and seasonal factors
- Manufacturing: Enhanced weighting of input costs and currency effects
- Services: Focus on labor market dynamics and consumer demand
- Construction: Emphasis on credit conditions and monetary policy
Lookback Period: Statistical analysis window ranging from 126 to 504 trading days, with 252 days (one business year) as the optimal default based on academic research.
Smoothing Period: Exponential moving average period from 1 to 21 days, with 5 days providing optimal noise reduction while preserving signal integrity.
4.3 Statistical Threshold Parameters
Upper Statistical Boundary: Configurable threshold between 60-80 (default 70) representing the upper significance level for regime classification.
Lower Statistical Boundary: Configurable threshold between 20-40 (default 30) representing the lower significance level for regime classification.
Statistical Significance Level (α): Alpha level for statistical tests, configurable between 0.01-0.10 with 0.05 as the standard academic default.
4.4 Display and Visualization Parameters
Color Theme Selection: Eight professional color schemes optimized for different user preferences and accessibility requirements:
- Gold: Traditional financial industry colors
- EdgeTools: Professional blue-gray scheme
- Behavioral: Psychology-based color mapping
- Quant: Value-based quantitative color scheme
- Ocean: Blue-green maritime theme
- Fire: Warm red-orange theme
- Matrix: Green-black technology theme
- Arctic: Cool blue-white theme
Dark Mode Optimization: Automatic color adjustment for dark chart backgrounds, ensuring optimal readability across different viewing conditions.
Line Width Configuration: Main index line thickness adjustable from 1-5 pixels for optimal visibility.
Background Intensity: Transparency control for statistical regime backgrounds, adjustable from 90-99% for subtle visual enhancement without distraction.
4.5 Alert System Configuration
Alert Frequency Options: Three frequency settings to match different trading styles:
- Once Per Bar: Single alert per bar formation
- Once Per Bar Close: Alert only on confirmed bar close
- All: Continuous alerts for real-time monitoring
Statistical Extreme Alerts: Notifications when the index reaches 99% confidence levels (Z-score > 2.576 or < -2.576).
Regime Transition Alerts: Notifications when statistical boundaries are crossed, indicating potential regime changes.
5. Practical Application and Interpretation Guidelines
5.1 Index Interpretation Framework
The SBO-SAM index operates on a 0-100 scale with statistical normalization ensuring consistent interpretation across different time periods and market conditions. Values above 70 indicate statistically elevated small business conditions, suggesting favorable operating environment with potential for expansion and growth. Values below 30 indicate statistically reduced conditions, suggesting challenging operating environment with potential constraints on business activity.
The median reference line at 50 represents the long-term equilibrium level, with deviations providing insight into cyclical conditions relative to historical norms. The statistical confidence bands at 95% levels (approximately ±2 standard deviations) help identify when conditions reach statistically significant extremes.
5.2 Regime Classification System
The model employs a seven-level regime classification system based on percentile rankings:
Very High Regime (P80+): Exceptional small business conditions, typically associated with strong economic growth, easy credit availability, and favorable regulatory environment. Historical analysis suggests these periods often precede economic peaks and may warrant caution regarding sustainability.
High Regime (P60-80): Above-average conditions supporting business expansion and investment. These periods typically feature moderate growth, stable credit conditions, and positive consumer sentiment.
Moderate High Regime (P50-60): Slightly above-normal conditions with mixed signals. Careful monitoring of individual components helps identify emerging trends.
Neutral Regime (P40-50): Balanced conditions near long-term equilibrium. These periods often represent transition phases between different economic cycles.
Moderate Low Regime (P30-40): Slightly below-normal conditions with emerging headwinds. Early warning signals may appear in credit conditions or consumer demand.
Low Regime (P20-30): Below-average conditions suggesting challenging operating environment. Businesses may face constraints on growth and expansion.
Very Low Regime (P0-20): Severely constrained conditions, typically associated with economic recessions or financial crises. These periods often present opportunities for contrarian positioning.
5.3 Component Analysis and Diagnostics
Individual component analysis provides valuable diagnostic information about the underlying drivers of overall conditions. Divergences between components can signal emerging trends or structural changes in the economy.
Credit-Labor Divergence: When credit conditions improve while labor markets tighten, this may indicate early-stage economic acceleration with potential wage pressures.
Demand-Cost Divergence: Strong consumer demand coupled with rising input costs suggests inflationary pressures that may constrain small business margins.
Market-Fundamental Divergence: Disconnection between small-cap equity performance and fundamental conditions may indicate market inefficiencies or changing investor sentiment.
5.4 Temporal Analysis and Trend Identification
The model provides multiple temporal perspectives through momentum analysis, rate of change calculations, and trend decomposition. The 20-day momentum indicator helps identify short-term directional changes, while the Hodrick-Prescott filter approximation separates cyclical components from long-term trends.
Acceleration analysis through second-order momentum calculations provides early warning signals for potential trend reversals. Positive acceleration during declining conditions may indicate approaching inflection points, while negative acceleration during improving conditions may suggest momentum loss.
5.5 Statistical Confidence and Uncertainty Quantification
The model provides comprehensive uncertainty quantification through confidence intervals, volatility measures, and regime stability analysis. The 95% confidence bands help users understand the statistical significance of current readings and identify when conditions reach historically extreme levels.
Volatility analysis provides insight into the stability of current conditions, with higher volatility indicating greater uncertainty and potential for rapid changes. The regime stability measure, calculated as the inverse of volatility, helps assess the sustainability of current conditions.
6. Risk Management and Limitations
6.1 Model Limitations and Assumptions
The SBO-SAM model operates under several important assumptions that users must understand for proper interpretation. The model assumes that historical relationships between economic variables remain stable over time, though the regime-switching framework helps accommodate some structural changes. The 252-day lookback period provides reasonable statistical power while maintaining sensitivity to changing conditions, but may not capture longer-term structural shifts.
The model's reliance on publicly available economic data introduces inherent lags in some components, particularly those based on government statistics. Users should consider these timing differences when interpreting real-time conditions. Additionally, the model's focus on quantitative factors may not fully capture qualitative factors such as regulatory changes, geopolitical events, or technological disruptions that could significantly impact small business conditions.
The model's timeframe restrictions ensure statistical validity by preventing application to intraday periods where the underlying economic relationships may be distorted by market microstructure effects, trading noise, and temporal misalignment with the fundamental data sources. Users must utilize daily or longer timeframes to ensure the model's statistical foundations remain valid and interpretable.
6.2 Data Quality and Reliability Considerations
The model's accuracy depends heavily on the quality and availability of underlying economic data. Market-based components such as equity indices and bond prices provide real-time information but may be subject to short-term volatility unrelated to fundamental conditions. Economic statistics provide more stable fundamental information but may be subject to revisions and reporting delays.
Users should be aware that extreme market conditions may temporarily distort some components, particularly those based on financial market data. The model's statistical normalization helps mitigate these effects, but users should exercise additional caution during periods of market stress or unusual volatility.
6.3 Interpretation Caveats and Best Practices
The SBO-SAM model provides statistical analysis and should not be interpreted as investment advice or predictive forecasting. The model's output represents an assessment of current conditions based on historical relationships and may not accurately predict future outcomes. Users should combine the model's insights with other analytical tools and fundamental analysis for comprehensive decision-making.
The model's regime classifications are based on historical percentile rankings and may not fully capture the unique characteristics of current economic conditions. Users should consider the broader economic context and potential structural changes when interpreting regime classifications.
7. Academic References and Bibliography
Bernanke, B. S., & Blinder, A. S. (1992). The Federal Funds Rate and the Channels of Monetary Transmission. American Economic Review, 82(4), 901-921.
Bernanke, B. S., & Gertler, M. (1995). Inside the Black Box: The Credit Channel of Monetary Policy Transmission. Journal of Economic Perspectives, 9(4), 27-48.
Boot, A. W. A. (2000). Relationship Banking: What Do We Know? Journal of Financial Intermediation, 9(1), 7-25.
Chow, G. C. (1960). Tests of Equality Between Sets of Coefficients in Two Linear Regressions. Econometrica, 28(3), 591-605.
Dunkelberg, W. C., & Wade, H. (2023). NFIB Small Business Economic Trends. National Federation of Independent Business Research Foundation, Washington, D.C.
Engle, R. F., & Granger, C. W. J. (1987). Co-integration and Error Correction: Representation, Estimation, and Testing. Econometrica, 55(2), 251-276.
Fama, E. F. (1970). Efficient Capital Markets: A Review of Theory and Empirical Work. Journal of Finance, 25(2), 383-417.
Federal Reserve Board. (2024). Senior Loan Officer Opinion Survey on Bank Lending Practices. Board of Governors of the Federal Reserve System, Washington, D.C.
Friedman, M. (1957). A Theory of the Consumption Function. Princeton University Press, Princeton, NJ.
Gordon, R. J. (1988). The Role of Wages in the Inflation Process. American Economic Review, 78(2), 276-283.
Hamilton, J. D. (1989). A New Approach to the Economic Analysis of Nonstationary Time Series and the Business Cycle. Econometrica, 57(2), 357-384.
Hurst, H. E. (1951). Long-term Storage Capacity of Reservoirs. Transactions of the American Society of Civil Engineers, 116(1), 770-799.
Kahneman, D., & Tversky, A. (1979). Prospect Theory: An Analysis of Decision under Risk. Econometrica, 47(2), 263-291.
Krugman, P. (1987). Pricing to Market When the Exchange Rate Changes. In S. W. Arndt & J. D. Richardson (Eds.), Real-Financial Linkages among Open Economies (pp. 49-70). MIT Press, Cambridge, MA.
Markowitz, H. (1952). Portfolio Selection. Journal of Finance, 7(1), 77-91.
Mortensen, D. T., & Pissarides, C. A. (1994). Job Creation and Job Destruction in the Theory of Unemployment. Review of Economic Studies, 61(3), 397-415.
Shannon, C. E. (1948). A Mathematical Theory of Communication. Bell System Technical Journal, 27(3), 379-423.
Sharpe, W. F. (1964). Capital Asset Prices: A Theory of Market Equilibrium under Conditions of Risk. Journal of Finance, 19(3), 425-442.
Tsay, R. S. (2010). Analysis of Financial Time Series (3rd ed.). John Wiley & Sons, Hoboken, NJ.
U.S. Small Business Administration. (2024). Small Business Profile. Office of Advocacy, Washington, D.C.
8. Technical Implementation Notes
The SBO-SAM model is implemented in Pine Script version 6 for the TradingView platform, ensuring compatibility with modern charting and analysis tools. The implementation follows best practices for financial indicator development, including proper error handling, data validation, and performance optimization.
The model includes comprehensive timeframe validation to ensure statistical accuracy and reliability. The indicator operates exclusively on daily (1D) timeframes or higher, including weekly (1W), monthly (1M), and longer periods. This restriction ensures that the statistical analysis maintains appropriate temporal resolution for the underlying economic data sources, which are primarily reported on daily or longer intervals.
When users attempt to apply the model to intraday timeframes (such as 1-minute, 5-minute, 15-minute, 30-minute, 1-hour, 2-hour, 4-hour, 6-hour, 8-hour, or 12-hour charts), the system displays a comprehensive error message in the user's selected language and prevents execution. This safeguard protects users from potentially misleading results that could occur when applying daily-based economic analysis to shorter timeframes where the underlying data relationships may not hold.
The model's statistical calculations are performed using vectorized operations where possible to ensure computational efficiency. The multi-language support system employs Unicode character encoding to ensure proper display of international characters across different platforms and devices.
The alert system utilizes TradingView's native alert functionality, providing users with flexible notification options including email, SMS, and webhook integrations. The alert messages include comprehensive statistical information to support informed decision-making.
The model's visualization system employs professional color schemes designed for optimal readability across different chart backgrounds and display devices. The system includes dynamic color transitions based on momentum and volatility, professional glow effects for enhanced line visibility, and transparency controls that allow users to customize the visual intensity to match their preferences and analytical requirements. The clean confidence band implementation provides clear statistical boundaries without visual distractions, maintaining focus on the analytical content.

ES/NQ, Pre-Market High & Low (04:00 AM - 09:30 AM)This indicator marks the Pre market high and Pre market low from 04:00am to 09:30am for any us Index

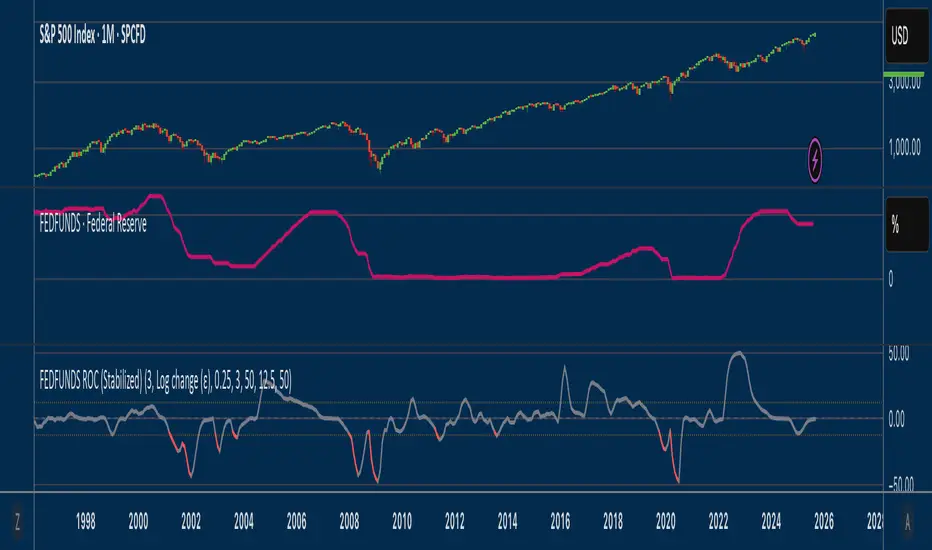
Fed Funds Rate-of-ChangeFed Funds Rate-of-Change
What it does:
This indicator pulls the Effective Federal Funds Rate (FRED:FEDFUNDS, monthly) and measures how quickly it’s changing over a user-defined lookback. It offers stabilized change metrics that avoid the “near-zero blow-up” you see with naive % ROC. The plot turns red only when the signal is below the lower threshold and heading down (i.e., value < –threshold and slope < 0).
This indicator is meant to be useful in monitoring fast cuts on the part of the FED - a signal that has preceded recession or market pullbacks in times prior.
Change modes: Percentage, log and delta.
Percent ROC (ε floor): 100 * (now - prev) / max(prev, ε)
Log change (ε): 100 * (ln(now + ε) - ln(prev + ε))
Delta (bps): (now - prev) * 100 (basis points; avoids percentage math)
Tip: For “least drama,” use Delta (bps). For relative change without explosions near zero, use Log change (ε).
Key inputs:
Lookback (months): ROC window in calendar months (because source is monthly).
Change Metric: one of the three options above.
ε (percentage points): small constant (e.g., 0.25 pp) used by Percent ROC (ε) and Log change (ε) to stabilize near-zero values.
EMA Smoothing length: light smoothing of the computed series.
Clip |value| at: optional hard cap to tame outliers (0 = off).
Threshold % / Threshold bps: lower/upper threshold band; unit adapts to the selected metric.
Plot as histogram: optional histogram view.
Coloring / signal logic
Red: value is below the lower threshold (–threshold) and the series is falling on the current bar.
How to use:
Add to any chart (timeframe doesn’t matter; data is monthly under the hood).
Pick a Change Metric and set Lookback (e.g., 3–6 months).
Choose a reasonable threshold:
Percent/Log: try 10–20%
Delta (bps): try 50–100 bps
Optionally smooth (EMA 3–6) and/or clip extreme spikes.
Interpretation
Sustained red often marks periods of accelerating downside in the Fed Funds change metric (e.g., policy easing momentum when using bps).
Neutral (gray) provides context without implying direction bias.
Notes & limitations
Source is monthly FRED series; values update on monthly closes and are stable (no intrabar repainting of the monthly series).
Threshold units switch automatically with the metric (%, %, or bps).
Smoothing/clip are convenience tools; adjust conservatively to avoid masking important shifts.
Mongoose Global Conflict Risk Index v1Overview
The Mongoose Global Conflict Risk Index v1 is a multi-asset composite indicator designed to track the early pricing of geopolitical stress and potential conflict risk across global markets. By combining signals from safe havens, volatility indices, energy markets, and emerging market equities, the index provides a normalized 0–10 score with clear bias classifications (Neutral, Caution, Elevated, High, Shock).
This tool is not predictive of headlines but captures when markets are clustering around conflict-sensitive assets before events are widely recognized.
Methodology
The indicator calculates rolling rate-of-change z-scores for eight conflict-sensitive assets:
Gold (XAUUSD) – classic safe haven
US Dollar Index (DXY) – global reserve currency flows
VIX (Equity Volatility) – S&P 500 implied volatility
OVX (Crude Oil Volatility Index) – energy stress gauge
Crude Oil (CL1!) – WTI front contract
Natural Gas (NG1!) – energy security proxy, especially Europe
EEM (Emerging Markets ETF) – global risk capital flight
FXI (China ETF) – Asia/China proxy risk
Rules:
Safe havens and vol indices trigger when z-score > threshold.
Energy triggers when z-score > threshold.
Risk assets trigger when z-score < –threshold.
Each trigger is assigned a weight, summed, normalized, and scaled 0–10.
Bias classification:
0–2: Neutral
2–4: Caution
4–6: Elevated
6–8: High
8–10: Conflict Risk-On
How to Use
Timeframes:
Daily (1D) for strategic signals and early warnings.
4H for event shocks (missiles, sanctions, sudden escalations).
Weekly (1W) for sustained trends and macro build-ups.
What to Look For:
A single trigger (for example, Gold ON) may be noise.
A cluster of 2–3 triggers across Gold, USD, VIX, and Energy often marks early stress pricing.
Elevated readings (>4) = caution; High (>6) = rotation into havens; Shock (>8) = market conviction of conflict risk.
Practical Application:
Monitor as a heatmap of global stress.
Combine with fundamental or headline tracking.
Use alert conditions at ≥4, ≥6, ≥8 for systematic monitoring.
Notes
This indicator is for informational and educational purposes only.
It is not financial advice and should be used in conjunction with other analysis methods.

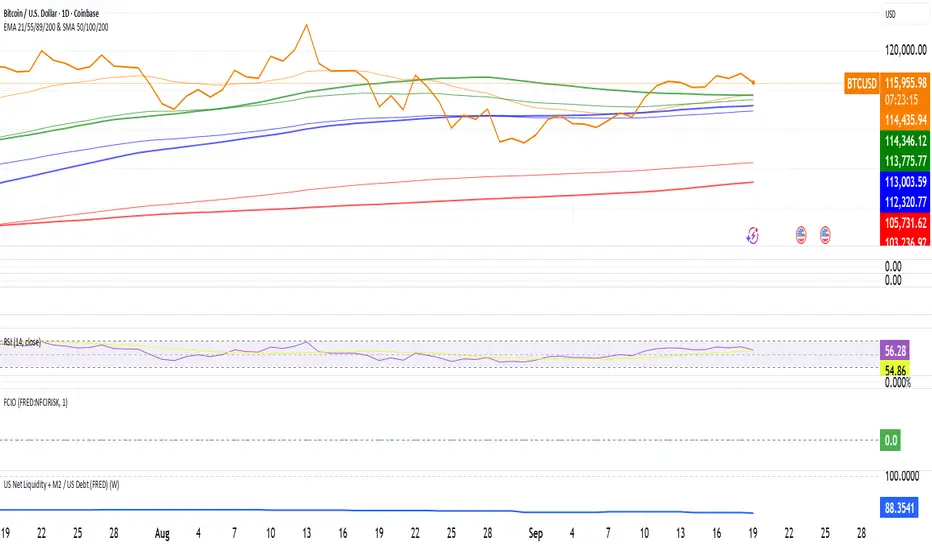
US Net Liquidity + M2 / US Debt (FRED)US Net Liquidity + M2 / US Debt
🧩 What this chart shows
This indicator plots the ratio of US Net Liquidity + M2 Money Supply divided by Total Public Debt.
US Net Liquidity is defined here as the Federal Reserve Balance Sheet (WALCL) minus the Treasury General Account (TGA) and the Overnight Reverse Repo facility (ON RRP).
M2 Money Supply represents the broad pool of liquid money circulating in the economy.
US Debt uses the Federal Government’s total outstanding debt.
By combining net liquidity with M2, then dividing by total debt, this chart provides a structural view of how much monetary “fuel” is in the system relative to the size of the federal debt load.
🧮 Formula
Ratio
=
(
Fed Balance Sheet
−
(
TGA
+
ON RRP
)
)
+
M2
Total Public Debt
Ratio=
Total Public Debt
(Fed Balance Sheet−(TGA+ON RRP))+M2
An optional normalization feature scales the ratio to start at 100 on the first valid bar, making long-term trends easier to compare.
🔎 Why it matters
Liquidity vs. Debt Growth: The numerator (Net Liquidity + M2) captures the monetary resources available to markets, while the denominator (Debt) reflects the expanding obligation of the federal government.
Market Signal: Historically, shifts in net liquidity and money supply relative to debt have coincided with major turning points in risk assets like equities and Bitcoin.
Context: A rising ratio may suggest that liquidity conditions are improving relative to debt expansion, which can be supportive for risk assets. Conversely, a falling ratio may highlight tightening conditions or debt outpacing liquidity growth.
⚙️ How to use it
Overlay this chart against S&P 500, Bitcoin, or gold to analyze correlations with asset performance.
Watch for trend inflections—does the ratio bottom before equities rally, or peak before risk-off periods?
Use normalization for long historical comparisons, or raw values to see the absolute ratio.
📊 Data sources
This indicator pulls from FRED (Federal Reserve Economic Data) tickers available in TradingView:
WALCL: Fed balance sheet
RRPONTSYD: Overnight Reverse Repo
WTREGEN: Treasury General Account
M2SL: M2 money stock
GFDEBTN: Total federal public debt
⚠️ Notes
Some FRED series are updated weekly, others monthly—set your chart timeframe accordingly.
If any ticker is unavailable in your plan, replace it with the equivalent FRED symbol provided in TradingView.
This indicator is intended for macro analysis, not short-term trading signals.
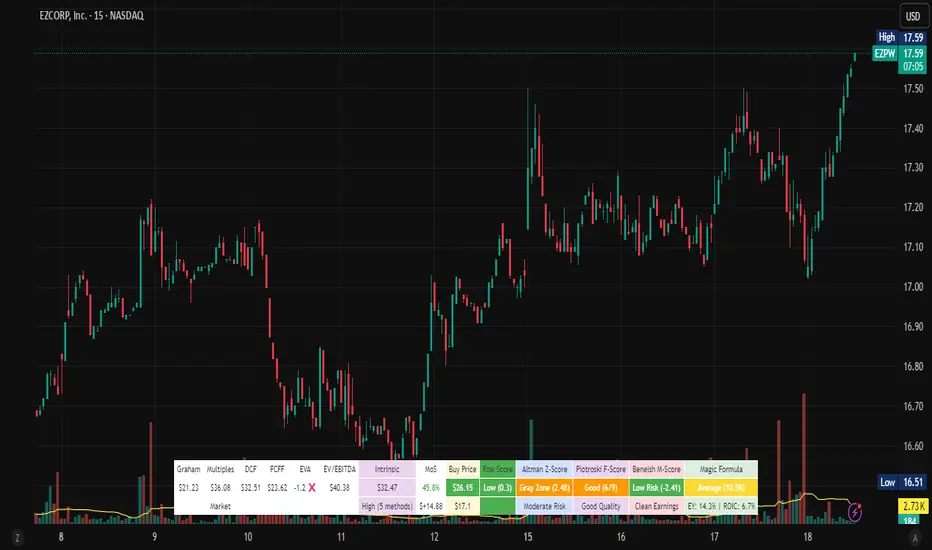
Stock Valuation Models - Professional Investment Analysis Tool📊 Overview
Stock Valuation Models is a comprehensive financial analysis indicator that combines multiple valuation methodologies to calculate intrinsic stock value. This professional-grade tool implements 7 different valuation methods , risk assessment framework, and financial health metrics to provide data-driven investment decisions.
🎯 Key Features
📈 Multiple Valuation Methods
Graham's Valuation - Conservative asset-based approach by Benjamin Graham
Multiples Valuation - Market-based P/E and P/B ratios from sector peers
Discounted Cash Flow (DCF) - Future cash flow projections with present value calculation
Dividend Discount Model - Gordon Growth Model for dividend-paying stocks
FCFF Model - Enterprise-level Free Cash Flow to Firm analysis
EVA Model - Economic Value Added measurement above cost of capital
Advanced Multiples - Enterprise Value ratios (EV/EBITDA, EV/Sales)
🏥 Financial Health Metrics
Altman Z-Score - Bankruptcy prediction and financial distress assessment
Piotroski F-Score - 9-point fundamental strength evaluation
Beneish M-Score - Earnings manipulation detection system
Magic Formula - Joel Greenblatt's combined quality and value scoring
⚖️ Risk Assessment Framework
Multi-Factor Risk Scoring - Fundamental, market, quality, and data quality risks
Risk-Adjusted Margin of Safety - Dynamic safety thresholds based on risk level
Position Sizing Guidance - Risk-appropriate investment allocation recommendations
🔍 Data Quality System
Real-Time Quality Tracking - Visual warnings for insufficient data
Fallback Methodology - Alternative calculations when primary data unavailable
Confidence Scoring - Method agreement and data quality assessment
⚙️ Settings & Parameters
Main Settings
Margin of Safety (%) - Minimum discount required before buying (Default: 15%)
Table Font Size - Choose between "Small" and "Normal" text size
Valuation Methods
Graham's Valuation - Best for mature, stable companies with strong fundamentals
Multiples Valuation - Compares to industry peers using dynamic sector ratios
Discounted Cash Flow - Ideal for growth companies with predictable cash flows
Dividend Discount Model - For consistent dividend-paying stocks (disabled by default)
FCFF Model - Enterprise approach for leveraged companies and M&A analysis
EVA Model - Measures value creation above cost of capital
Advanced Multiples - Wall Street standard EV ratios for professional analysis
Additional Metrics
Magic Formula - Combined quality and value scoring system
Altman Z-Score - Bankruptcy risk assessment (Safe >2.99, Distress <1.81)
Piotroski F-Score - Fundamental quality score (Excellent ≥8, Poor <4)
Beneish M-Score - Manipulation detector (High Risk >-2.22, Low Risk ≤-2.22)
🔧 How It Works
Dynamic Calculations
Sector-Based Ratios - Automatically detects company sector and applies appropriate valuation multiples
Economic Integration - Uses real-time risk-free rates, VIX volatility, and GDP growth data
Quality Weighting - Adjusts method weights based on company type (growth/mature/distressed) and market conditions
Negative Value Handling - Shows actual calculated values but excludes negative results from weighted average
Risk-Adjusted Analysis
VIX Integration - Higher market volatility increases required margin of safety
Sector Risk Premiums - Energy and Financial sectors get higher risk multipliers
Quality Adjustments - High Piotroski F-Score companies get lower risk ratings
Data Quality Impact - Insufficient data increases risk score and safety requirements
Visual Display
Horizontal Table Layout - Organized by method groups (Valuation → Results → Risk → Health)
Color-Coded Results - Green/Yellow/Red indicators for risk levels and recommendations
Warning Symbols - ⚠️ for data quality issues, ❌ for excluded negative values
Dollar Amounts - Both percentage and dollar-based margin of safety calculations
📈 Interpretation Guide
💎 Intrinsic Value Results
Weighted Average - Combines all enabled methods based on intelligent weighting
Confidence Level - High/Medium/Low based on method agreement and data quality
Method Count - Number of successful valuation calculations
🎯 Margin of Safety
Percentage - Current discount/premium to calculated intrinsic value
Dollar Amount - Absolute dollar difference per share
Buy Price - Risk-adjusted target purchase price
⚖️ Risk Assessment
Low Risk (Green) - Normal position sizing (3-5%)
Medium Risk (Yellow) - Reduced position sizing (1-3%)
High Risk (Red) - Minimal position sizing (<1%)
📊 Recommendations
STRONG BUY - Low risk + adequate margin + high confidence
BUY - Meets risk-adjusted margin requirements
HOLD - Positive margin but higher risk
SELL - Insufficient margin for risk level
🎓 Educational Tooltips
Every parameter includes detailed explanations accessible by hovering over the setting. Learn about:
When to use each valuation method
How different metrics are calculated
Interpretation thresholds and ratings
Risk factors and quality indicators
💡 Best Practices
🚀 For Growth Stocks
Enable DCF and Advanced Multiples
Focus on Piotroski F-Score for quality assessment
Use higher margin of safety due to volatility
💰 For Value Stocks
Enable Graham's and Multiples Valuation
Check Altman Z-Score for financial stability
Consider Magic Formula rating
📈 For Dividend Stocks
Enable Dividend Discount Model
Focus on sustainable dividend coverage
Check for consistent dividend history
⚠️ For Distressed Situations
Prioritize Graham's asset-based approach
Monitor Altman Z-Score closely
Use higher risk-adjusted margins
⚠️ Important Notes & Data Limitations
📅 Data Timing Considerations
Fundamental Data Lag - Company financial data (earnings, cash flows, balance sheet items) may be 1-3 months behind current market conditions
Quarterly Reporting Delays - Most recent available data reflects the company's situation as of the last filed quarterly/annual report
Market vs. Fundamentals Gap - Stock prices react instantly to news, while fundamental data updates occur periodically
Accuracy Impact - Recent business changes, market events, or company developments may not be reflected in current calculations
🔧 Technical Limitations
Data Dependencies - Requires fundamental data availability from TradingView
Quality Warnings - Pay attention to ⚠️ symbols indicating insufficient data
Risk Context - Always consider risk score in investment decisions
Market Conditions - Tool automatically adjusts for market volatility (VIX)
Sector Specificity - Ratios automatically adjust based on company's sector
💡 Best Practice Recommendations
Supplement with Current Analysis - Always combine with recent news, earnings calls, and management guidance
Monitor Data Quality - Check when the underlying financial data was last updated
Consider Market Context - Factor in recent market events that may affect company performance
Use as Starting Point - Treat calculations as baseline analysis requiring additional research
🔗 Methodology
Based on established academic research and professional practices:
Benjamin Graham - Security Analysis principles
Joel Greenblatt - Magic Formula methodology
Edward Altman - Z-Score bankruptcy prediction
Joseph Piotroski - Fundamental analysis scoring
Messod Beneish - Earnings manipulation detection
Modern Portfolio Theory - Risk-adjusted decision making
This indicator is designed for educational and analytical purposes. Always conduct additional research and consider consulting with financial professionals before making investment decisions.
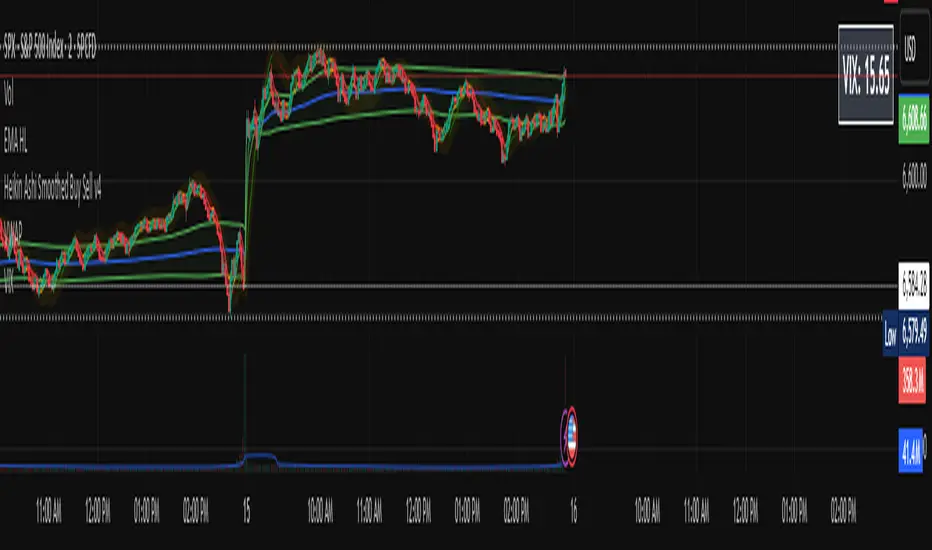
VIX Price BoxVIX Price Box (Customizable Colors)
This indicator displays the current VIX (CBOE Volatility Index) value in a fixed box on the top-right corner of the chart. It’s designed to give traders a quick, at-a-glance view of market volatility without needing to switch tickers.
Features
Pulls the live VIX price and updates automatically on every bar.
Displays the value inside a table box that stays fixed in the top-right corner.
Threshold-based coloring: the text color changes depending on whether the VIX is below, between, or above your chosen threshold levels.
5 built-in color modes:
Custom mode – choose your own colors for low, medium, and high volatility zones.
Adjustable threshold levels, background color, and frame color.
Use Cases
Monitor overall market risk sentiment while trading other instruments.
Identify periods of low vs. high volatility at a glance.
Pair with strategies that rely on volatility (options trading, hedging, breakout setups, etc.).